www.advmatinterfaces.de
Liquid–Liquid Interfacial Imaging Using Atomic
Force Microscopy
Luca Costa, Giovanni Li-Destri, Diego Pontoni, Oleg Konovalov, and Neil H. Thomson*
DOI: 10.1002/admi.201700203
1. Introduction
Liquid/liquid interfaces are of great interest because many of the processes
occurring there are present in nature,[1]
i.e., a living cell membrane.[2] Moreover,
liquid interfaces are employed in a large number of applications, ranging from nanoparticle (NP) self-assembly[3] to
elec-trochemistry[4] and biology as well as being
used as a substrate for thin films.[5] Optical
techniques such as Brewster angle micro-scopy[6] or confocal microscopy[3a] can be
used to characterize liquid interfaces in real space, but the lateral resolution cannot typically surpass intrinsic optical limits in the range of hundreds of nanometers.
Grazing-incidence X-ray diffraction,[7]
grazing-incidence small angle X-ray scat-tering (GISAXS)[8] or X-ray[3b] and neutron
reflectivity[9] can be employed to provide
structural information of the interface in reciprocal space with much higher resolu-tion in and out of the plane. Data are aver-aged, however, across the X-ray or neutron beam footprint (typically hundreds of µm2)
over the interface and therefore cannot provide local informa-tion over a few microns squared. This work applies atomic force microscopy (AFM), which can provide high lateral resolution in real space, to the study of liquid/liquid interfaces.
Since its invention,[10] AFM has been a versatile technique
to study interfaces at the nanoscale in real space in different
environments, ranging from ambient[11] or liquid[12] to vacuum
conditions,[13] nowadays at high temporal resolution.[14]
Previ-ously, investigations have almost exclusively been limited to solid surfaces, where force control is easier and vibration isola-tion may be less critical. The interest in liquid interfaces (such as liquid/gas and liquid/liquid interfaces) has, until now, been limited mainly to the study of the interaction force between the
AFM probe and the liquid interface.[15] While pioneer works on
microscale oil droplets in water revealed the possibility to
char-acterize oil–water interfaces,[16] high-resolution imaging
capa-bilities on a macroscale interface was yet to be demonstrated. Since liquids do not support shear forces these are very chal-lenging systems to probe and imaging the interface requires the presence of an interfacial material thin film. Recently, the first nanoscale resolved images of macroscale liquid/liquid
interfaces were reported.[17] Monolayers of silica nanoparticles
self-assembled at the water/heptane interface were imaged at nanometer resolution by amplitude modulation AFM. Data
Nanoscale imaging of a liquid/liquid interface by atomic force microscopy (AFM) is achieved through the self-assembly of interfacial layers of either polymers, lipids, or nanoparticles. Stabilization of the interface through spreading of a thin film of polystyrene-b-poly(methyl-methacrylate) block copolymer or 1,2-dioleoyl-sn-glycero-3-phosphoethanolamine lipids or adsorption of monolayers of silica nanoparticles allows reproducible imaging of these soft materials at an oil/water interface with nanoscale resolution on a timescale of 10 s. Amplitude modulation AFM is employed and requires that the subphase of water is below a critical depth of 100 µm to prevent excitation of gravity waves at the interface. The amplitude of these vertical oscillations is of the order of 1 nm but increases with the water layer depth. Below this critical water layer depth, force measurements show a linear compliance of the water/heptane and water/octane interfaces to be close to 10−2 N m−1. This study discusses in detail the experimental
setup, sample preparation procedures, and AFM parameters necessary to achieve nanoscale resolution at the extremely soft and dynamic liquid interface. This expands the application of AFM to structural and dynamic nanoscale measurements for soft matter, biological, and nanomaterials away from solid supports.
Dr. L. Costa
CBS, Centre de Biochimie Structurale CNRS UMR5048-INSERM UMR 1054
29, Rue de Navacelles, 34090 Montpellier, France
Dr. L. Costa, Dr. G. Li-Destri, Dr. D. Pontoni, Dr. O. Konovalov ESRF
The European Synchrotron
71, Avenue des Martyrs, 38000 Grenoble, France Dr. D. Pontoni
Partnership for Soft Condensed Matter (PSCM) 71, Avenue des Martyrs, 38000 Grenoble, France Prof. N. H. Thomson
Department of Oral Biology
School of Dentistry and Molecular and Nanoscale Physics Group School of Physics and Astronomy
University of Leeds Leeds LS2 9JT, UK
E-mail: [email protected] Interface Imaging
© 2017 The Authors. Published by WILEY-VCH Verlag GmbH & Co. KGaA, Weinheim. This is an open access article under the terms of the Creative Commons Attribution License, which permits use, distribution and re-production in any medium, provided the original work is properly cited. The copyright line of this paper was changed 27 June 2017 after initial publication.
www.advancedsciencenews.com
www.advmatinterfaces.de
were in good agreement with an independent characterization by GISAXS.
The acquisition of AFM images on the surfaces of liquids is a challenging task due to several physical phenomena:
First, the nucleation of liquid condensates between the AFM tip and the liquid surface may affect force control. Typically, this occurs when working at the solid/air interface in ambient conditions[8c,18] unless the tip is sufficiently sharp.[19] The
cap-illary bridge can limit the lowest achievable tip–sample inter-action force and therefore has important consequences in the vertical and lateral resolution achievable by the microscope. The nucleation of a capillary neck does not necessarily alter the morphology of the solid surface, although it may affect local
physicochemistry.[18a] In the case of liquid surfaces, however,
we would consider the formation of a liquid condensate as a morphological alteration of the liquid surface.
Second, the inertia of a liquid causes issues when moving the AFM probe across the liquid surface. Being a scanning probe microscopy technique, AFM operation requires relative lateral motion between tip and sample. This can be performed by displacing either the AFM tip or the specimen both of which cause relative displacement between the probe and liquid sur-face. In both operational schemes, this results in relative dis-placement between the probe and the liquid surface which are greatly affected by the excitation of gravity waves.
Third, the softness of the liquid/liquid interface is another challenge over and above that of other interfaces usually investi-gated by AFM. Such an investigation typically requires the use of soft cantilevers as is often the case when studying living cells or
soft materials[20] both for AFM static and dynamic modes under
bulk liquid at solid supports. Most importantly, liquids cannot support shear forces and consequently the interface has a time response in the vertical direction once it is displaced. This effect is over and above the time dependencies of the AFM cantilever and feedback loop and needs additional consideration.
Finally, depending on the geometry of the interface and the coverage of the material deposited on it, the interface may be particularly mobile and it may move much faster than the time necessary to acquire a single AFM image. This affects the AFM image producing distortions and artifacts such as longer or shorter observed sample features depending on the direction of the interface movement relative to the slow axis scan direction.
In this paper, we present a reliable sample preparation pro-tocol and AFM operational scheme that permits the acquisition of nanoscale resolved AFM images at liquid interfaces. We demon-strate that a liquid/liquid interface is much more accessible to AFM measurements compared to a liquid/gas interface. We discuss in greater detail each physical limitation listed above and present the first images of polymer and lipid thin films deposited at the water/ octane and water/heptane interfaces as well as a monolayer of silica nanoparticles self-assembled at the water/hexane interface.
2. Results and Discussion
2.1. Characterization of the Interaction Force
Liquid/liquid interfaces are more amenable to AFM com-pared to the liquid/gas interface for several reasons. First, the
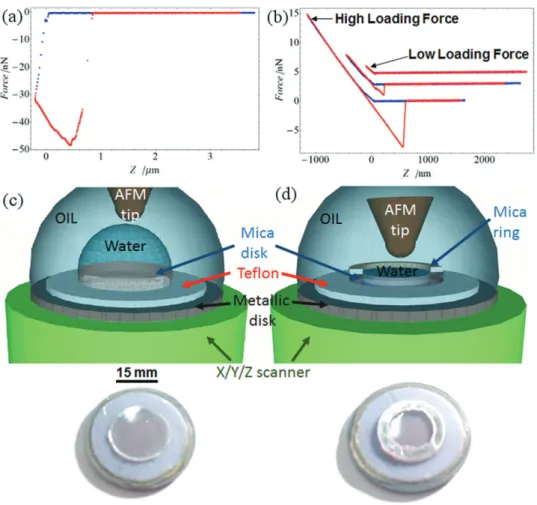
evaporation of the liquid in a liquid/gas configuration imposes limits in the time window accessible to the AFM user to acquire data before the Z scanner reaches its limit due to the inter-face drift. Moreover, the fast nucleation of the capillary bridge between the tip and the liquid surface gives rise to large attrac-tive interactions deforming the liquid interface and holding the tip in the liquid (Figure 1a). The capillary condensate imposes a minimum tip–interface interaction force on the order of sev-eral tens of nN that cannot be reduced. Due to its softness, the interface gets deformed by several nanometers because of this minimum tip–interface interaction force. While it has been shown that a liquid surface can be deformed by a van der Waals interaction occurring before the nucleation of the
capil-lary bridge,[21] stable AFM imaging in absence of capillarity on
macroscale interfaces (mm2 large) still has to be demonstrated.
Indeed, nowadays imaging at liquid/gas is still limited to very
specific cases such as 100 nm to 10 µm nanobubbles supported
by a solid substrate.[22]
At the liquid/liquid interface case, these problems can be avoided. The upper liquid also greatly reduces the evaporation of the liquid layer below. As shown in Figure 1b, the interaction force can be consistently reduced to few tens of pN and therefore reduces the influence of the tip on the interface. While the forma-tion of a capillary neck may still occur at the water/octane inter-face, our data show that adhesion forces can be minimized. As a consequence, the AFM image can be acquired applying small forces on the interface and in the case of amplitude-modulation mode, the tip can oscillate in close vicinity of the interface with small oscillation amplitudes, which is not the case of the liquid/ gas interface where the capillary condensate would nucleate.
The interaction force at the water/octane interface was at first characterized in absence of any specimen at the interface. Approach–retract force curves with different maximum loading forces are shown in Figure 1b, shifted on the force axis for better clarity. The slope of the indentation curve can be inter-preted as a stiffness K evaluated with the equation
α β
=
− −
−
N m m V
m V
1 1
1
K k (1)
where k is the cantilever stiffness, α is the slope of the indenta-tion curve, and β is the optical lever sensitivity. The linear com-pliance, K, of the water/octane interface was determined to be
0.015 N m−1, which we interpret to be a component of the water/
octane interfacial tension. A linear compliance is expected for
a rigid sphere interacting with a liquid planar interface[23] or
drop,[24] and should depend on a number of variables, such as
AFM tip radius and contact angle.[23] A nanoscale Wilhelmy rod
measurement of the interfacial tension can be made using a cylindrical punch of known radius determined from the
adhe-sion force upon retraction.[16b] Figure 1b shows that the
The force curves presented in Figure 1b were obtained at the interface prepared in such a way to minimize the amplitude of the gravity waves of the interface, which are produced by spu-rious external perturbations with gravity as the restoring force toward the average interfacial position.
We have observed gravity waves both at the water/octane and water/heptane interfaces. The amplitude of the waves was dependent on the thickness of the water subphase. Figure 2a shows the AFM cantilever static deflection as a function of time with the AFM tip in contact with the water/octane inter-face for four different water thicknesses, corresponding to four different samples. Figure 2b reports a fast Fourier transform (FFT) of the data in Figure 2a over a timescale of 3 s.
The frequency of oscillation is found to be close to 3.5 Hz. Figure 2c shows the amplitude of oscillation of the waves as a function of the thickness of the water subphase. Figure 2c dem-onstrates limits for the vertical resolution that can be achieved with the AFM at the liquid/liquid interface. It is worth noticing that, depending on the level of harmonic vibrations present below the AFM, the frequency of the waves will change due to
liquid sloshing dynamics.[25] In summary, in order to acquire
AFM images, it is critical to reduce the thickness of the
sub-phase liquid below 300 µm in order to minimize the amplitude
of the gravity waves.[26] We have found a thickness below or
equal to 100 µm at the water/octane and water/heptane
inter-faces to be the suitable subphase thickness to perform reliable AFM imaging.
2.2. Characterization of Morphology by Amplitude Modulation AFM Mode
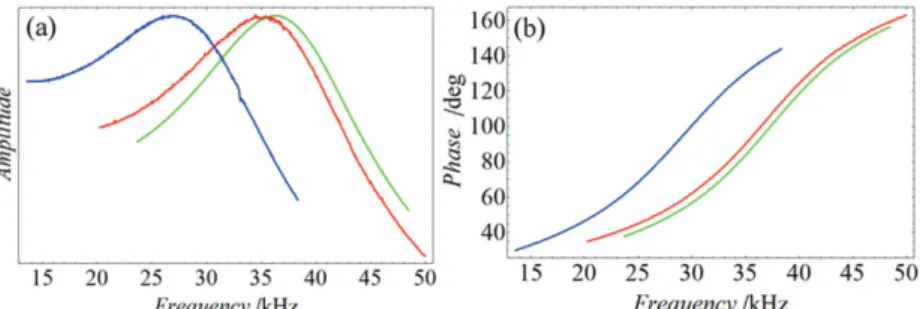
In octane and heptane, the AFM cantilever has a higher reso-nant frequency compared to the denser water (Figure 3). A comparison between the transfer function of an AC40 Olympus cantilever resonating in water, octane, or heptane is reported in Figure 3 where the cantilever was actuated by photothermal excitation. While we observed significant advantages in the use of the photothermal excitation resulting in more stable free oscillation amplitude of the cantilever during oil evaporation, it
Figure 1. Tip–interface interaction force approach–retract curves at liquid/gas (water/air) and liquid/liquid (water/octane) interfaces. a) Water/air interface: the nucleation of the capillary condensate between the tip and the sample exerts a high attractive force on the tip evaluated in several tens of nN. The rupture of the growing condensate occurs at a much larger tip–interface distance (0.8 µm) than the nucleation distance. Adhesion cannot be avoided at the water/air interface when using conventional hydrophilic Si and Si3N4 AFM tips. b) Water/octane interface: force curves taken to different
www.advancedsciencenews.com
www.advmatinterfaces.de
was possible to acquire AFM images with conventional piezo-dither cantilever excitation as well.
Figure 4a,b presents images of the
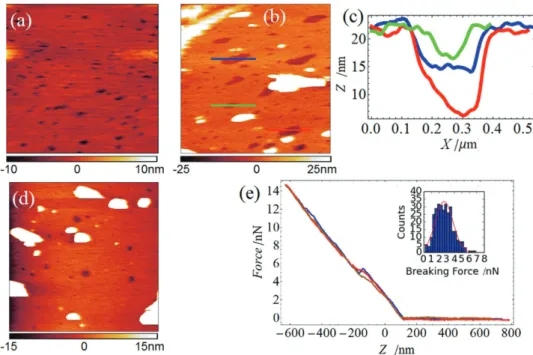
polystyrene-b-poly(methyl-methacrylate) (PS-PMMA) polymeric film spread at the water/heptane interface. The layer morphology is con-tinuous but contains holes or pits with typical depth ranging from 5 to 15 nm (Figure 4c), and is quite different with respect to the one observed for the same block copolymer spread at the
water/air interface.[27] This difference is probably due to the
more expanded conformation adopted by the block copolymers spread at the water/oil interface.[28] In addition, Figure 4d
pre-sents an image obtained with the MFP-3D which demonstrates that a hybrid tip–sample scanning AFM employing piezo-dither tip excitation and a decoupled XY scanner, can also obtain images on liquid interfaces.
Figure 4e shows three typical indentation curves from approximately two hundred recorded at the interface over
a surface of 80 × 80 µm2 using force–volume image
acquisi-tion. Rupture of the film is observed in analogy with the force spectroscopy experiments usually performed on thin films,
e.g., on model lipid membranes.[29] In 90% of the observed
curves, we observe a smooth rupture of the film (red and brown curves) which is very similar to the rupture usually observed on gel-phase model lipid membranes deposited onto a solid
substrate.[29] We evaluate the rupture force to be 3 ± 2 nN as
reported in the histogram, fitted with a Gaussian distribution, shown in the inset of Figure 4f. The film
thickness that is extracted from these inden-tation measurements ranges from 20 to 40 nm.
In the image of Figure 4b, we observe that the holes are all elongated toward the upper-right part of the images. This is due to in-plane drift of the interface or AFM tip relative to each other. The repeatability of imaging a modified liquid/liquid interface is demon-strated in Figure 5. Figure 5a shows a set of four AFM images acquired at 10 s per image where a clear drift of the interface along the
X axis (fast scan direction) is observed. Here
we evaluate the in plane tip–interface drift to be 10 nm s−1
from the apparent movement of the overlying aggregate. In our experimental sessions we have realized that the drift can be minimized by increasing the interface flatness and increasing the material coverage of the interface. While a systematic study of the influence of the surface coverage was not performed, we have found that almost full coverage of the interface is a cru-cial parameter to be able to obtain acceptable AFM images with acquisition time of the order of 1 min per image.
The interface time response is also a key issue. Indeed, one of the intrinsic paradigm of any AFM technique is the fact that the cantilever-base to sample distance can be varied almost instantaneously by a proportional integral counteracting loop driving a Z-scanner piezoelectric element. This displacement is indeed limited just by the AFM electronics and the Z-scanner resonance frequency (typically tens of kHz). The tip–sample distance variation in time is moreover slowed down by the time response of the cantilever, which in amplitude modula-tion depends on the effective quality factor of the cantilever. Indeed, image artifacts caused by the slow time response of the cantilever, when scanning at high speed, are recurrent in daily analysis of AFM experiments, especially in air where cantilevers quality factors are typically one to a few hundred. When measuring in liquids, cantilevers Q factors are smaller
(≈1 to 10) allowing for fast imaging. However, in the case of
liquid interfaces, we have to consider the time response of the
Figure 3. AC40 Olympus cantilever response in frequency in different media: water (blue), octane (red), and heptane (green). a) Normalized oscillation amplitude. b) Phase shift. The cantilever is actuated with photothermal excitation with a Cypher AFM.
interface itself and accept that, due to the liquid inertia, the can-tilever-base to liquid interface and, as a consequence, the tip-to-sample distance cannot be varied instantaneously. Indeed, we interpret the response of a free liquid surface perturbed by the spurious excitation of the liquid container in terms of gravity
waves excited during AFM imaging and liquid sloshing.[15d,30]
An AFM scheme with closed loop feedback to control tip–sample distance imposes a nonharmonic morphology dependent vertical excitation of the free liquid surface which can match the water eigenmodes, giving rise to its motion with consequent phase delay. While gravity waves shown in Figure 2 are excited by vibration present in the experimental setup (i.e., ground vibrations), additional wave excitation can occur during normal AFM closed loop acquisition. We have observed this limitation to be present in both tip-scanning and sample-scan-ning AFMs. In order to reduce excitation of the interface the
water subphase thickness should be kept below 100 µm. This
gives the possibility to acquire reasonably good quality AFM images at the speed of a few seconds per frame (Figure 5).
When the water depth is higher, the scan speed has to be reduced in order to let the AFM counteracting loop follow the
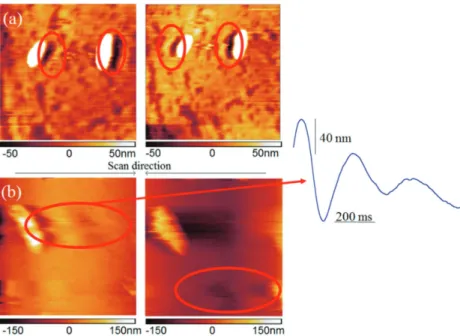
interface topography without becoming unstable because the amplitude of the gravity waves increases with depth. Figure 6 presents the forward and the backward images acquired on the
top of an interface prepared with ≈500 µm water thickness. In
these images, the feedback gains are optimized but there is an overshoot on the downside of the overlaying polymer aggregates which depends on the slow scan direction. The overshooting is due to the low ratio between the scan speed and the interface response time. We interpret such response time as the time required by the interface to dissipate the gravity waves excited by a morphological step encountered during AFM scanning (inset).
Figure 6b shows that this problem is present also when scan-ning with a Z scanner displacing the cantilever base instead of the sample. We interpret this as due to the hydrodynamic forces exerted on the interface and caused by the tip holder motion when it is displaced fast enough to compensate for a varia-tion of the tip oscillavaria-tion amplitude during the scan. Since the AFM image of Figure 6b was acquired at a scan speed of one line/second, we can extract the liquid interface vertical position as a function of time and evaluate the frequency of the gravity waves excited during AFM acquisition which is 3.5 Hz (inset of Figure 6). This frequency matches that measured from the time series data of the cantilever with the tip sitting on the liquid– liquid interface (Figure 2b), demonstrating that these perturba-tions in the images are due to the gravity waves. However, while gravity waves shown in Figure 2b are likely due to a perma-nent vertical mechanical noise below the AFM setup, waves in Figure 6 are due to AFM operation. Indeed, the inset of Figure 6b shows rapid waves dissipation along a flat sample region.
In addition, we tested our AFM protocol on monolayers of 20 nm diameter silica NPs and on 1,2-dioleoyl-sn-glycero-3-phosphoethanolamine (DOPE) phospholipids films, both at
Figure 4. a, b) Images of the PS-PMMA polymeric film at the water/heptane interface obtained with the Cypher AFM. Scan area 1 × 1 µm2 and 2 × 2 µm2,
respectively. We observe holes in the polymeric film and some aggregates. c) Profiles of the holes observed in (b). d) Image obtained with the MFP-3D AFM, scan area 3 × 3 µm2. e) Indentation curves on the polymeric film. We observe rupture forces of the film ranging from 2 to 4 nN. The film
thick-ness ranges from 20 to 40 nm. Inset: distribution of the rupture force for 200 curves.
www.advancedsciencenews.com
www.advmatinterfaces.de
the water/heptane interface. In Figure 7a we can distinguish single nanoparticles self-assembled at the interface. As already men-tioned, interface coverage is a crucial parameter for reproducible AFM imaging at liquid/liquid interface and, for the NP monolayer case, low interface coverage mon-olayers, e.g., gas-like ones,[31] do not allow
reliable imaging since NPs are characterized by high diffusion coefficients. Thus, AFM images were obtained at interface coverages,
between 40% and 53%,[17] ensuring slower
Brownian motions. Interestingly, these inter-face coverage values correspond to the ones
found by Orsi et al.[32] for mixed
NP/sur-factant monolayers at the water/air interface where the NP dynamics slows down or even arrests. In Figure 7b we can observe the pres-ence of sub-100 nm sized globular features in the DOPE lipid film. While we have also observed formation of multilamellar films of DOPE, we interpret the nanosized features in Figure 7b as a self-assembled inverted
hexagonal micelle phase at the interface.[33]
Our work demonstrates that nanoscale reso-lution can be achieved at liquid/liquid inter-faces employing the described AFM protocol on a range of different nanomaterial sys-tems, from hard (silica NPs) to soft (lipid self-assembly).
3. Conclusion
Our work shows the possibility to acquire nanoscale resolved imaging at the liquid– liquid interface. We have presented a sample preparation protocol that facilitates the AFM imaging acquisition and that can be easily implemented with force–distance curves permitting characterization of mechanical stability by recording rupture forces of thin films. We have emphasized the importance of the interface flatness, but moreover shown that the depth of the subphase liquid is a crucial parameter. In our system, a thickness
inferior to 100 µm consistently reduces the
interface time response and consequently the AFM image acquisition time. A larger subphase liquid depth results in a higher amplitude of the gravity waves at the inter-face: the waves are part of the interface mor-phology but are difficult to image properly since their speed (few Hz) is faster than the typical AFM image acquisition time. The sample preparation protocol can be employed to deposit a large variety of samples at liquid/ liquid interfaces, including phospholipids, nanoparticles, and polymers. This gives the opportunity to characterize inorganic and
Figure 6. Long-time response of the interface affecting the acquired morphology (round circles). In contrast with the images in Figure 4, here AFM operation is exciting gravity waves at the interface. At fixed scan speed, the feedback loop cannot vary the cantilever base–liquid interface distance fast enough to compensate for a change in tip oscillation amplitude. Here the loop gains are optimized, but the interface movement is causing overshooting and oscillation artifacts resembling excited gravity waves (inset). Left: forward image, right: backward image. a) Sample scanning AFM (Cypher AFM), scan size: 2 × 2 µm2. b) Hybrid tip–sample scanning AFM (MFP-3D
AFM) where the Z scanner is attached to the cantilever holder, scan size: 5 × 5 µm2.
Figure 7. a) AFM image of 20 nm diameter silica NPs self-assembled in a monolayer at the water/hexane interface. Individual nanoparticles can be distinguished. The image was acquired after replacement of the hexane with heptane after the formation of the monolayer. Scan size: 500 × 500 nm2. b) AFM image of DOPE assemblies at the water/heptane interface. Scan size:
1 × 1 µm2. c) Cross-sectional profiles for image in (a) and (b) revealing the higher roughness of
molecular materials self-assembly directly at liquid/liquid inter-faces in situ, without being forced to transfer the specimen to a solid–liquid interface in order to acquire nanoscale real-space data by AFM.
4. Experimental Section
Interface Preparation: Initially, the liquid/liquid interfaces had been prepared by depositing a few µL of water onto a freshly cleaved mica disk fixed with Araldite glue on a larger teflon disk. The hydrophobicity of the teflon confines the aqueous phase to the mica disk. Then, 200 µL of octane or heptane were deposited on top of the teflon disk, fully covering the surface of water. Afterward, 1 µL of polymer solution was injected in the octane, providing a natural deposition of the polymer at the water/ octane interface. We prepared the liquid/liquid interface and obtained the first images employing this sample preparation. However, we have soon realized the importance of the interface flatness influencing the self-assembly of the specimen and the speed of the tip–interface in-plane drift. As a consequence, we have developed a second protocol which ensures a better interface flatness. A ring of mica was obtained from the original mica disk by using an office paper hole punch. The ring was then glued onto a second freshly cleaved mica disk. Alternatively, we have also employed vacuum grease to fix the mica disk and the mica ring together. This setup ensures higher interface flatness due to the confining walls of the mica disk ring.
A few µL of ultrapure water were then deposited on the mica disk and confined by the internal walls of the mica ring. Octane or heptane was then deposited onto the disk + ring mica holder, fully covering the water surface. At this stage the material was deposited at the interface. Every 5 min the heptane or the octane had to be replenished due to their high evaporation rate and this had obviously important consequences on the AFM user accessible time to set up and run the instrument and on the AFM image acquisition speed.
Atomic Force Microscopy: The images were acquired in amplitude modulation mode. Indeed, it was impossible to obtain AFM images in static mode due to the tip–interface friction forces. We employed an MFP-3D AFM and Cypher AFM (Asylum Research, Oxford Instruments) in static and dynamic modes. The tip–interface interaction force has been measured in static mode whereas the images have been acquired in amplitude-modulation mode with a piezo-dither excitation of the cantilever in the case of the MFP-3D AFM and with a photothermal excitation (BlueDrive) in the case of the Cypher AFM. The MFP-3D is a hybrid tip–sample scanning AFM since the in-plane scan is performed by moving the sample, whereas the Z scanner displaces the cantilever base. The Cypher AFM is solely a sample scanning AFM with displacement on all three axes.
Images were recorded with AC40 Olympus cantilevers resonating at 30 kHz in liquid, nominal stiffness 0.25 N m−1. The interaction
force was measured in static mode with AC40 Olympus cantilevers and Mikromasch CSC17 cantilevers, nominal stiffness 0.18 N m−1. The
cantilever stiffness was determined with the thermal method,[34] whereas
the cantilever sensitivity in [nm V−1] was evaluated employing the Asylum
Research GetReal tool necessitating the rectangular cantilever length and width: 38 × 16 µm2 for the AC40 cantilevers and 450 × 50 µm2 for
the CSC17 cantilevers. The cantilever sensitivity could not be calibrated conventionally, i.e., through the acquisition of tip–sample indentation curves on solid surfaces, because the liquid is deformable. The scan speed was kept below 1 min per image in order to minimize the effects of the tip–interface in-plane drift on the observed morphology for the AFM images presented in Figures 4, 5, and 7. The AFM images presented in Figure 6 were acquired at a scan speed of one line per second, resulting in an image acquisition time of approximately 8.5 min per image. The time-series data to capture the gravity waves presented in Figure 2 were acquired at a sampling rate of 5 kHz.
Materials: Heptane, octane, hexane, and DOPE were purchased from Sigma-Aldrich (St. Louis, MO). Ultrapure water was obtained
from Milli-Q reverse osmosis system, 18.2 MΩ cm resistivity. Mica disks (14 mm diameter, 100 µm thickness) were purchased from Agar Scientific.
PS-PMMA block copolymer, product ID P10197-SMMA, was purchased from Polymer Source, Dorval (Canada). The copolymer relative block length ratio is 50:50, the average molecular weight of both PS and PMMA blocks is 73 kDa, and the overall polydispersity is 1.2. The copolymer was dissolved in chloroform at a final concentration of 0.5 mg mL−1. The water/octane interface was prepared by depositing
one or two µL of ultrapure water on mica, then covering by octane. In order to prepare the copolymeric film at the interface, 1 µL of the solution containing PS-PMMA was injected into the octane and then imaged by AFM. NP dispersion was prepared with ultrapure deionized water at a concentration of 0.1 wt%, 1 × 10⁻³m NaCl, 0.01 × 10⁻³m Cetyl
trimethylammonium bromide (CTAB). The solution was obtained diluting a Sicastar (Micromod) mother aqueous solution of charge stabilized bare silica NPs having a radius of 9.5 nm, 10 mg mL−1 concentration.
CTAB (purity ≥ 99%) and NaCl (purity ≥ 99.999%) were purchased from Sigma-Aldrich. Ultrapure deionized water was used to prepare the dispersions. Before AFM imaging, the solution was sonicated for 30 min. NPs monolayers were formed depositing a few µL of the NPs dispersion in the sample holder, and then covering by hexane. Heptane refilling was then performed regularly every 10–20 min, leading to a complete replacement of hexane and to lower evaporation rates thus permitting more stable AFM imaging.
DOPE film was prepared by dissolving the lipid in chloroform to a final concentration of 0.25 mg mL−1. After preparation of the water/
heptane interface, 1.5 µL of lipid solution was injected into heptane and the film was imaged by AFM.
Acknowledgements
L.C. and G.L.-D. contributed equally to this work. N.H.T. was supported by the EPSRC-funded Leeds EPSRC Nanoscience and Nanotechnology Equipment Facility (LENNF) (EP/K023853/1). The data associated with this paper is available at http://doi.org/10.5518/156. The acknowledgments section was updated August 21, 2017, after initial publication.
Conflict of Interest
The authors declare no conflict of interest.
Keywords
lipids, liquid interface microscopy, nanoparticles, polymers, thin films
Received: February 17, 2017 Revised: April 3, 2017 Published online: May 17, 2017
[1] Dynamics of Adsorption at Liquid Interfaces: Theory, Experiment, Appli-cation, Vol. 1 (Eds: S. Dukhin, G. Kretzschmar, R. Miller) Elsevier, Amsterdam, The Netherlands 1995.
[2] A. G. Volkov, Liquid Interfaces in Chemical, Biological and Pharmaceu-tical Applications, Marcel Dekker Inc, New York, USA 2001. [3] a) Y. Lin, H. Skaff, T. Emrick, A. D. Dinsmore, T. P. Russell,
Sci-ence 2003, 299, 226; b) D. C. E. Calzolari, D. Pontoni, M. Deutsch, H. Reichert, J. Daillant, Soft Matter 2012, 8, 11478.
[4] F. Reymond, D. Fermin, H. J. Lee, H. H. Girault, Electrochim. Acta 2000, 45, 2647.
www.advancedsciencenews.com
www.advmatinterfaces.de [6] S. Uredat, G. H. Findenegg, Langmuir 1999, 15, 1108.
[7] E. E. Kooijman, D. Vaknin, W. Bu, L. Joshi, S. W. Kang, A. Gericke, E. K. Mann, S. Kumar, Biophys. J. 2009, 96, 2204.
[8] a) D. Pontoni, K. J. Alvine, A. Checco, O. Gang, B. M. Ocko, P. S. Pershan, Phys. Rev. Lett. 2009, 102, 016101; b) M. K. Bera, H. Chan, D. F. Moyano, H. Yu, S. Tatur, D. Amoanu, W. Bu, V. M. Rotello, M. Meron, P. Král, B. Lin, M. L. Schlossman, Nano Lett. 2014, 14, 6816; c) G. Li Destri, A. A. Malfatti Gasperini, O. Konovalov, Langmuir 2015, 31, 8856.
[9] J. Reguera, E. Ponomarev, T. Geue, F. Stellacci, F. Bresme, M. Moglianetti, Nanoscale 2015, 7, 5665.
[10] G. Binnig, C. F. Quate, C. Gerber, Phys. Rev. Lett. 1986, 56, 930. [11] a) H. J. Butt, B. Cappella, M. Kappl, Surf. Sci. Rep. 2005, 59, 1;
b) S. Santos, V. Barcons, H. K. Christenson, D. J. Billingsley, W. A. Bonass, J. Font, N. H. Thomson, Appl. Phys. Lett. 2013, 103, 063702; c) M. S. Rodrigues, L. Costa, J. Chevrier, F. Comin, Appl. Phys. Lett 2012, 101, 203105; d) R. Schulze, M. M. L. Arras, G. Li Destri, M. Gottschaldt, J. Bossert, U. S. Schubert, G. Marletta, K. D. Jandt, T. F. Keller, Macromolecules 2012, 45, 4740.
[12] Atomic Force Microscopy in Liquid: Biological Applications (Eds: A. M. Baró, R. G. Reifenberger), Wiley-VCH, Weinheim, Germany 2012.
[13] F. J. Giessibl, Rev. Mod. Phys. 2003, 75, 949.
[14] P. E. Milhiet, D. Yamamoto, O. Berthoumieu, P. Dosset, C. Le Grimellec, J. M. Verdier, S. Marchal, T. Ando, PLoS One 2010, 5, e13240.
[15] a) D. Aston, J. C. Berg, J. Colloid Interface Sci. 2001, 235, 162; b) P. G. Hartley, F. Grieser, P. Mulvaney, G. W. Stevens, Lang-muir 1999, 15, 7282; c) R. R. Dagastine, R. Manica, S. L. Carnie, D. Y. C. Chan, G. W. Stevens, F. Grieser, Science 2006, 313, 210; d) R. Dagastine, L. White, J. Colloid Interface Sci. 2002, 247, 310.
[16] a) A. P. Gunning, A. R. Mackie, P. J. Wilde, V. J. Morris, Langmuir 2004, 20, 116; b) M. H. Uddin, S. Y. Tan, R. Dagastine, Langmuir 2011, 27, 2536.
[17] L. Costa, G. Li-Destri, N. H. Thomson, O. Konovalov, D. Pontoni, Nano Lett. 2016, 16, 5463.
[18] a) S. Santos, M. Stefancich, H. Hernandez, M. Chiesa, N. H. Thomson, J. Phys. Chem. C 2012, 116, 2807; b) S. Carpentier, M. S. Rodrigues, M. V. Vitorino, L. Costa, E. Charlaix, J. Chevrier, Appl. Phys. Lett. 2015, 107, 204101.
[19] V. Barcons, A. Verdaguer, J. Font, M. Chiesa, S. Santos, J. Phys. Chem. C 2012, 116, 7757.
[20] L. Costa, M. S. Rodrigues, N. Benseny-Cases, V. Mayeux, J. Chevrier, F. Comin, PLoS One 2014, 9, e101687.
[21] R. Ledesma-Alonso, D. Legendre, P. Tordjeman, Phys. Rev. Lett. 2012, 108, 106104.
[22] D. Lohse, X. Zhang, Rev. Mod. Phys. 2015, 87, 981.
[23] D. Y. C. Chan, R. R. Dagastine, L. R. White, J. Colloid Interface Sci. 2001, 236, 141.
[24] D. Y. C. Chan, E. Klaseboer, R. Manica, Adv. Colloid Interface Sci. 2011, 165, 70.
[25] R. A. Ibrahim, Liquid Sloshing Dynamics: Theory and Applications, Cambridge University Press, Cambridge, UK 2005.
[26] J. D. Als-Nielsen, D. Jacquemain, K. Kjaer, F. Leveiller, M. Lahav, L. Leiserowitz, Phys. Rep. 1994, 246, 251.
[27] G. Li Destri, F. Miano, G. Marletta, Langmuir 2014, 30, 3345. [28] M. S. Aston, T. M. Herrington, T. F. Tadros, Colloids Surf. 1990, 51, 115. [29] a) L. Redondo-Morata, M. I. Giannotti, F. Sanz, in Atomic Force
Micro scopy in Liquid: Biological Applications (Eds: A. M. Baró, R. G. Reifenberger), Wiley-VCH, Weinheim, Germany 2012; b) B. Gumí-Audenis, F. Sanz, M. I. Giannotti, Soft Matter 2015, 11, 5447. [30] M. Faraday, Philos. Trans. R. Soc. London 1831, 121, 299.
[31] A. J. Mendoza, E. Guzmán, F. Martínez-Pedrero, H. Ritacco, R.G. Rubio, F. Ortega, V.M. Starov, R. Miller, Adv. Colloid Interface Sci. 2014, 206, 303.
[32] D. Orsi, E. Guzmán, L. Liggieri, F. Ravera, B. Ruta, Y. Chushkin, T. Rimoldi, L. Cristofolini, Sci. Rep. 2015, 5, 17930.