DEVELOPMENT AND VALIDATION OF LIQUID
CHROMATOGRAPHIC METHODS FOR THE
ESTIMATION OF SELECTED DRUGS IN
MULTI-COMPONENTS DOSAGE FORMS
Thesis submitted to
The Tamil Nadu Dr. M.G.R. Medical University, Chennai
for the award of degree of
DOCTOR OF PHILOSOPHY
In
PHARMACY
Submitted by
Mrs.K.Y.KAVITHA, M.Pharm.,
Under the guidance of
Dr. R VANKATANARAYANAN, M.Pharm., Ph.D.,
Principal
RVS COLLEGE OF PHARMACEUTICAL SCIENCES, 242-B, Trichy Road, Sulur, Coimbatore -641402
A
DECLARATION
This is to certify that the Ph.D. thesis entitled "DEVELOPMENT AND VALIDATION OF LIQUID CHROMATOGRAPHIC METHODS FOR THE ESTIMATION OF SELECTED DRUGS IN MULTI-COMPONENTS DOSAGE FORMS" submitted to The Tamil Nadu Dr. M.G.R. Medical University, Chennai,for the award of degree ofDOCTOR OF PHILOSOPHY in
PHARMACY was carried out by me under the supervision of Dr. R VANKATANARAYANAN, M.Pharm., Ph.D., Principal, RVS College of Pharmaceutical Sciences, Sulur, Coimbatore - 641 042, Tamil Nadu, India. The contents of this thesis, in full or in parts, have not been submitted to any other Institute or University for the award of any degree or diploma.
Mrs.K.Y.KAVITHA Place: Coimbatore
ACKNOWLEDGEMENT
With the blessing of ubiquitous God let me write that the source of honour for the completion of the work embodied in the present thesis is due to numerous persons by whom I have been inspired, helped and supported during my work done for a Ph.D. degree. First and foremost I want to pay all my homage and emotions to my beloved parents Mr. Yuvarajan K. P. & Mrs. Kalyanasundari .Y
and most venerated grandfather Late. Perumal. U, grandmother Pavayammal
without whose blessing this task would not have been accomplished. I bow my head with utter respect to them for their continuous source of inspiration, motivation and devotion to me.
I would like to devote my sincere gratitude to my guide
Dr.R. Venkatanarayanan for recognizing me as his research student by leading me in the way of chromatography and who conduct this research work to success. I am very much thankful to him for his enthusiasm and essential view on research work followed by his motivation to provide contribution to chemistry. Besides being a wonderful guide, I am deeply honoured to have in my life as he brightens my qualification on academic manner. I wish to convey my deep sense to him for all the guidance he provided me over the time of my academic years. There is no doubt that without his efforts the task would not be achieved. It is my great privilege to have such dedicated guide like him that provides dynamic encouragement to me.
I also owe to, from the deepest corner of heart and indebtedness to Head of the Department Dr. G.Geetha, PSG College of Pharmacy as I have been constantly benefited with them and achieved pragmatic direction.
I express my grateful tribute to Department of Chemistry, RVS College of Pharmaceutical Sciences for providing me the excellent laboratory facilities for accomplishing this work.
I will never forget Dr.S.Sankar, Professor and Dr.J.S.K.Nagarajan,
An endeavor such as a Ph.D. is impossible to accomplish without the generous help and support of Seniors and Colleagues. I would like to take this opportunity to thank those whom I was fortunate to know, work and form friendship. How could I ever forget Dr. G.Subramanian, G.Syamala and K.Umaa
by whom I was inspired for my doctoral work. I am very much thankful to him for his technical guidance and comprehensive exchange of ideas during the course of my research work.
I am very much thankful to my friends Indira Devi, Karthika, Silpha, Anbumalar, Poongodi, Poornima and Anitha , who did not make me feel alone in my research work.
I get this achievement with tremendous support and cooperation of my friends Arulanandham, Poomani, Poominathan,Kaviarasu,Arun,Bharathi and
Mulaiventhan thank you so much to be such a wonderful friend..
Last but not least, the present research work is beyond belief without the support of my Better half and Son who has contributed in numerous ways to my marathon journey for this research work. It is fact that without his constant positive attitude and never-ending patience, I could not able for the completion of my research work. It is my delight to express my love.
i
CONTENTS
Chapter Title Pg. No.
I. Introduction 1
II. Scope and objective of the work 46 III. PART A - HPLC METHOD DEVELOPMENT AND
VALIDATION OF SELECTED PHARMACEUTICAL
FORMULATIONS Section i. Development and validation of stability indicating HPLC
method for the simultaneous estimation of
linagliptin and metformin hydrochloride 48
1. Drug Profile 48
2. Literature review 50
3. Objective of the work 58
4. Experimental 59
5. Result and discussion
5.1. Development and optimization of the HPLC method 61
5.2. Degradation study 63
5.3. Method Validation 68
6. Calculation and data 85
7. References 111
Section ii. Development and validation of stability indicating HPLC method for the simultaneous estimation of phentermine
and topiramate 116
1. Drug Profile 116
2. Literature review 118
3. Objective of the work 126
4. Experimental 127
5. Result and discussion
5.1. Development and optimization of the HPLC method 129
5.2. Degradation study 132
5.3. Method Validation 136
6. Calculation and data 154
7. References 180
III. PART B - UPLC METHOD DEVELOPMENT AND VALIDATION OF SELECTED PHARMACEUTICAL FORMULATIONS
Section i Development and validation of UPLC method for the
simultaneous estimation of sitagliptin and simvastatin 183
1. Drug Profile 183
2. Literature review 185
3. Objective of the work 198
4. Experimental 199
5. Result and discussion
5.1. Development and optimization of the UPLC method 201
5.2. Method Validation 205
6. Calculation and data 224
ii
Chapter Title Pg. No.
Section ii. Development and validation of UPLC method for the simultaneous estimation of emtricitabne, rilpivirine,
tenofovir disoproxil fumarate 254
1. Drug Profile 254
2. Literature review 257
3. Objective of the work 275
4. Experimental 276
5. Result and discussion
5.1. Development and optimization of the UPLC method 278
5.2. Method Validation 281
6. Calculation and data 303
7. References 341
IV. Summary and Conclusion 349
Appendix
List of Abbreviations
Development and validation of liquid chromatographic method
iii
LIST OF ABBREVIATIONS
°C - Degree centigrade
LOD - Limit of detection
LOQ - Limit of quantification
ACN - Acetonitrile
µg - Microgram
µl - Microlitre
µm - Micrometer
nm - Nanometer
ml - Millilitre
gm - Gram
mg - Miligram
mM - Millmolar
v/v - Volume in volume
hr - Hour
min - Minutes
M - Molar
pH - Hydrogen ion concentration
SD - Standard deviation
RSD - Relative standard deviation
HPLC - High Performance liquid chromatography
UPLC - Ultra Performance liquid chromatography
BEH - Bridged Ethyl Hybrid
PDA - Photodiodo array
UV - Ultraviolet
ICH - International Conferences on Harmonisation
List of Abbreviations
Development and validation of liquid chromatographic method
iv
HETP - Height equivalent to theoretical plates
RF - Response facor
API - Active pharmaceutical ingredients
ppm - Parts per million
FMOC- Cl - 9 fluorenyl methyl chloroformate
Chapter I
Introduction
Development and validation of liquid chromatographic method
1
INTRODUCTION
Pharmaceutical analytical chemistry is an important part in monitoring the quality of pharmaceutical products for safety and efficacy. With the advancement in synthetic organic chemistry and other branches of chemistry including bio analytical sciences and biotechnology, the scopes of analytical chemistry has enhanced to, much higher levels. The emphasis in current use of analytical method particularly involving advance analytical technology has made it possible not only to evaluate the potency of active ingredients in dosage forms and APIs but also to characterize, elucidate, identify and quantify important constituents like active moiety, impurities, metabolites, isomers, chiral components and prediction of the degradations likely impurities being generated. Pharmacopoeias rely more on instrumental techniques rather than the classical wet chemistry method.
1. Importance of analytical methods
Quality is important in every product or service, but it is vital in medicine as it involves life. Unlike other consumer goods, there is no second quality. Therefore analytical methods which are measure the quality of the drug play a very comprehensive role in drug development and follow up activities to assure that a drug product meets the established standard that is stable and will continue to meet proposed quality throughout its shelf life.1
The method should be selective and sensitive to monitor the known and unknown impurities such that they can be produced over a period of time and from laboratory to laboratory i.e these methods should be validated.
Chapter I
Introduction
Development and validation of liquid chromatographic method
2
2. Need for drug analysis
The number of drugs introduced into the market is increasing every year. These drugs may be either new entities or partial structural modification of the existing one.2Very often there is a time delay from the date of introduction of a drug into the market to the date of its inclusion in Pharmacopoeias. This happens because of the possible uncertainties in the continuous and wider usage of these drugs, reports of new toxicities (resulting in their withdrawal from the market), development of long-suffering opposition and introduction of better drugs by competitors. Under these conditions, standards and analytical procedures for these drugs may not be available in the Pharmacopoeias. It becomes necessary, therefore to develop newer analytical methods for such drugs. With the growth of pharmaceutical industry during last several years, there has been a rapid progress in the field of pharmaceutical analysis involving complex instrumentation. Providing simple analytical procedure for complex formulation is a matter of most importance.
In brief, the reasons for the development of newer methods of drug analysis are
The drug or drug combination may not be official in any Pharmacopoeias
A proper analytical procedure for the drug may not be available in the literature due to patent regulations
Analytical methods may not be available for the drug in the form of a formulation due to the interference caused by the formulation excipients
Analytical methods for the quantification of the drug in biological fluids may not be available
Analytical methods for a drug in combination with other drugs may not be available
The existing analytical procedures may require expensive reagents and solvents. It may also involve cumbersome extraction and separation procedures and these may not be reliable.
Chapter I
Introduction
Development and validation of liquid chromatographic method
3
Advantages of Analytical method Validation are
The biggest advantage of method validation is that it builds a degree of confidence, not only for the developer but also to the user
Although the validation exercise may appear costly and time consuming, it eliminates frustrating repetitions and leads to better time management in the end
Minor changes in the conditions such as reagent supplier or grade, analytical setup are unavoidable due to obvious reasons but the method validation absorbs the shock of such conditions and pays for more than invested on the process
Method validation is required when A new method has been developed
Revision of established method
When established methods are used in different laboratories and different analysts etc.
Comparison of methods required
When quality control indicates method changes.
In Pharmaceutical formulation there are lot of combined dosage forms are available. The drugs in multicomponent dosage forms are separate and estimated simultaneously by chromatographic techniques discussed below.
3. Chromatographic Methods
Modern pharmaceutical formulations are complex mixtures containing one or more therapeutically active ingredients, to a number of inert materials like excipients, disintegrates, colours and flavours. In order to ensure quality and stability of the final product, the pharmaceutical analyst must be able to separate the mixtures into individual components prior to quantitative analysis.3,4
Chapter I
Introduction
Development and validation of liquid chromatographic method
4
(supported on a solid or a gel), and packed in a column, spread as a layer or film. The mobile phase may be gaseous or liquid. Those solutes, distributed preferentially in the mobile phase, will move rapidly through the system than those distributed preferentially in the stationary phase. This forms the basis of separation of component present in a sample.5 The distribution of a solute between two phases results from the balance of forces between solute molecules and the molecule of each phase. It reflects the relative attraction or repulsion that molecule or ions of the competing phase shown for the solute and for them. These forces can be polar in nature arising from permanent on induced and dipole moment. In ion exchange chromatography, the forces on the solute molecules are substantially ionic in nature but include polar and non-polar forces as well.
Chromatographic method must having essentially,
Stationary phase
Mobile phase
Sample injection system
Solvent delivery system
Column (support for stationary phase)
Detection by detecting agent
All chromatographic methods involve modifications in these basic components.
3.1. Classification of chromatographic method6,7
The differentiation is based on techniques of chromatography or principle or physical changes used
a. Based on physical states of stationary phase and mobile phases b. Based on principle of separation used
c. Based on chemical nature of stationary phase and mobile phase d. Based on the shape of stationary phase employed
e. Based on purpose of chromatography experiment
Chapter I
Introduction
Development and validation of liquid chromatographic method
5
a. Based on physical states of stationary phase and mobile phases
These are broadly classified as homogeneous or heterogeneous. The chromatography system differ based on the physical states of the phases used.
Homogeneous techniques have both stationary phase and mobile phases as liquid. Eg liquid-liquid chromatography.
Heterogeneous techniques employ different stationary and mobile phases. Eg solid –liquid chromatography, solid-gas chromatography, liquid-gas chromatography etc.
b. Based on principle of separation used
Here the principle used is considered i.e adsorption method or partition method
Adsorption chromatography : Here the sample molecule get separated due to greater affinity to adsorb the solid stationary phase compared to that of mobile phase. This principle is a solid and mobile phase is liquid.
Partition chromatography : Here the sample molecules get separated due to relative differences of dissolution and partition in to different phases/layer. The molecules with greater partition or dissolution into mobile phase is separated faster while that with partition into mobile phase liquid moves slower or latter. Here both stationary phase and mobile phase are liquid in nature or liquid as stationary phase and gas as mobile phase. The liquid on stationary phase exists as a thin layer on a solid background.
c. Based on the chemical nature of stationary phase and mobile phase
The differentiation is based on chromatography column i.e the nature of stationary phase inside the column.
Normal phase chromatography : Here the stationary phase is polar in nature and mobile phase is in non polar nature. Hence on elution non polar compounds are eluted first and polar compound later as they have greater affinity to stationary phase. Mostly used in column chromatography.
Chapter I
Introduction
Development and validation of liquid chromatographic method
6
Reverse phase chromatography : These is reverse to the above method. The stationary phase is non polar and mobile phase is polar in nature. In practice this is highly used to analyte as most of the substance like drugs etc used in our daily life are polar in nature.
Eg: Reverse phase HPLC system
d. Based on the shape of stationary phase
The shape of stationary phases depends on the support used to place the stationary phase, there are two types like column chromatography and planar chromatography.
Column chromatography is one where stationary phase is column shape. It is widely used in types like High pressure liquid chromatography (also medium pressure liquid chromatography), column chromatography, Gas chromatography etc. development of chromatogram occurs in volume aspect.
Planar chromatography is one where in a stationary phase is flat. The development occurs on the planar surface area only. Eg: Thin layer chromatography, High pressure thin layer chromatography and paper chromatography.
e. Based on purpose of chromatography experiment
This is one of the types of chromatography. Here the idea of experiment different. This can be done on both planar type and columnar type of chromatography. The types are
Preparative chromatography : the amount of sample injected or applied is very large and the separated and pure component is collected for use. The desired component of sample is not disposed off. This is also exclusively applied in column types as preparative column chromatography.
Analytical chromatography : Here the sample size applied or injected is very small and the intention is aimed to identify the components in the sample and also their individual concentrations in the sample. The eluted sample from the outlet is disposed off.
f. Based on physical or chemical character of the stationary phase
Chapter I
Introduction
Development and validation of liquid chromatographic method
7
Size exclusion chromatography : There the stationary phase has pores in its matrix. When molecules are allowed to pass through, those with large size travel a shrote path under mobile phase influence and pass out of column first and vice-verse.
Ion exchange chromatography : Here the stationary phase has a definite charged ions. When the sample is passed through, it retains all the molecules with opposite charge and leaves off molecules with same charge. So to elute the bound molecules, need to pass another mobile phase with similar charge to stationary phase to recover the bound molecules (like molecule displacement method).
The modern instrumental techniques of GC and LC provide excellent separation and allow accurate assay of very low concentrations of wide variety of substance in complex mixtures.
In LC method itself again categorised based on particle size of adsorbent for the separation of mixture in to its individual components. They are two types.
A. High Performance Liquid Chromatography B. Ultra Performance Liquid Chromatography
A. High Performance Liquid Chromatography (HPLC) 8-13
This is a sophistication of the century-old technique and is the most widely used of all the analytical separation techniques. In HPLC the liquid mobile phase is forced through the stationary phase under pressure. A simple HPLC includes a solvent reservoir to hold the mobile phase, a pump to pressurize the mobile phase and injector to allow injection of a small volume of the sample mixture under high pressure, a column containing the bed of stationary phase, a detector to detect the presence of components as they exit the column and a recorder to record the detector signal. Most of the drugs in dosage forms can be analyzed by HPLC method because of the several advantages like rapidity, specificity, accuracy, precision and ease of automation in this method. HPLC method eliminates tedious extraction and isolation procedures. Some of the advantages are
Speed (analysis can be accomplished in 20 minutes or less)
Greater sensitivity (various detectors can be employed)
Chapter I
Introduction
Development and validation of liquid chromatographic method
8
Reusable columns (expensive columns but can be used many times for analysis)
Ideal for the substances of low volatility
Easy sample recovery, handling and maintenance
Instrumentation tends itself to automation and quantitation (less time and less labour)
Precise and reproducible
Calculations are done by integrator itself
Suitable for preparative liquid chromatography on a much larger scale. There are different modes of separation in HPLC. They are normal phase mode, reversed phase mode, reverse phase ion pair chromatography, affinity chromatography and size exclusion chromatography (gel permeation and gel filtration chromatography).
In the normal phase mode, the stationary phase is polar and the mobile phase is nonpolar in nature. In this technique, nonpolar compounds travel faster and are eluted first. This is because of the lower affinity between the nonpolar compounds and the stationary phase. Polar compounds are retained for longer times because of their higher affinity with the stationary phase. These compounds, therefore take more time to elute. Normal phase mode of separation is not generally used for pharmaceutical applications because most of the drug molecules are polar in nature and hence take a longer time to elute.
Chapter I
Introduction
Development and validation of liquid chromatographic method
9
are polar in nature, they are not retained for longer times and hence elute faster. The different columns used are octa decyl silane (ODS) or C18, C8, C4, etc., (in the order of increasing polarity of the stationary phase).
In ion exchange chromatography, the stationary phase contains ionic groups like NR3+ or SO3- , which interact with the ionic groups of the sample
molecules. This is suitable for the separation of charged molecules only. Changing the pH and salt concentration can modulate the retention.
Ion pair chromatography may be used for the separation of ionic compounds and this method can also substitute for ion exchange chromatography. Strong acidic and basic compounds may be separated by reversed phase mode by forming ion pairs (columbic association species formed between two ions of opposite electric charge) with suitable counter ions. This technique is referred to as reversed phase ion pair chromatography or soap chromatography.
Affinity chromatography uses highly specific biochemical interactions for separation. The stationary phase contains specific groups of molecules which can adsorb the sample if certain steric and charge related conditions are satisfied. This technique can be used to isolate proteins, enzymes as well as antibodies from complex mixtures.
Size exclusion chromatography separates molecules according to their molecular mass. Largest molecules are eluted first and the smallest molecules last.
Chapter I
Introduction
Development and validation of liquid chromatographic method
[image:19.595.117.494.79.487.2]10
Figure 1 : Schematic diagram of HPLC equipment
The basic components of HPLC are 14-19 (i) Pumping System
(ii) Sample Introduction Device (iii) Chromatographic Column (iv) Detector
(v) Data handling Device
(i) Pumping System
The HPLC pump is very important component of the system. It delivers the constant flow of the mobile phase or phases so that the separation of the components of the mixture occur in a reasonable time. Its performance directly affects retention time, reproducibility and detector sensitivity. Three main types of pumps are used in HPLC to propel the liquid mobile phase through the system are as under
Chapter I
Introduction
Development and validation of liquid chromatographic method
11
b. Reciprocating pump: It has small internal volume (35 to 400 µl). It has high output pressure (up to 10,000 psi) and constant flow rates. But it produces a pulsed flow.
c. Pneumatic or constant pressure pump: They are pulse free, suffer from limited capacity as well as a dependence of flow rate on solvent viscosity and column backpressure. They are limited to pressure less than 2000 psi. There are two type of elution process, i.e. isocratic and gradient,
Isocratic: In this system, the things are kept constant throughout the run. In the case of pumping of mobile phase, the mobile phase composition is kept constant throughout the run. The nominal flow rate accuracy required is ±1% of the set flow .
Gradient: There is some change purposely incorporated during the particular sample run to achieve a better or/and faster separation. In case of pumping mobile phase, the composition of mobile phase is continuously varied during the particular run. The gradient accuracy of ±1% of the step gradient composition is typical.
(ii) Sample Introducing Device
It is not possible to use direct syringe injection on column like GC, as the inlet pressure in LC is too high. Insertion of the sample on to the pressurized column must be as a narrow plug so that the peak broadening attributable to this step is negligible. The injection system itself should have no dead (void) volume. There are three important ways of introducing the sample into injection port.
a. Loop injection: In which, a fixed amount of volume is introduced by making use of fixed volume loop injector.
b. Valve injection: In which, a variable volume is introduced by making use of an injection valve.
Chapter I
Introduction
Development and validation of liquid chromatographic method
12
(iii) Chromatographic Column
Column is a heart of chromatography. The column is usually made up of heavy glass or stainless steel tubing to withstand high pressure. The columns are usually 10-30 cm long and 4-10 mm inside diameter containing stationary phase at particle diameter of 25 µm or less. Columns with an internal diameter of 5 mm give good results because of compromise between efficiency, sample capacity, and the amount of packing and solvent required.
Column packing:
The packing used in modern HPLC consists of small, rigid particles having a narrow particle size distribution. There are three main types of column packing in HPLC.
a. Porous, polymeric beds: Porous, polymeric beds based on styrene divinyl benzene co-polymers used for ion exchange and size exclusion chromatography. For analytical purpose these have now been replaced by silica based, packing which are more efficient and more stable.
b. Porous layer beds: Consisting of a thin shell (1-3 µm) of silica or modified silica on an spherical inert core (e.g. Glass). After the development of totally porous micro particulate packing, these have not been used in HPLC.
c. Totally Porous silica particles (dia. < 10 µm): These packing have widely been used for analytical HPLC in recent years. Particles of diameter > 20 µm are usually dry packed. While particles of diameter < 20 µm are slurry packed in which particles are suspended on a suitable solvent and the slurry so obtained is driven into the column under pressure.
(iv) Detector
Chapter I
Introduction
Development and validation of liquid chromatographic method
13
a. Bulk property detectors: It compares overall changes in a physical property of the mobile phase with and without an eluting solute e.g. refractive index, dielectric constant or density.
b. Solute property detectors: It responds to a physical property of the solute, which is not exhibited by the pure mobile phase e.g. UV absorbance, fluorescence or diffusion current.
HPLC Operation
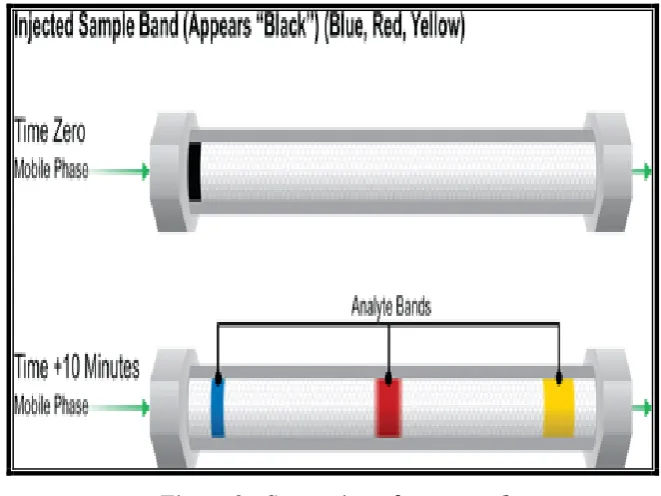
[image:22.595.140.471.285.533.2]A simple way to understand how we achieve the separation of the compounds contained in a sample is to view the diagram in Figure 2.
Figure 2 : Separation of compound
Chapter I
Introduction
Development and validation of liquid chromatographic method
14
After a few minutes [lower image], during which mobile phase flows continuously and steadily past the packing material particles, we can see that the individual dyes have moved in separate bands at different speeds. This is because there is a competition between the mobile phase and the stationary phase for attracting each of the dyes or analytes. Notice that the yellow dye band moves the fastest and is about to exit the column. The yellow dye likes [is attracted to] the mobile phase more than the other dyes. Therefore, it moves at a faster speed, closer to that of the mobile phase. The blue dye band likes the packing material more than the mobile phase. Its stronger attraction to the particles causes it to move significantly slower. In other words, it is the most retained compound in this sample mixture. The red dye band has an intermediate attraction for the mobile phase and therefore moves at an intermediate speed through the column. Since each dye band moves at different speed, we are able to separate it chromatographically.
B. Ultra performance Liquid Chromatography(UPLC)41-46
UPLC can be regarded as new invention for liquid chromatography. UPLC refers to Ultra Performance Liquid Chromatography. UPLC brings dramatic improvements in sensitivity, resolution and speed of analysis can be calculated. It has instrumentation that operates at high pressure than that used in HPLC & in this system uses fine particles(less than 2.5µm) & mobile phases at high linear velocities decreases the length of column, reduces solvent consumption & saves time.
Chapter I
Introduction
Development and validation of liquid chromatographic method
15
Pumps in conventional HPLC systems reach a pressure of maxium 400 bars. Pumps in UPLC systems can reach pressures of 1000 bar and more. This allows the use of smaller particles (< 2.0 mm) and still produce acceptable flow rates (up to 5 ml/min).
The use of smaller particles allows to
Obtain better resolution (separation efficiency) or
Perform faster chromatography
Increase sensitivity, due to sharper (narrower) and higher peaks
This technology takes full advantage of chromatographic principles to run separations using columns packed with smaller particles and/or higher flow rates for increased speed, with superior resolution and sensitivity.
In brief detail, small particle size columns leads to increase in pump pressure so that area was improved and for accurate and precise injection volume needle in needle technology with teflon material was came into the picture. Detector cell volume was reduced for better signals and resolution.
Chapter I
Introduction
Development and validation of liquid chromatographic method
16
Figure 3: Van Deemter plots-influence of particle size
Now, for method conversion from HPLC to UPLC or for comparison of both the technology following aspects needs to take in consideration.
Ratio of column length to particle size (L/dp) needs to keep constant. i.e. 150 mm/5 µm = 30,000 is closest to 50mm/1.7 µm = 29,500
Column selection should be based on same basic column chemistry i.e. C18 column should be replaced by C18 column
5 µm to 1.7 µm particle size leads to increase in speed of 9X along with 9X pressure
3 µm to 1.7 µm particle size leads to increase in speed of 3X along with 3X pressure
5 µm to 1.7 µm particle size leads to increase in peak height of 1.7X
3 µm to 1.7 µm particle size leads to increase in peak height of 1.3X
5 µm to 1.7 µm particle size leads to decrease in peak width of 0.6X
3 µm to 1.7 µm particle size leads to decrease in peak width of 0.8X
Chapter I
Introduction
Development and validation of liquid chromatographic method
17
i.e. 5 µm to 1.7 µm particle size leads to increase in column efficiency (N) 3X but
So, resolution also increase by 1.7X
Based on above fact practically an example for chromatogram comparison against column dimension for run time and resolution is shown in Figure 4.
Remark
Here, X is used to express the mathematical relation in multi fold. e.g. pressure increased by 3X i.e. pressure increase by three times.
Method Development
Chapter I
Introduction
Development and validation of liquid chromatographic method
18
Figure 4 : Chromatogram comparison against column dimension
Chapter I
Introduction
Development and validation of liquid chromatographic method
19
From the above plot and fundamental theory of solvent gives following information for development consideration
Facts for basic compound
1. Alkaline pH increases retention of basic analytes
2. Methanol increases retention of all components compared to acetonitrile 3. Similar basic analytes differ little in selectivity, respective to one
another, when they are either fully charged or uncharged
4. Largest selectivity differences between bonded phases occur with methanol and analytes in their unionized state
Facts for acid compound
1. Acidic pH increases retention of acidic analytes
2. Methanol increases retention of all components compared to acetonitrile 3. Large differences in selectivity are observed when change in pH alters
charge state
4. Largest selectivity differences between bonded phases occur with methanol and analytes in their unionized state
Column chemistry for known columns UPLC are shown in Figure 6. ACQUITY UPLC™ BEH C18
ACQUITY UPLC™ BEH C8
ACQUITY UPLC™ BEH Shield RP18
ACQUITY UPLC™ BEH Pheny
Chapter I
Introduction
Development and validation of liquid chromatographic method
20
By many recent research and development, UPLC presents the ability to extend and expand the utility of separation science at a time when many scientists have reached separation barriers, pushing the limits of conventional HPLC. New chemistry and instrumentation technology can provide more information per unit of work as UPLC begins to fulfill the promise of increased speed, resolution, and sensitivity predicted for liquid chromatography. As this is the concept for the scientist many of the industries may take time to use in routine but it can be the future of the liquid chromatography. Hence present research work includes the extended area of HPLC to UPLC as a part of technology updating or a balance form of present HPLC and improved LC or UPLC for future scope for separation science.
4. Qualitative analysis in LC 20,21
A chromatogram only a single piece of qualitative information about each species in a sample, namely, its retention time or its position on the stationary phase after a certain elution period. It is a widely used tool for recognizing the presence or absence of components of mixtures containing a limited number of possible species whose identities are known. Positive spectroscopic would be impossible without a preliminary chromatographic separation on a complex sample.
5. Quantitative analysis in LC20-21
Chromatography can provide useful quantitative information about the separated species. Quantitative column chromatography is based upon a comparison of either the height or the area of the analyte peak with that of one or more standards. If conditions are properly controlled, these parameters vary linearly with concentration.
Chapter I
Introduction
Development and validation of liquid chromatographic method
21
a. External standard method
The external standard method involves the use of a single standard or up to three solutions. The peak area or the height of the sample and the standard use are compared directly. One can also use the slope of the calibration curve based on standard that contain known concentrations of the compound of interest.
b. Internal standard method
A widely used technique of quantitation involves the addition of an internal standard to compensate for various analytical errors. In this approach, a known compound of a fixed concentration is added to the known amount of samples to give separate peaks in the chromatograms to compensate for the losses of the compounds of interest during sample pre-treatment steps. Any loss of the component of interest will be accompanied by the loss of an equivalent fraction of the internal standard. The accuracy of this approach obviously dependence on the structural equivalence of the compounds of interest and the internal standard. The requirements for an internal standard are:
It must have a completely resolved peak with no interferences,
It must elute close to the compound of interest,
It must behave equivalent to the compound of interest for analysis like pretreatments,
Derivative formations, etc.,
It must be added at a concentration that will produce a peak area or peak height ratio of about unity with the compound,
It must not be present in the original sample,
It must be stable, nonreactive with sample components, column packing and the mobile phase and
Chapter I
Introduction
Development and validation of liquid chromatographic method
22
areas of sample component (A x ) and the internal standard (A ISTD ) obtained by injecting the same quantity. It can be calculated by using the formula,
RF = A x / A ISTD
On the basis of the response factor and strength of the internal standard (N ISTD ), the amount of the analyte in the original sample can be calculated using the formula, X =A S / RF × A ISTD × N ISTD
The calculations described above can be used after proving the linearity of the calibration curve for the internal standard and the analytical reference standard of the compound of interest. When more than one component is to be analyzed from the sample, the response factor of each component should be determined in the calculations using similar formula.
c. Standard addition method
In the standard addition method, a known amount of the standard compound is added to the sample solution to be estimated. This method is suitable if sufficient amount of the sample is available and is more realistic in the sense that it allows calibration in the presence of excipients or other components. As gradient elution can be a source of additional error in quantitative analysis. It is also necessary to keep the flow rate and the mobile phase composition constant. The sample should be dissolved in the mobile phase.
If the solvent used in the preparing the sample solution and the mobile phase are not identical, the analysis can become less accurate and it is also possible that the detector response is more dependent on the sample.
6. Method Development and design of separation method 22-27
The wide variety of equipment, columns, eluent and operational parameters involved makes HPLC method development complex. The process is influenced by the nature of the analyte and generally follows the following steps.
Step 1 - Selection of the HPLC method and initial system Step 2 - Selection of initial condition
Chapter I
Introduction
Development and validation of liquid chromatographic method
23
Step 1 - Selection of the HPLC method and initial system.
When developing an HPLC method, the first step is always to consult the literature to know the physicochemical properties of an analyte. The properties like solubility, polarity ,molecular weight and partition co efficient or key parameter in selecting the wright column and mobile phase for a successful chromatographic separation.
Sample preparation: The sample matrices determine whether the sample
requires dissolution , filtration , extraction, preconcentration or clean up. Chemical dervatisation may be required to assist detection, sensitivity or selectivity .
Types of chromatography: Reverse phase is the choice for the majority of
samples, but if acidic or basic analytes are present then reverse phase ion suppression (for weak acids or bases) or reverse phase ion pairing (for strong acids or bases) should be used. The stationary phase should be C18 bonded. For low/medium polarity analytes, normal phase HPLC is a potential candidate, particularly if the separation of isomers is required.
Gradient HPLC: This is only a requirement for complex samples with a
large number of components (20–30) because the maximum number of peaks that can be resolved with a given resolution is much higher than in isocratic HPLC. This is a result of the constant peak width that is observed in gradient HPLC (in isocratic HPLC peak width increases in proportion to retention time). The method can also be used for samples containing analytes with a wide range of retentivities that would, under isocratic conditions, provide chromatograms with capacity factors outside of the normally acceptable range of 0.5–15.
Column dimensions: For most samples (unless they are very complex),
short columns (10–15 cm) are recommended to reduce method development time. Such columns afford shorter retention and equilibration times. A flow rate of 1-1.5 ml/min should be used initially. Packing particle size should be 3 or 5 μm.
Detectors: Consideration must be given to the following: whether the
Chapter I
Introduction
Development and validation of liquid chromatographic method
24
detectability. Fluorescence or electrochemical detectors should be used for trace analysis. For preparative HPLC, refractive index is preferred because it can handle high concentrations without overloading the detector.
UV wavelength: For the greatest sensitivity λmax should be used, which
detects all sample components that contain chromophores. UV wavelengths below 200 nm should be avoided because detector noise increases in this region. Higher wavelengths give greater selectivity.
Fluorescence wavelength: The excitation wavelength locates the
excitation maximum; that is, the wavelength that gives the maximum emission intensity. The excitation is set to the maximum value then the emission is scanned to locate the emission intensity. Selection of the initial system could, therefore, be based on assessment of the nature of sample and analytes together with literature data, experience, expert system software and empirical approaches.
Step 2 - Selection of initial conditions.
This step determines the optimum conditions to adequately retain all analytes; that is, ensures no analyte has a capacity factor of less than 0.5 (poor retention could result in peak overlapping) and no analyte has a capacity factor greater than 10–15 (excessive retention leads to long analysis time and broad peaks with poor detectability). Selection of the following is then required.
Mobile phase solvent strength: The solvent strength is a measure of its
Chapter I
Introduction
Development and validation of liquid chromatographic method
25
Step 3 - Selectivity optimization.
The aim of this step is to achieve adequate selectivity (peak spacing). The mobile phase and stationary phase compositions need to be taken into account. To minimize the number of trial chromatograms involved, only the parameters that are likely to have a significant effect on selectivity in the optimization must be examined. To select these, the nature of the analytes must be considered.
Step 4 - System parameter optimization.
This is used to find the desired balance between resolution and analysis time after satisfactory selectivity has been achieved. The parameters involved include column dimensions, column-packing particle size and flow rate. These parameters may be changed without affecting capacity factors or selectivity.
Step 5 -Method validation.
Proper validation of analytical methods is important for pharmaceutical analysis when ensure of the continuing efficacy and safety of each batch manufactured relies solely on the determination of quality. The ability to control this quality is dependent upon the ability of the analytical methods, as applied under well-defined conditions and at an established level of sensitivity, to give a reliable demonstration of all deviation from target criteria.
Analytical method validation is now required by regulatory authorities for marketing authorizations and guidelines have been published. It is important to isolate analytical method validation from the selection and development of the method. Method selection is the first step in establishing an analytical method and consideration must be given to what is to be measured, and with what accuracy and precision.
Method development and validation can be simultaneous, but they are two different processes, both downstream of method selection. Analytical methods used in quality control should ensure an acceptable degree of confidence that results of the analyses of raw materials, excipients, intermediates, bulk products or finished products are viable. Before a test procedure is validated, the criteria to be used must be determined.
Chapter I
Introduction
Development and validation of liquid chromatographic method
26
Figure 7 : Different peak shapes in LC method development
The low solubility of the sample in the mobile phase can also cause bad peak shapes. It is always advisable to use the same solvents for the preparation of sample solution as the mobile phase to avoid precipitation of the compounds in the column or injector. Optimization can be started only after a reasonable chromatogram has been obtained.
A reasonable chromatogram means that more or less symmetrical peaks on the chromatogram detect all the compounds. By slight change of the mobile phase composition, the position of the peaks can be predicted within the range of investigated changes. An optimized chromatogram is the one in which all the peaks are symmetrical and are well separated in less run time.
Chapter I
Introduction
Development and validation of liquid chromatographic method
27
a. Resolution (Rs), b. Capacity factor (k'), c. Selectivity (α ),
d. Column efficiency (N) and e. Peak asymmetry factor (As).
a. Resolution (Rs)
Resolution is the parameter describing the separation power of the complete chromatographic system relative to the particular components of the mixture. The resolution, Rs, of two neighbouring peaks is defined as the ratio of the distance between two peak maxima. It is the difference between the retention times of two solutes divided by their average peak width. For baseline separation, the ideal value of Rs is 1.5. It is calculated by using the formula,
Rs = Rt2 - Rt1 / 0.5 (W1 + W2)
Where, Rt1 and Rt2 are the retention time of components 1 and 2 and W1 and W2 are peak width of components 1 and 2.
There are three fundamental parameters that influence the resolution of a chromatographic separation:
* Capacity factor * Selectivity
* Column efficiency
b. Capacity Factor (k')
Chapter I
Introduction
Development and validation of liquid chromatographic method
28
The values of k' of individual bands increase or decrease with changes in solvent strength. In reversed phase HPLC, solvent strength increases with the increase in the volume of organic phase in water/ organic mobile phase. Typically an increase in percentage of the organic phase by 10% by volume will decrease k' of the bands by a factor of 2-3.
Adjusting capacity factor (k'):
Good isocratic method usually have a capacity factor (k') in the range of 2 -10 (typically 2–5). Lower values may give inadequate resolution. Higher values are usually associated with excessively broad peak and unacceptably long run time. If the shift in k' value is observed with both analyst and the column test solution, the problem is most likely due to change in column, temperature or mobile phase composition. This is true if the shift occurs gradually over series of run.
Capacity factor (k') values are sensitive to: * Solvent strength
* Composition * Purity * Temperature * Column chemistry * Sample
c. Selectivity (α )
The selectivity ( separation factor) is a measure of relative retention of two components in a mixture. Selectivity is the ratio of the capacity factors of both peaks, and the ratio of its adjusted retention times. Selectivity represents the separation power of particular adsorbent to the mixture of these particular components.
Chapter I
Introduction
Development and validation of liquid chromatographic method
29
ideal value of is 2. It can be calculated by using formula, α= V2 – V1 / V1 – V0 = k1'/ k2' Where, V0 = the void volume of the column,V1 and V2 = the retention volumes of the second and the first peak respectively.
Adjusting selectivity (α)
When troubleshooting changes in selectivity (α), the approach is similar to the approach used in the capacity factor. When selectivity (α) is affected, the corrective action depends on whether the problem is mobile phase or column related. Be sure to compare results obtained with the test solution to those observed when the column was new.
Selectivity (α) values are sensitive to:
* Changes in mobile phase composition (pH ionic strength) * Purity
* Temperature
d. Column efficiency/ Band broadening
Efficiency N, of a column is measured by the number of theoretical plates per meter. It is a measure of band spreading of a peak. Similar the band spread, higher is the number of theoretical plates, indicating good column and system performance. Column with N ranging from 5,000 to 1,00,000 plates/meter are ideal for a good system.
Efficiency is calculated using the formula,N = 16 Rt2 / W2 Where, Rt is the retention time and W is the peak width.
A decline in measured column efficiency may be due to: * Age and history of the column
* Extra column band broadening (such as due to malfunctioning injector or improper tubing i.d.)
* Inappropriate detector setting
* Change in flow rate and solvent viscosity
Chapter I
Introduction
Development and validation of liquid chromatographic method
30
Asymmetry based (most sensitive to tailing or fronting) * 5 sigma
* 4 sigma * Tangent * 3 sigma * ½ height
* 2 sigma (least sensitive to tailing or fronting)
Choose the method that best suits your operating requirements. It is critical that the same method always be used and executed reproducibly.
e. Peak asymmetry factor (As)
Peak asymmetry factor, can be used as a criterion of column performance. The peak half width, b, of a peak at 10% of the peak height, divided by the corresponding front half width, a, gives the asymmetry factor.
As = b / a
For a well-packed column, an asymmetry factor of 0.9 to 1.1 should be achievable.
7. Validation of analytical method 28-35
“Validation is an act of proving that any procedure, process, equipment, material, activity or system performs as expected under given set of conditions and also give the required accuracy, precision, sensitivity, ruggedness, etc.” When extended to an analytical procedure, depending upon the application, it means that a method works reproducibly, when carried out by same or different persons, in same or different laboratories, using different reagents, different equipment, etc. HPLC method validation is the process used to confirm that the HPLC procedure employed for a specific test is suitable for its intended use. Results from method validation can be used to judge the quality, reliability and consistency of HPLC results, and it is an integral part of any good analytical practice.
Chapter I
Introduction
Development and validation of liquid chromatographic method
31
Pharmaceuticals for Human Use has developed a consensus text on the validation of analytical procedures. The document includes definitions for eight validation characteristics. ICH has also developed appendices with more detailed methodology. The United States Food and Drug Administration (US FDA) has proposed guidelines on submitting samples and analytical data for methods validation. The United States Pharmacopoeia (USP) has published specific guidelines for method validation for compound evaluation. The US FDA has added section 211.222 on ‘methods validation’ to cGMP(Current Good Manufacturing Practices)regulations. This requires the manufacturer to establish and document the accuracy, sensitivity, specificity, reproducibility and any other attribute necessary to validate test methods. The validation is also required to meet the existing requirements for laboratory records provided at Sec. 211.194 (a). These requirements include a statement of each method used in testing the sample to meet proper standards of accuracy and reliability, as applied to the tested product. Representatives of the pharmaceutical and chemical industry have published papers on the validation of analytical methods. Hokanson applied the life cycle approach, developed for computerized systems, to the validation and revalidation of methods. Green gave a practical guide for analytical method validation, with a description of a set of minimum requirements for a method. The validation procedure in this particular article is based on requirements for European Union multi-state registration. Winslow and Meyer recommend the definition of a master plan for validating analytical methods.
7.1. Scope of the method
The scope of the method and its validation parameters and acceptance criteria should be defined early in the process. These includes:
What analytes should be detected?
What are the expected concentration levels?
What are the sample matrices?
Chapter I
Introduction
Development and validation of liquid chromatographic method
32
Are there any specific legislative or regulatory requirements?
Should information be qualitative or quantitative?
What are the required detection and quantitation limits?
What is the expected concentration range?
What precision and accuracy is expected?
How robust should the method be? For example, should the method work at a specific room temperature or should it run independent from room temperatures?
Which type of HPLC should be used, is the method for one specific model from a specific vendor or should it be used by all models from all vendors. This is especially important for HPLC gradient methods, because different instrument may have different delay volumes ranging from 0.5 up to 8 ml. This can have a tremendous impact the separation and elution order of the compounds.
Will the method be used in one specific laboratory or should it be applicable in all laboratories in your organization?
What skills should the anticipated users of the HPLC method have?
The method’s performance characteristics and acceptance criteria should be based on the intended use of the method. It is not always necessary to validate all parameters that are available for HPLC. For example, if the method is to be used for qualitative trace level analysis, there is no need to test and validate the method’s limit of quantitation, or the linearity, over the full dynamic range of the equipment.
Initial parameters should be chosen according to the chromatographer’s experience and best judgment. Final parameters should be agreed between the lab or analytical chemist performing the validation and the lab or individual applying the method.
Chapter I
Introduction
Development and validation of liquid chromatographic method
33
For example, if detection limit is critical for a specific method, the instrument’s specification for baseline noise and, for certain detectors, also the response to specified compounds, should be verified.
Any chemicals used to determine critical validation parameters, such as reagents and reference standards, should be
Available in sufficient quantities
Accurately identified
Sufficiently stable and
Checked for exact composition and purity.
Any other materials and consumables, for example HPLC columns, should be new. This ensures that one set of consumables can be used for most experiments and avoids unpleasant surprises during method validation. If there is little or no information on the method’s performance characteristics, it is recommended to prove the suitability of the method for its intended use in initial experiments. These studies should include the approximate precision, working range and detection limits. If the preliminary validation data appear to be inappropriate, the method itself, the HPLC equipment or the acceptance limits should be changed. HPLC method development and validation is therefore an iterative process. For example, selectivity is achieved through selection of mobile phase composition. For quantitative measurements, the resolution factor between two peaks should be 2.5 or higher. If this value is not achieved, the mobile phase composition needs further optimization.
7.2 Validation parameters36-39
There are no official guidelines on the correct sequence of validation experiments and the optimal sequence may depend on the method itself. Based on our experience, for a liquid chromatographic method, the various validation parameters are as under:
a) Accuracy,
b) Precision(repeatability and reproducibility), c) Linearity and Range,
Chapter I
Introduction
Development and validation of liquid chromatographic method
34
e) Limit of quantitation (LOQ), f) Selectivity/ Specificity, g) Robustness
h) Ruggedness and
i) Stability and System suitability studies.
a) Accuracy
The accuracy of an analytical method may be defined as the closeness of the test results obtained by the method to the true value. It is the measure of the exactness of the analytical method developed. Accuracy may often express as percent recovery by the assay of a known amount of analyte added.
Accuracy may be determined by applying the method to samples or mixtures of excipients to which known amount of analyte have been added both above and below the normal levels expected in the samples. Accuracy is then calculated from the test results as the percentage of the analyte recovered by the assay. Dosage form assays commonly provide accuracy within 3-5% of the true value.
The ICH documents recommend that accuracy should be assessed using a minimum of nine determinations over a minimum of three concentration levels, covering the specified range (i.e. three concentrations and three replicated of each concentration).
b) Precision
The precision of an analytical method is the degree of agreement among individual test results when the method is applied repeatedly to multiple samplings of homogenous samples. This is usually expressed as the standard deviation or the relative standard deviation (coefficient of variation). Precision is a measure of the degree of reproducibility or of the repeatability of the analytical method under normal operating circumstances.
Chapter I
Introduction
Development and validation of liquid chromatographic method
35
Different occasions,
Different laboratories,
Different batch of reagent,
Different analysts,
Different equipments.
i) Determination of repeatability
Repeatability can be defined as the precision of the procedure when repeated by same analyst under the same operating conditions (same reagents, equipments, settings and laboratory) over a short interval of time.
It is normally expected that at least six replicates be carried out and a table showing each individual result provided from which the mean, standard deviation and co-efficient of variation should be calculated for set of n value. The RSD values are important for showing degree of variation expected when the analytical procedure is repeated several time in a standard situation. (RSD below 2% for assays in finished product).
The ICH documents recommend that repeatability should be assessed using a minimum of nine determinations covering the specified range for the procedure (i.e. three concentrations and three replicates of each concentration or using a minimum of six determinations at 100% of the test concentration).
ii) Determination of reproducibility
Reproducibility means the precision of the procedure when it is carried out under different conditions-usually in different laboratories-on separate, identical samples taken from the same homogenous batch of material. Comparisons of results obtained by different analysts, by the use of different equipment, or by carrying out the analysis at different times can also provide valuable information.
c) Linearity and range
Chapter I
Introduction
Development and validation of liquid chromatographic method
36
according to an established mathematical relationship from test results obtained by the analysis of samples with varying concentrations of analyte.
The linear range of detectability that obeys Beer’s law is dependent on the compound analyzed and the detector used. The working sample concentration and samples tested for accuracy should be in the linear range. The claim that the method is linear is to be justified with additional mention of zero intercept by processing data by linear least square regression. Data is processed by linear least square regression declaring the regression co-efficient and b of the linear equation y= ax + b together with the correlation coefficient of determination. For the method to be linear the r value should be close to1 .The range of an analytical method is the interval between the upper and lower levels of the analyte (including these levels) that have been demonstrated to be determined with precision, accuracy and linearity using the method as written.
d) Limit of Detection
Chapter I
Introduction
Development and validation of liquid chromatographic method
37
e) Limit of quantitation
Limit of quantitation is a parameter of quantitative assays for low levels of compounds in sample matrices such as impurities in bulk drugs and degradation products in finished pharmaceuticals. The limit of quantitation is the lowest concentration of analyte in a sample that may be determined with acceptable accuracy and precision when the required procedure is applied.It is measured by analyzing samples containing known quantities of the analyte and determining the lowest level at which acceptable degrees of accuracy and precision are attainable, Where the final assessment is based on an instrumental reading, the magnitude of background response by analyzing a number of blank samples and calculating the standard deviation of this response. The standard deviation multiplied by a factor (usually 10) provides an estimate of the limit of quantitation. In many cases, the limit of quantitation is approximately twice the limit of detection.
f) Selectivity and Specificity
Chapter I
Introduction
Development and validation of liquid chromatographic method
38
the analyte with and without the addition of the potentially interfering materials. When such components are either unidentified or unavailable, a measure of selectivity can often be obtained by determining the recovery of a standard addition of pure analyte to a material containing a constant level of the other components.
g) Robustness
The robustness of an analytical method is a measure of its capacity to remain unaffected by small but deliberate variation in method parameters and provides an indication of its reliability during normal usage. The determination of robustness requires that methods characteristic are assessed when one or more operating parameter varied.
h) Ruggedness
The ruggedness of an analytical method is the degree of reproducibility of test results obtained by the analysis of the same samples under a variety of normal test conditions such as different laboratories, different analysts, using operational and environmental conditions that may differ but are still within the specified parameters of the assay. The testing of ruggedness is normally suggested when the method is to be used in more than one laboratory. Ruggedness is normally expressed as the lack of the influence on the test results of operational and environmental variables of the analytical method. For the determination of ruggedness, the degree of reproducibility of test result is determined as function of the assay variable. This reproducibility may be compared to the precision of the assay under normal condition to obtain a measure of the ruggedness of the analytical method.
i) Stability and System suitability tests
Chapter I
Introduction
Development and validation of liquid chromatographic method
39
time a method is used either before or during analysis. The results of each system suitability test are compared with defined acceptance criteria and if they pass, the method is deemed satisfactory on that occasion. The nature of the test and the acceptance criteria will be based upon data generated during method development optimization and validation experiments.
7.3. Prior steps of Validation
Prior to start method validation, validation aim should be a well-planned according to scientific soundness and completeness with pre-defined acceptance criteria.
Because the type of analysis and the other information of a sample have so much influence on the validation, the objective and scope of the method should always be defined as the first step of any method validation. For an efficient validation process, it is most importance to specify the right validation parameters. Subsequent to the execution of the validation, results, conclusions and deviations should present in report. Provided the pre-defined acceptance criteria are met, and the deviations (if any) do not affect the scientific interpretation of the data, then the developed analytical method can be considered as valid.
8. Current trend 40
Chapter I
Introduction
Development and validation of liquid chromatographic method
40
The development and sales of combined dosage form in Indian Pharmaceutical market is promising. The methods suggested and published for the combined dosage forms are, in many cases, suitable only for the quantification of each component. In another major approach, the pharmaceutical giants are trying to develop the generic version of the innovator formulation in the USA, UK and other developed countries. In this regard the method developed for quality equation of the proposed formulation should have capability to resolve all the major degradation products formed during the routine stability study designed as per ICH guidelines. The routine stability study takes more time to evaluate the formulation for its quality parameters at each time interval using the developed method.
Forced degradation (Stress): Study of the drug component has become an integral part of method development. Forced degradation or stress testing is undertaken to demonstrate specificity when developing stability-indicting methods, particularly when little information is available about potential p


![Figure 28 : Standard chromatogram [ACN:Buffer(57:43,v/v)]](https://thumb-us.123doks.com/thumbv2/123dok_us/509311.70033/162.595.123.500.74.658/figure-standard-chromatogram-acn-buffer-v-v.webp)