This is a repository copy of
An empirical failure-analysis of a large-scale cloud computing
environment
.
White Rose Research Online URL for this paper:
http://eprints.whiterose.ac.uk/80617/
Version: Accepted Version
Proceedings Paper:
Garraghan, P, Townend, P and Xu, J (2014) An empirical failure-analysis of a large-scale
cloud computing environment. In: Clarke, PJ, Zulkernine, N, Paul, RA and Xu, J, (eds.)
Proceedings - 2014 IEEE 15th International Symposium on High-Assurance Systems
Engineering, HASE 2014. 2014 IEEE 15th International Symposium on High-Assurance
Systems Engineering (HASE), 9-11 January 2014, Miami, Florida, USA. IEEE Computer
Society , 113 - 120. ISBN 978-1-4799-3465-2
https://doi.org/10.1109/HASE.2014.24
[email protected] https://eprints.whiterose.ac.uk/
Reuse
Unless indicated otherwise, fulltext items are protected by copyright with all rights reserved. The copyright exception in section 29 of the Copyright, Designs and Patents Act 1988 allows the making of a single copy solely for the purpose of non-commercial research or private study within the limits of fair dealing. The publisher or other rights-holder may allow further reproduction and re-use of this version - refer to the White Rose Research Online record for this item. Where records identify the publisher as the copyright holder, users can verify any specific terms of use on the publisher’s website.
Takedown
If you consider content in White Rose Research Online to be in breach of UK law, please notify us by
An Empirical Failure-Analysis of a Large-Scale
Cloud Computing Environment
Peter Garraghan, Paul Townend, Jie Xu
School of Computing University of Leeds
Leeds, UK
{ scpmg, p.m.townend, j.xu @ leeds.ac.uk }
Abstract—Cloud computing research is in great need of statistical parameters derived from the analysis of real-world systems. One aspect of this is the failure characteristics of Cloud environments composed of workloads and servers; currently, few metrics are available that quantify failure and repair times of workloads and servers at a large-scale. Workload metrics in particular are critical for characterizing and modeling accurate workload behavior, enabling more realistic workload simulation and failure scenarios of systems. This paper presents the analysis of failure data of a large-scale production Cloud environment (consisting of over 12,500 servers), and includes a study of failure and repair times and characteristics for both Cloud workloads and servers. Our results show that failure characteristics for workload and servers are highly variable and that production Cloud workloads can be accurately modeled by a Gamma distribution. Repair times range between 30 seconds to 4 days, and 25 minutes to 8 days, for workloads and servers respectively.
Keywords— Cloud computing, Dependability, Failure analysis, Repair analysis.
I. INTRODUCTION
In order to research and create effective solutions for the problems faced by large-scale Cloud computing environments, it is imperative to analyze data from real-world sources; for example, in the dependability field, a large portion of the state-of-the-art relies on statistical properties and accurate modeling of failure and repair characteristics. According to the National Institute of Standards and Technology (NIST) [1], Cloud computing is defined as "a model for enabling ubiquitous, convenient, on-demand network access to a shared pool of configurable computing resources that can be rapidly provisioned and released with minimal management effort or service provider interaction". The failure characteristics of such environments are of particular concern as failures can result in degradation of Quality of Service (QoS), availability, reliability and energy-waste [2] that can ultimately lead to economic loss for both Cloud consumers and providers.
It has been identified that developing Cloud environments that are both available and reliable (attributes of dependability [3]) is a critical and challenging research problem [4]. However, such analysis is notably challenging, due to the limited real-world Cloud datasets that are available due to confidentiality reasons and - more importantly - the difficulties in analyzing massive system data logs approaching big-data size and complexity. Currently, only a limited amount of work has attempted to analyze Cloud failures characteristics empirically. For example, the authors of [5] analyze outages and incidents reported by companies and news outlets, but do not sufficiently capture the
fine-grained failure characteristics of workload and servers within Cloud environments. The authors of [6] characterize the hardware reliability of Cloud datacenters from a number of data sources, but do not analyze the failure of workloads. The authors of [7] present workload failure characteristics from a production MapReduce supercomputing cluster, but this work is confined to MapReduce type jobs and does not consider workload repair or server failure characteristics. It should also be noted that [6] and [7] utilize datasets that are not publically available.
As a result of this lack of empirical study, a sizable body of current Cloud dependability mechanisms and workload characterization research is derived from analysis of other distributed systems [8-10] or incorporates theoretical values [11-14]. While such work is relevant to enhancing Cloud dependability mechanisms and workload characterization, it comes with significant limitations. Firstly, analyzing the failures of small-scale workloads may not sufficiently represent failure characteristics seen in larger Cloud environments, which are greatly affected by system size and complexity [15]. Moreover, researchers that analyze workloads deployed within production Cloud environments from a consumer perspective are often unable to see important details of the system, such as server characteristics as well as other workloads residing within the environment. Secondly, Cloud computing systems contain a number of characteristics not found in other distributed paradigms; Clouds have highly heterogeneous environments due to the diversity of workloads driven by user behavior [16]. Such diversity has been already been quantified in terms of resource utilization and user behavior [17] as well as server resource waste [20]. However, such analysis of Cloud diversity has not been performed for failures; Such variability has been demonstrated to influence the manifestation of failures within systems [8,18,31]. Finally, applying theoretical failure characteristics to dependability mechanisms and workload simulation parameters may not reflect accurately the behavior of real-world Cloud systems. In addition to facilitating research, accurate real-world large-scale failure and repair characteristics allow Cloud providers to create concrete failure-scenarios to aid in system decision making. For example, such scenarios can help to decide what type of dependability mechanisms to use, and when/where to apply them in order to enhance system availability, reliability and energy-efficiency.
processes - on a single server which is assigned and executed within the Cloud environment, and when integrated with user behavior forms the Cloud workload. A server is defined as the hardware as well as the software managing the hardware
– for example, the Hypervisor, OS, etc. Furthermore, we also present the statistical properties of Termination Events that occur within the system, which include task eviction, migration and user-determined termination. Finally, we provide the distribution parameters of failure and repair times for tasks and servers so that they can be integrated into simulation tools.
Our analysis is performed on the Google Cloud trace log (described in Section 2), consisting of over 12,500 servers and spanning a time period of 29 days, containing over 25 million unique submitted tasks. The objective of this paper is to understand and quantify the statistical parameters of Cloud failure and repair characteristics in order to study system behavior as well as provide realistic simulation parameters of Cloud computing environments.
The paper is structured as follows: Section 2 describes the analyzed dataset and event logs; Section 3 discusses the methodology and failure assumptions; Section 4 details the statistical properties of Termination Events; Section 5 presents the analysis of failures and repairs for servers and tasks; Section 6 discusses the application of this work; Finally, Section 7 contains the conclusions and future work.
II. CLOUD DATASET
A. Dataset Description and Analysis Challenges
The Google tracelog features 12,532 servers spanning 29 days of operation starting from 1st May, 2011 which is publically available at [19]. The trace log consists of a number of system logs including resource utilization of tasks, task constraints, as well as event logs for tasks and servers. Details about the statistical properties of the data such as task submission, task resource utilization and server characteristics can be found in [17][20-21].
We encountered a number of challenges extrapolating the data to facilitate the analysis presented within this paper. First, the total size of the trace log is approximately 400GB distributed across hundreds of Comma Separated Files, causing challenges when performing complex queries necessary to facilitate the analysis. Second, the data is unprocessed in nature, requiring extensive understanding of the nature of the data as well as the relationships that exist to develop an efficient analysis infrastructure and database system.
To tackle these two problems, it was necessary to develop a 50 node Hadoop MapReduce [33] cluster running Hive [34], a data warehouse system to facilitate storage and query execution. This allowed us to extrapolate data of interest from the trace log orders of magnitude faster than a centralized system approach.
B. Event Logs
Within the trace, there are over 144 million and 37 thousand events for tasks and servers respectively. These event logs are divided into two types: "server events" and "task events". In this paper, an event is defined as an action that changes the state of a server or task at a certain time and place.
The data recorded for a server event includes the Server Identifier (Server ID), server attributes (Platform ID, CPU and Memory capacity; unique combinations of these attributes create a server architecture ID), event type and the time of event occurrence. There are three possible server events that can occur: A server is made available to the system environment (ADD), a server is removed from the cluster due to maintenance or failure (REMOVE) or the available resources of a server are modified (UPDATED).
The task event log contains entries shared in the server event log such as the task identifier, time of event occurrence and event type as well as additional attributes such as the Server ID where the task was allocated, the task owner and the scheduling priority of the task. The scheduling decisions of the system are predominately based on task priorities which are identified within the task event log. The priority scale ranges from 0 to 11 to indicate lowest to highest priority respectively. As identified in [21], lower priority tasks are most likely used for development and testing while higher priority tasks are characterized as production tasks within the system.
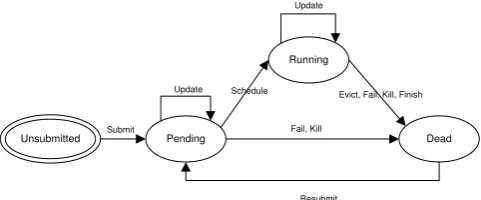
During the task life cycle, a task can transition through three different states: Pending, Running, and Dead that are driven by a number of events including task submission, scheduling, successful task completion, failure, eviction and killing amongst others described in [22] and depicted in Figure 1. A task is assigned Pending status when it is waiting to be allocated to a server after being submitted by a user or resubmitted by the task scheduler. Once the scheduler allocates the task to a server and begins execution, the task state changes to Running. It is possible for a task to be rescheduled to a different server after being resubmitted by the scheduler.
As depicted in Figure 1, there are three events that can change the state of a task to Dead without successful completion; we define these events as Termination Events (TEs). First, it is possible for a task to be cancelled due to a user, loss of dependencies with other tasks, migration or unknown cause of termination (KILL). Second, it is possible for a task to be evicted from a server (EVICT) due to overcommitment of the scheduler, the server the task is executing on becomes unstable or the server disk fails. Lastly, it is possible for a task to terminate due to a task software crash (FAIL). If any of the three events occur, the task is automatically re-submitted and returns to Pending status. Further information about all event attributes can be found in [22].
III. METHODOLOGY AND FAILURE ASSUMPTIONS
The main objective of this paper is to study and quantify the failure and repair characteristics of tasks and servers within the Google Cloud trace log in order to study system
Unsubmitted Pending
Running
Dead
Resubmit Submit
Update
Update
Fail, Kill
[image:3.595.308.549.53.153.2]Schedule Evict, Fail, Kill, Finish
behavior as well as provide accurate simulation parameters. This section describes the methodology to extrapolate failures from the dataset and the assumptions made when defining the failure modes.
A. Event Log Sampling
Event logs are sampled and divided into two different failure catalogs; task and servers. For the analysis it is necessary to calculate the elapsed time between failures and time to repair. For failure time, we calculate the elapsed time as the time between scheduling and a TE, and the elapsed time between ADD and REMOVE events for tasks and servers respectively. Repair time is calculated as the elapsed time between a TE and rescheduling (we observe within the trace log that all tasks are resubmitted by the scheduler after a TE occurs) and the elapsed time between REMOVE and ADD events for tasks and servers respectively. These elapsed times are calculated using timestamps recorded when an event occurs. Failure and repair times of tasks caused by FAIL events are filtered separately from TEs, and are the main focus of this empirical analysis.
This study does not consider task failures or repairs that occur outside the trace log observational period, as it is not possible to characterize an accurate time between failure and repair without knowledge of both schedule and termination times for tasks and servers. Inclusion of any data that does not contain both timestamps would likely skew results. This condition mainly excludes task monitoring services running within the Cloud grouped in priorities 10 and 11, which have started before the trace log observational period. With this assumption, the task failure catalog consists of 13,572,457 events, representing just over 98% of the FAIL events recorded in the trace log.
B. Failure Definition
It is necessary to define the nature of failures that occur within the trace log based on meaningful observations from the data as well as the supporting literature. Using this approach, we identify two types of failures that occur within the trace log as shown in Table 1. Server failures are characterized as a software or hardware crash failure. In this context, we define crash as a fail-stop failure, i.e. processes or hardware fail by halting without doing anything. Based on observations from the data, when a server REMOVE event occurs, all tasks currently executing on the server subsequently terminate. As stated in [22] the reason for a REMOVE event is either due to server failure or maintenance. Due to this ambiguity, it is not possible to
distinguish server failure from server maintenance as discussed in [21]. As a result, instead of arbitrarily choosing which servers fail or require maintenance, we classify all REMOVE events as a server failure (agnostic of maintenance), as this event results in tasks currently executing within the server to deviate from correct service.
Task failures are characterized as software crash failures. Task failures are identified by tasks that exhibit the FAIL event filtered from the task event log. In [22], FAIL events are explicitly defined as a software crash of the task.
It is well understood that the root cause of task and server failures might vary; from physical, design (typically software), human-machine interaction, malicious attacks, or a combination of any of the above [23]. In reality, transient hardware faults, hardware design faults and software bugs often cause similar system behavior [24]. In addition, it is possible each failure event recorded may not necessarily correspond to a unique failure, and failure events that are temporally close together may be a result of the same failure. Within this work, instead of arbitrarily and subjectively selecting different failure root causes for servers we decided not to distinguish root causes for servers due to ambiguity that exists within the trace log. However, it is possible to filter task failures that are caused by hardware or software crashes either by tasks failing when the server fails or when a FAIL event occurs respectively. In addition, we also assume that all failures that occur within the trace are caused by unique failures. Such assumptions are well supported by previous failure analysis [15,25,26] that also found that it is incredibly difficult to identify the root cause and the duration of a failure.
IV. TERMINATION EVENT ANALYSIS
We present a concise analysis of the TEs to provide insight into the events that cause task termination within the system and more importantly demonstrate the significance of failures within the Cloud environment. Out of the 25,927,826 TEs identified, 52% events corresponded to task failures while 22% and 26% correspond to EVICT and KILL events respectively as shown in Figure 2(a), signifying that the majority of TEs are caused by task failures. Furthermore we identify that 3.26% of the total unique tasks within the system experience one or more FAIL events within their life time. From Figure 2(b) it is observable that a large proportion of FAIL events occur within Day 2 and Days 10-16. This behavior is postulated in [21] as a result of 'crash-loops'; where tasks deterministically fail shortly after
TABLE1. FAILURE DEFINITIONS OF SERVERS AND TASKS.
Failure
Observation Server Crash Failure Task Crash Failure
Actors Server and Task Task
Description Server experiences a software or hardware crash failure. Task experiences a software crash failure.
Precondition 1. Server is operational.
2. Tasks eligible for submission or currently executing on the server. 1. Task is currently executing on a server
Post Condition 1. Server REMOVE event occurs.
2. Tasks currently scheduled on the server result in EVICT or KILL event.
1. Task event FAIL occurs. 2. Server continues operating.
Dataset Observation
1. After a server experiences a REMOVE event, all tasks that were scheduled onto the server subsequently experience KILL or EVICT event microseconds apart from each other.
2. No further tasks are scheduled onto the server until it recovers and rejoins the system where possible.
1. A large portion of tasks within the trace log experience a FAIL event.
execution, yet are repeatedly rescheduled back into the system (There are extreme cases where a single task is resubmitted over 40,000 times). This crash-loop behavior occurs to such an extent that it results on average 14 times the amount of task resubmissions compared to other days. This type of behavior is a concern in large-scale system environments, as it causes significant increase to the scheduler workload, as well as work performed by tasks to be wasted.
V. FAILURE AND REPAIR ANALYSIS
The following section presents the analysis of the failure and repair characteristics for both servers and tasks. We present the statistical properties for failure and repair times, including the Mean ( ), Standard Deviation ( ) and Squared Coefficient of Variance (C2). Furthermore, we match the closest theoretical distributions applying Anderson-Darling Goodness of Fit (GoF) tests to obtain the statistical parameters of Mean Time Between Failure and Mean Time to Repair (MTBF and MTTR respectively). Due to the large amount of records present after extrapolating the data using the analysis infrastructure, we have used Minitab [27] to efficiently perform a large portion of the analysis.
In addition, we have evaluated the data against a number of distributions including Weibull, Gamma, Loglogistic, Exponential and Lognormal. Lastly, we have presented a visual fit comparison in the form of Empirical Cumulative Distribution Functions (CDFs). We present the visual distribution fit of the overall system where applicable as well as priority 9 tasks, as these represent production tasks within the Cloud environment, that we believe are of high relevance and importance to the Cloud research community.
A. Servers
Within the trace log observational period, 8.954 server failures occurred in within 5,056 servers as depicted in Figure 3 and Figure 5 with an average of 308 servers failing daily with a standard deviation of 101 as depicted in Figure 4. We can observe from Figure 5 that a small proportion of servers exhibit high failure occurrence, and that most servers experience less failure events with similar proportions.
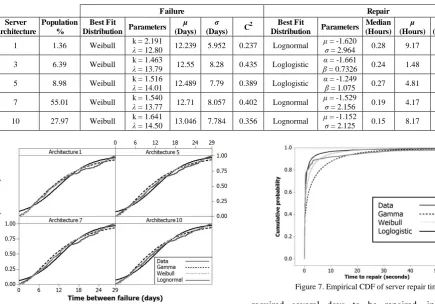
Table 2 presents the statistical properties as well as the data distributions of server failures for each server architecture population greater than 1%, as these represent 99.56% of the total servers within the observational period. We observe that all server failures visually and statistically best fit a Weibull distribution as shown in Figure 6, which conforms to server failure modeling in previous findings [10], with a C2 value for all server architectures between 0.237-0.435 signifying low variance of server MTBF.
Moreover, 59,583 tasks within the trace log fail due to server hardware failures, which are identified as termination
[image:5.595.58.548.56.209.2]Figure 3. Unique server failures within the observational period.
[image:5.595.311.538.459.754.2]Figure 5. Distribution of servers failures.
Figure 4. Number of server failure events daily. Figure 2. Number of Termination Events a) Total, b) Per day.
[image:5.595.51.285.601.757.2]events with 21% and 79% of the events corresponding to KILL and EVICT events, respectively. Such failures represent 0.44% of total task failures within the trace log.
Table 2 also presents the statistical properties and distribution parameters for server repairs times. We observe that the median repair time for all server architectures is 6 to 30 times smaller than that of the mean, and that all median values are similar in value. Server repair time was best fit by Lognormal and Loglogisitc distribution classified by server architecture type, and Lognormal across the entire system as shown in Figure 7. These statistical properties as well as the empirical CDF demonstrate that the vast majority of repair times are relatively short; just under 30 minutes. There are two reasons for this behavior. The first is described in [21] as a portion of REMOVE events are due to maintenance; the second reason we postulate is that a large proportion of server failures can be repaired by restarting the server. On the other hand, we also found a proportion of servers that
required several days to be repaired, indicating more complicated failures that cannot be corrected by just restarting the server. This is indicated by high variability within the repair times of servers, reflected by the C2 between 2.28 - 36.89 as well as the distribution shape in Figure 7. B. Tasks
Table 3 presents the statistical properties of task failures due to software crashes, as well as the best fit distributions classified by task priority. We discovered that attempting to fit a theoretical distribution to tasks agnostic of priority was not feasible, as it resulted in a C2 value of 46 (representing significant variability within the data), nor did it visually fit or pass a GoF test satisfactorily. The reason for this is due to the characteristics of task failures as shown in Table 3; as it can be observed, tasks of different priority levels vary significantly in terms of the mean and standard deviation for MTBF. It can be observed that C2 is significantly lower when classifying task failures by priority. By separating tasks by priority type, we were able to sufficiently fit task MTBF to a
[image:6.595.55.491.64.368.2]Figure 6. Empirical CDF of time between failures for server architectures.
Figure 7. Empirical CDF of server repair times.
TABLE3.STATISTICAL PROPERTIES AND MODEL PARAMETERS OF TASK MTBF AND MTTR
Failure Repair
Priority Population %
Best Fit
Distribution Parameters (Hours) (Hours) C
2 Best Fit
Distribution Parameters
Median
(Hours) (Seconds) (Seconds) C
2
0 35.07 Weibull k = 0.5107
= 0.3342 1.063 4.925 4.63
3-Param Loglogistic
= 0.9497, = 1.115
T = 0.9822 2.90 122.90 1472.2 143.5
1 13.73 Lognormal = -1.638
= 1.665 1.694 8.083 4.77
3-Param Lognormal
= 1.206, = 1.758
T = 1.049 4.00 161 7157 1976
2 1.06 Lognormal = -0.3489
= 2.152 3.825 11.836 3.09 Lognormal
= 1.216
= 1.227 2.00 28.70 182.10 40.26
4 42.77 Lognormal = -1.921
= 1.763 1.019 4.967 4.87
3-Param Loglogistic
= 0.0067, = 0.6553
T = 0.9737 1.91 16.32 173.36 112.8
6 4.78 Loglogistic = -3.073
= 0.3129 0.062 0.093 1.50
3-Param Loglogistic
=-0.529, = 0.5227
T = 1.089 1.67 2.67 4.06 2.31
8 0.43 Loglogistic = -0.2421 = 2.154 48.53 64.190 1.32 3-Param
Lognormal
= 0.2871, = 2.083
T = 1.317 2.44 8.37 14.52 3.00
9 2.16 Gamma k = 0.2215
= 265.1 58.72 95.030 1.62
3-Param Lognormal
= 0.4904, = 1.274
T = 1.031 2.43 4.75 5.77 1.48
TABLE2.STATISTICAL PROPERTIES AND MODEL PARAMETERS OF SERVER MTBF AND MTTR
Failure Repair
Server Architecture
Population %
Best Fit
Distribution Parameters (Days)
(Days) C
2 Best Fit
Distribution Parameters Median
(Hours) (Hours) (Hours) C
2
1 1.36 Weibull k = 2.191
= 12.80 12.239 5.952 0.237 Lognormal
= -1.620
= 2.964 0.28 9.17 28.8 9.86
3 6.39 Weibull k = 1.463
= 13.79 12.55 8.28 0.435 Loglogistic
= -1.661
= 0.7326 0.24 1.48 8.99 36.89
5 8.98 Weibull k = 1.516 = 14.01 12.489 7.79 0.389 Loglogistic = -1.249 = 1.075 0.27 4.81 13.32 7.67
7 55.01 Weibull k = 1.540
= 13.77 12.71 8.057 0.402 Lognormal
= -1.529
= 2.156 0.19 4.17 17.22 17.05
10 27.97 Weibull k = 1.641
= 14.50 13.046 7.784 0.356 Lognormal
= -1.152
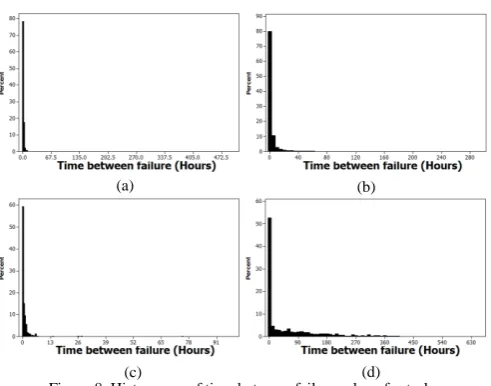
[image:6.595.272.548.64.357.2] [image:6.595.46.553.604.771.2]number of distributions; we found that different task priorities best fit different distributions and that non-production priority tasks best fit Lognormal, Loglogistic and Weibull distributions that are heavily skewed as shown in Figure 8. Such behavior is supportive of the notion that a large number of failures occur within the start up phase of tasks due to the crash-loops discussed in Section 4.
As stated previously, priority 9 tasks represent production tasks within the system environment. We observe that the C2 value of MTBF is 1.62; considerably lower than other task types, and that the MTBF mean and standard deviation is significantly larger. We observe that the MTBF of production tasks best fits a Gamma distribution (shape parameter k = 0.2) compared to other distributions types as shown in Figure 9. There appear to be two types of failure characteristics for tasks; tasks that experience failures near the start of execution, and tasks that experience failures far into their life spans. Figure 9 shows that just over 70% of tasks fail within the first hour of execution resulting in a skew within the data. The reason for this is a result of user behavior; there exists a single user that is responsible for just under 65% of total production tasks failures, all occurring within Day 3 and failing just under a minute into execution. As a result, this causes the distribution in Figure 9 to become skewed. This behavior is worth noting, as Cloud computing environments are driven by user behavior with varying QoS demands. As a result, such environments are also influenced by the failure characteristics of these users. This is a potential concern in large-scale systems due to evidence of correlation between workload intensity [18], system size and complexity that may result in other users being affected.
Table 3 also presents the statistical properties of repair times for tasks classified by priority. We encountered similar challenges as described previously with fitting the empirical data to a suitable theoretical distribution both visually and using GoF tests. This is due to the extreme variability of task recovery times within the trace log; especially lower priority tasks which exhibit C2 values between 112 - 1976. We found the mean and variance of repair times for task priorities 6-9 to be considerably more stable, indicated by the median and the mean being closer together, as well as between the mean and standard deviation. In addition, these tasks contain a repair time under 10 seconds, indicating that restarting these tasks appears to correct a large proportion of faults.
The reason for this behavior in lower priority tasks is due to the scheduler and nature of tasks; lower priority tasks are more likely to be delayed for higher priority tasks to be scheduled or resubmitted back into the system. We also assume from observing the failure and repair characteristics as well as discussion in [21,22] that there is a correlation between task priority level and task criticality. (E.g. Lower priority tasks are less developmentally mature, and consequently result in more frequent failures and longer repair times). In addition, the crash-loops within the trace log skew the results significantly, resulting in a low median, yet a high mean and standard deviation.
Figure 10(a) and Figure 10(b) show the empirical CDF of task repair times for all tasks and production tasks within the trace log respectively, as well as three distributions for visual fit comparison. We observe that the Lognormal distribution is the best fit distribution; such a characteristic has been observed in other distributed systems [10]. However, this is misleading in the case of Figure 10(a), as the Anderson-Darling value calculated is unacceptably high, signifying that the empirical data deviates significantly from the theoretical distribution. The AD value calculated for Figure 10(b) however is hundreds of times lower than that of Figure 10(a),
[image:7.595.45.291.47.240.2]Figure 9. Empirical CDF of time between failure for production tasks
Figure 8. Histograms of time between failures skew for task (a) Priority 0, (b) Priority 2, (c) Priority 9, (d) Priority 10.
(a) (b)
(c) (d)
[image:7.595.328.531.48.190.2]
Figure 10. Empirical CDF of repair times for a) All tasks, b) Production tasks.
[image:7.595.80.519.624.757.2]allowing the empirical CDF for Figure 10(b) to fit a 3-Parameter Lognormal distribution (threshold parameter T) that both visually fits and satisfies GoF tests. Gamma and Weibull distributions are poorer fits for system wide and task specific repair times.
VI. APPLICATION OF WORK
Although the analysis presented in this work is specific to the studied environment, the observations and results presented are applicable in similar Cloud systems and can be practically applied to enhance a number of research areas:
Provides Cloud workload failure and repair model parameters derived from empirical data to develop simulation models: The results derived within this paper can be used to not only generate the proportion of failures, but also provides distribution parameters of the MTBF and MTTR for Cloud workload and servers derived from empirical data of a large-scale real-world system. Research into failure-aware scheduling [28] and other fault-tolerant mechanisms can all be enhanced by choosing experiment parameters derived from the results within this paper when evaluating the effectiveness of dependability mechanisms. Most importantly, these results can greatly assist work that simulate Cloud workload behavior by either introducing failure parameters or enhancing workloads that presently depend on theoretical variables for failure characteristics.
Aids providers from similar environments in decision making when applying appropriate dependability mechanisms and when to apply them in order to maximize their effectiveness: Providers can deploy a number of dependability mechanisms within their systems as described previously; the results within this paper can assist providers in understanding the characteristics of failures within their own environments, enabling them to make informed decisions on what type of mechanisms should be applied and when and where they should be deployed.
We give two concrete examples of how the results in this paper can assist providers in developing practical applications of this work. Providers continuously attempt to improve datacenter energy-efficiency; as stated in [2], a substantial amount of energy-waste is due to failures. First, it is ideal that dependability mechanisms deployed in datacenters do not significantly degrade the energy-efficiency of the system. Mechanisms such as checkpointing can be applied in order to mitigate the amount of task execution time wasted in terms of energy consumption. However, they can also result in significant overhead. As a result, it is necessary to calculate the total energy consumption of wasted task execution, checkpoint overhead, migration and rollback in order to create smart checkpoint decision making mechanisms in order to decide when and where to checkpoint, migrate or kill a task based on consumer QoS and system energy-efficiency.
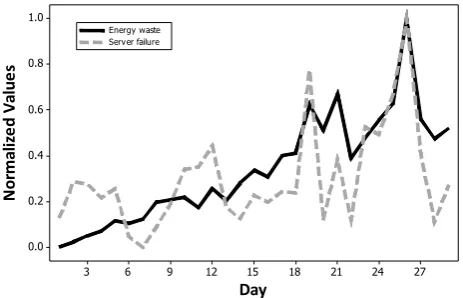
Second, it is possible to quantify the energy-waste due to server failures by calculating the total amount of task execution time wasted using the results within this paper. This is accomplished by mapping the server configurations to the SpecPower2008 Benchmark [35] in order to derive server energy consumption at different system loads and then calculating the amount of execution time wasted per task. This is crucial in order to identify operational inefficiencies within the system environment. Figure 11 presents initial results of this calculation, which shows the relationship
between energy-waste and server failures. We observe that energy-waste increases over subsequent days and that there exists a strong correlation between the number of server failures daily and the total energy consumption wasted, represented by a Pearson correlation coefficient of 0.769.
These two examples are complementary to one another, and with conjunction with the simulation parameters presented in this paper, allows providers to experiment with different system environment parameters and fault-tolerant mechanism behavior in order to improve system reliability and energy-efficiency based on empirical findings.
VII. CONCLUSIONS AND FUTURE WORK
This work quantifies and analyzes the characteristics of failures and repairs from the dataset of a large-scale production Cloud environment. It is our hope that the observations and analysis performed within this paper can be beneficial to the larger research community in terms of providing insights into the failures that occur within large-scale production Cloud environments, as well as enabling more realistic modeling of Cloud workload behavior. Our observations and conclusions from the study are as follows:
Failure rates of tasks vary significantly by priority type, and rely less on the underlying server architecture, reflecting the diversity of workload characteristics; such findings quantify the degree of diversity that exists within a Cloud environment.
3.26% of the total tasks within the trace log fail, with a large proportion failing early into their lifespan; the remaining tasks exhibit a large time between failures.
Production Cloud tasks follow a Gamma distribution (Gamma shape parameter of 0.2) and 3-Parameter Lognormal (Lognormal location parameter 0.4) for failures and repair times respectively.
Failure rates of non-production tasks follow different theoretical distributions such as Lognormal, Loglogistic and Weibull. Such findings are in agreement with previous analysis of distributed systems [7,10][29-30].
Repair times of both tasks and servers vary widely across the system, ranging from 15 seconds to 4 days, and 25 minutes to 8 days for tasks and servers respectively.
Attempting to fit distributions visually as well as applying GoF tests is challenging due to the large variance of failure and repair times highlighted above. It is our suggestion that for deriving accurate failure parameters of
27 24 21 18 15 12 9 6 3 1.0
0.8
0.6
0.4
0.2
0.0
Day
N
o
rm
a
li
ze
d
V
a
lu
e
s
Energy waste Serv er failure
[image:8.595.309.541.51.200.2]
tasks and servers, using priority levels and architecture types is more effective for tasks and servers respectively.
Future work includes studying the failure correlation between workload intensity and size of system. We also plan to investigate in further detail how specific user behavior effects the dependability of the Cloud environment, and if it is possible to perform distribution analysis when clustering users with similar failure behavior by characterizing workload following the methodology in [17]. Finally, we plan to use the results generated in this paper to enhance a number of dependability mechanisms such as check-pointing as well as failure-aware scheduling that considers additional dimensions such as performance and energy-efficiency.
ACKNOWLEDGEMENT
This work is supported by the National Basic Research Program of China (973) (No. 2011CB302602), the UK EPSRC WRG platform project (No. EP/F057644/1), the Major Program of the National Natural Science Foundation of China (No. 90818028), the STRAPP project (Trusted Digital Spaces through Timely Reliable and Personalized Provenance) funded by the UK Technology Strategy Board (grant reference 1926-19253), RollsRoyce plc, Osys Ltd, Cybula Ltd, and the UK Engineering and Physical Sciences Research Council Knowledge Secondment Scheme.
REFERENCES
[1] P. Mell and T. Grance. NIST definition of Cloud computing. National
Institute of Standards and Technology. October 7, 2009.
[2] A. Gainaru, F. Cappello, M. Snir, and W. Kramer, "Fault prediction under the microscope: a closer look into HPC systems," in Proceedings of the International Conference on High Performance Computing, Networking, Storage and Analysis Salt Lake City, Utah: IEEE Computer Society Press,
[3] A. Avizienis, J.-C Laprie, B. Randell, C. Landwehr "Basic concepts and taxonomy of dependable and secure computing," Dependable and Secure Computing, IEEE Transactions on , vol.1, no.1, pp.11,33, Jan.-March 2004
[4] Z.Zheng, T. Zhou, M.Lyu, I.King ‘FTCloud: A Component Ranking Framework for Fault-Tolerant Cloud Applications’ 2010. IEEE 21st International Symposium on Software Reliability Engineering, Nov. 2010, pp 398-407.
[5] L. Fiondella, S.S. Gokhale, V.B. Mendiratta "Cloud Incident Data: An
Empirical Analysis," Cloud Engineering (IC2E), 2013 IEEE International Conference on , vol., no., pp.241,249, 25-27 March 2013
[6] K. V. Vishwanath and N. Nagappan. "Characterizing cloud computing
hardware reliability". In Proc. of ACM Symp. on Cloud Computing (SOCC), 2010.
[7] S. Kavulya, J. Tan, R. Gandhi, P. Narasimhan, "An Analysis of Traces
from a Production MapReduce Cluster," Cluster, Cloud and Grid Computing (CCGrid), 2010 10th IEEE/ACM International Conference on , vol., no., pp.94,103, 17-20 May 2010
[8] R. K. Sahoo, A. Sivasubramaniam, M. S. Squillante, and Y. Zhang,
"Failure Data Analysis of a Large-Scale Heterogeneous Server Environment," in Proceedings of the 2004 International Conference on Dependable Systems and Networks: IEEE Computer Society, 2004. [9] L. Hui, D. Groep, L. Wolters, and J. Templon, "Job Failure Analysis
and Its Implications in a Large-Scale Production Grid," in e-Science and Grid Computing, 2006. e-Science '06. Second IEEE International Conference on, 2006, pp. 27-27.
[10]B. Schroeder and G. A. Gibson, "A Large-Scale Study of Failures in High-Performance Computing Systems," Dependable and Secure Computing, IEEE Transactions on, vol. 7, pp. 337-351, 2010.
[11]T. Ropars, A. Guermouche, B. U, E. Meneses, L. V. Kal, and F.
Cappello, "On the use of cluster-based partial message logging to improve fault tolerance for MPI HPC applications," in Proceedings of the 17th international conference on Parallel processing - Volume Part I Bordeaux, France: Springer-Verlag, 2011, pp. 567-578.
[12]A.M. Sampaio, J.G. Barbosa "Dynamic Power- and Failure-Aware
Cloud Resources Allocation for Sets of Independent Tasks," Cloud
Engineering (IC2E), 2013 IEEE International Conference on , vol., no., pp.1,10, 25-27 March 2013
[13]J. A. Quiane-Ruiz, C. Pinkel, J. Schad, and J. Dittrich, "RAFTing MapReduce: Fast recovery on the RAFT," in Data Engineering (ICDE), 2011 IEEE 27th International Conference on, 2011
[14]T. Nguyen and W. Shi, "Improving resource efficiency in data centers
using reputation-based resource selection," in Proceedings of the International Conference on Green Computing: IEEE Computer Society, 2010, pp. 389-396.
[15]Y. Liang, Y. Zhang, M. Jette, S. Anand, and R. Sahoo, "BlueGene/L Failure Analysis and Prediction Models," in Dependable Systems and Networks, 2006, pp. 425-434.
[16]R. Buyya, et al., "InterCloud: utility-oriented federation of cloud computing environments for scaling of application services," presented at the Proceedings of the 10th international conference on Algorithms and Architectures for Parallel Processing - Volume Part I, Busan, Korea, 2010.
[17]I.S. Moreno, P. Garraghan, P. Townend, J. Xu, "An Approach for Characterizing Workloads in Google Cloud to Derive Realistic Resource Utilization Models," Service Oriented System Engineering (SOSE), 2013 IEEE 7th International Symposium on , vol., no., pp.49,60, 25-28 March 2013), USA,
[18]X. Castillo and D. Siewiorek. "Workload, performance, andreliability of digital computing systems". In FTCS-11 , 1981
[19]Google, "Google Cluster Data V2." Available:
http://code.google.com/p/googleclusterdata/wiki/ClusterData2011_1
[20]P. Garraghan, P. Townend, J. Xu "An Analysis of the Server
Characteristics and Resource Utilization in Google Cloud," Cloud Engineering (IC2E), 2013 IEEE International Conference, pp.124,131, 25-27 March 2013
[21]C. Reiss, A. Tumanov, G. R. Ganger, R. H. Katz, and M. A. Kozuch.
"Heterogeneity and dynamicity of clouds at scale: Google trace analysis." In Proc. of the 3nd ACM Symposium on Cloud Computing, SOCC '12, 2012.
[22]C. Reiss, J. Wilkes, and J. Helleirstein, "Google Cluster-Usage Traces: Format + Schema," Google Inc., White Paper, 2011.
[23]J.N. Gray, “A census of Tandem system availability between 1985 and 1990,” IEEE Trans. Reliability, vol. 39, no. 4, pp.409-418, 1990.
[24]D. Powell (Ed.). “Delta-4: a generic architecture for dependable
distributed computing”, Springer (Berlin), 1991.
[25]D. Tang, R. K. Iyer, and S. S. Subramani, "Failure analysis and modeling of a VAXcluster system," in Fault-Tolerant Computing, 1990. FTCS-20. Digest of Papers., 20th International Symposium, 1990, pp. 244-
[26]M. Kalyanakrishnam, Z. Kalbarczyk, and R. Iyer, "Failure data
analysis of a LAN of Windows NT based computers," in Reliable Distributed Systems, 1999, pp. 178-187.
[27]Minitab, "Distribution Analysis," in Minitab Users' Guide, ed, 2011. [28]S. Fu, C.Z. Xu "Quantifying event correlations for proactive failure
management in networked computing systems", Journal of Parallel and Distributed Computing, Volume 70, Issue 11, November 2010, Pages 1100-1109
[29]J. Xu, Z. Kalbarczyk, and R. K. Iyer. "Networked Windows NT
system field failure data analysis." In Proc. of the 199 Pacific Rim Int. Symp. on Dependable Computing 1999
[30]T. Heath, R. P. Martin, and T. D. Nguyen. "Improving cluster
availability using workstation validation." In Proc. ACM
SIGMETRICS Conf. Measurement and Modeling of Computer Systems, pp. 217–227, 2002
[31]M. Lyu and V. Mendiratta. "Software Fault Tolerance in a Clustered Architecture: Techniques and Reliability Modeling". In Proceedings
1999 IEEE Aerospace Conference, pages 141 –150, 1999
[32]Adam J. Oliner , Larry Rudolph , Ramendra K. Sahoo, “Cooperative checkpointing: a robust approach to large-scale systems reliability”, Proceedings of the 20th annual international conference on Supercomputing, June 28-July 01, 2006, Cairns, Queensland, Australia
[33]J. Dean and S. Ghemawat, "MapReduce: simplified data processing on
large clusters," in Proceedings of the 6th conference on Symposium on Opearting Systems Design \& Implementation - Volume 6 San Francisco, CA: USENIX Association, 2004, pp. 10-10.
[34]A. Thusoo, J. S. Sarma, N. Jain, Z. Shao, P. Chakka, S. Anthony, H. Liu, P. Wyckoff, and R. Murthy, "Hive: a warehousing solution over a map-reduce framework," Proc. VLDB Endow., vol. 2, pp. 1626-1629,
[35]2009 Standard Performance Evaluation Corporation,
"SPECpower_ssj2008 Results" vol. 2012, 2012. Available: