RESEARCH
Development and validation of a new
tumor-based gene signature predicting
prognosis of HBV/HCV-included resected
hepatocellular carcinoma patients
Gui‑Qi Zhu
1,2†, Yi Yang
1,2†, Er‑Bao Chen
3†, Biao Wang
1,2, Kun Xiao
1,2, Shi‑Ming Shi
4, Zheng‑Jun Zhou
1,2,
Shao‑Lai Zhou
1,2, Zheng Wang
1,2, Ying‑Hong Shi
1,2, Jia Fan
1,2, Jian Zhou
1,2, Tian‑Shu Liu
3and Zhi Dai
1,2*Abstract
Background: Due to the phenotypic and molecular diversity of hepatocellular carcinomas (HCC), it is still a challenge to determine patients’ prognosis. We aim to identify new prognostic markers for resected HCC patients.
Methods: 274 patients were retrospectively identified and samples collected from Zhongshan hospital, Fudan Uni‑ versity. We analyzed the gene expression patterns of tumors and compared expression patterns with patient survival times. We identified a “9‑gene signature” associated with survival by using the coefficient and regression formula of multivariate Cox model. This molecular signature was then validated in three patients cohorts from internal cohort (n = 69), TCGA (n = 369) and GEO dataset (n = 80).
Results: We identified 9‑gene signature consisting of ZC2HC1A, MARCKSL1, PTGS1, CDKN2B, CLEC10A, PRDX3, PRKCH, MPEG1 and LMO2. The 9‑gene signature was used, combined with clinical parameters, to fit a multivariable Cox model to the training cohort (concordance index, ci = 0.85), which was successfully validated (ci = 0.86 for internal cohort; ci = 0.78 for in silico cohort). The signature showed improved performance compared with clinical parameters alone (ci = 0.70). Furthermore, the signature predicted patient prognosis than previous gene signatures more accurately. It was also used to stratify early‑stage, HBV or HCV‑infected patients into low and high‑risk groups, leading to significant differences in survival in training and validation (P < 0.001).
Conclusions: The 9‑gene signature, in which four were upregulated (ZC2HC1A, MARCKSL1, PTGS1, CDKN2B) and five (CLEC10A, PRDX3, PRKCH, MPEG1, LMO2) were downregulated in HCC with poor prognosis, stratified HCC patients into low and high risk group significantly in different clinical settings, including receiving adjuvant transarterial chem‑ oembolization and especially in early stage disease. This new signature should be validated in prospective studies to stratify patients in clinical decisions.
Keywords: Hepatocellular carcinoma, Liver resection, Molecular classification, Microarray analysis
© The Author(s) 2019. This article is distributed under the terms of the Creative Commons Attribution 4.0 International License (http://creat iveco mmons .org/licen ses/by/4.0/), which permits unrestricted use, distribution, and reproduction in any medium, provided you give appropriate credit to the original author(s) and the source, provide a link to the Creative Commons license, and indicate if changes were made. The Creative Commons Public Domain Dedication waiver (http://creat iveco mmons .org/ publi cdoma in/zero/1.0/) applies to the data made available in this article, unless otherwise stated.
Open Access
*Correspondence: dai.zhi@zs‑hospital.sh.cn
†Gui‑Qi Zhu, Yi Yang and Er‑Bao Chen contributed to this work equally. 1 Liver Cancer Institute, Zhongshan Hospital, Fudan University, Shanghai 200032, China
Background
Hepatocellular carcinoma (HCC) is the sixth most common carcinoma worldwide and the third leading cause of patient’s cancer-related mortality [1, 2]. Surgi-cal resection is one of the most effective curative treat-ments for HCC [3]. However, approximately 60–70% patients will still suffer from recurrence in 5 years for most patients undergoing liver resection and the clini-cal outcomes is still dissatisfactory [3]. It is necessary to investigate patients at high risk for poor clinical out-comes and employed effective therapies to avoid HCC recurrence. Hence, determination of novel prognostic biomarkers is vital for early diagnostic detection.
In clinical settings, prognosis assessment and deci-sion making after surgery are based on the tumor stag-ing systems (i.e., TNM [4], Japan Integrated Staging [5] and Barcelona Clinic liver cancer [BCLC] [6], cancer of the liver Italian program [7]). They are widely applied to guide treatment therapies or predict HCC clinical out-comes. Some studies have raised to improve the above staging system by introducing tumor characteristics, such as serum alpha fetoprotein (AFP) and pathologic features such as microvascular invasion and tumor dif-ferentiation [8, 9].
In order to optimize prognosis scoring, search-ing for molecular biomarkers is an expandsearch-ing domain [10–12]. However, the heterogeneity of the underlying liver disease and tumor stage in HCC has challenged the use of molecular classification in different clinical settings worldwide. Currently, array-based gene expres-sion signatures obtained from HCC tumors have been assessed in many recent studies [12–20]. These studies have clarified gene signatures predicting HCC patient recurrence or mortality; howbeit, traditional screen-ing methods focus on few genes and lack in systematic evaluation; furthermore, the sensitivity and specificity of a single prognostic biomarker may be scarce. Hence, the problems that lack of gene signatures applied in dif-ferent clinical settings still exist.
Fortunately, it is great convenient that high-through-put technologies provide real-time monitoring of dif-ferent biological molecules and make it much easier to explore a great number of potential markers at once, resulting in an explosion of new biomarkers for HCC diagnostic and prognostic prediction. Recently, more than 20 various molecular signatures have been pub-lished; however, few have been externally validated [8,
14–23]. One of these externally or internally validated molecular signature is the five-gene score [16], which has been shown to be related with disease-specific sur-vival in resected HCCs. Interestingly, the five-gene sig-nature showed better performance than other different
signatures [12, 13, 18, 22], but lacked validation in com-parison to other types of curative treatments [16].
However, a more accurate and comprehensively vali-dated method for various patient cohorts with different treatment options is still to be identified and applied in HCC clinical guidelines. In this study, we intent to iden-tify a molecular signature to optimally predict clinical outcomes of HCC patients who underwent liver resec-tion. We solved some important points to intensify the robustness of our molecular signatures: (1) identifica-tion in a training HCC cohort and internal validaidentifica-tion; (2) assessing the added value of molecular signature com-pared with classical clinical parameters; and (3) exter-nally validated by another cohort patients. Ultimately, we built a new nomogram combining clinical factors and gene signature to refine prognosis model assessment and overpass the dichotomy between molecular and clinical parameters.
Materials and methods
Patients and tissue samples
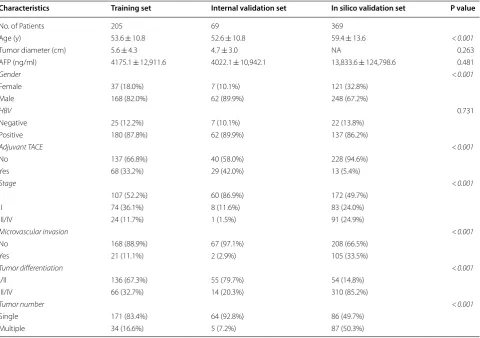
274 archived FFPE samples were collected from Zhong-shan Hospital between January 2010 and January 2011 (Fig. 1). Those samples were assigned to two phases in training, internal validation cohort in chronological order. Table 1 described the clinical parameters, which were retrospectively collected from our hospital’s medi-cal records. Tumor stage was assigned for HCC patients whose tumors were staged before the publication of the seventh edition of the AJCC Cancer Staging Manual. The exclusion items (another 113 patients) were as fol-lows: tumors has more than 80% of necrosis (34 patients), tumors’ RNA has poor quality or insufficient amount (30 patients), patients was performed with non-curative resection (R1 or R2 resection or extrahepatic metastasis at the time of the surgery) (25 patients), HCC patients were treated by liver transplantation (11 patients), and HCC patients were dying within the first month after liver resection due to surgical complications or decom-pensated cirrhosis (13 patients). The HCC diagnosis was based on established histological criteria [3]. In the terms of multiple tumors, we have taken the largest nodule of HCC into account.
Gene expression profiling and data processing
Fig. 1 Flow chart of the study
Table 1 Patient characteristics for the discover and validation cohort
Mean + SD/N (%)
TACE transarterial chemoembolization, AFP alpha-fetoprotein Italic P values indicate P < 0.05
Characteristics Training set Internal validation set In silico validation set P value
No. of Patients 205 69 369
Age (y) 53.6 ± 10.8 52.6 ± 10.8 59.4 ± 13.6 < 0.001
Tumor diameter (cm) 5.6 ± 4.3 4.7 ± 3.0 NA 0.263
AFP (ng/ml) 4175.1 ± 12,911.6 4022.1 ± 10,942.1 13,833.6 ± 124,798.6 0.481
Gender < 0.001
Female 37 (18.0%) 7 (10.1%) 121 (32.8%)
Male 168 (82.0%) 62 (89.9%) 248 (67.2%)
HBV 0.731
Negative 25 (12.2%) 7 (10.1%) 22 (13.8%)
Positive 180 (87.8%) 62 (89.9%) 137 (86.2%)
Adjuvant TACE <0.001
No 137 (66.8%) 40 (58.0%) 228 (94.6%)
Yes 68 (33.2%) 29 (42.0%) 13 (5.4%)
Stage <0.001
I 107 (52.2%) 60 (86.9%) 172 (49.7%)
II 74 (36.1%) 8 (11.6%) 83 (24.0%)
III/IV 24 (11.7%) 1 (1.5%) 91 (24.9%)
Microvascular invasion <0.001
No 168 (88.9%) 67 (97.1%) 208 (66.5%)
Yes 21 (11.1%) 2 (2.9%) 105 (33.5%)
Tumor differentiation <0.001
I/II 136 (67.3%) 55 (79.7%) 54 (14.8%)
III/IV 66 (32.7%) 14 (20.3%) 310 (85.2%)
Tumor number <0.001
Single 171 (83.4%) 64 (92.8%) 86 (49.7%)
[image:3.595.56.541.88.291.2] [image:3.595.58.539.355.693.2]manufacturer’s protocol. NanoDrop (Thermo Scientific, Waltham, MA, USA) was used to measure the concen-trations of extracted RNA samples. Samples with RNA concentrations no less than 40 ng/μL were subjected to further analysis. We used two NanoString gene panels in our study to quantify the expression of 1163 genes (Addi-tional file 1: Table S1), which were involved in multiple signaling pathways related to HCC oncogenesis, HCC progression and/or cancer immunology. We measured these 1163 genes rather than entire gene profile because the aim of study was to focus on analyzing those genes, which had been proved to be relevant to HCC. 200 ng RNA were hybridized overnight at 65 °C with probes according to the manufacturer’s protocol, followed by digital barcode counting using NanoString nCounter Digital Analyzer (NanoString Technologies, Seattle, WA, USA). The logarithm of raw counts was normalized by the expression of positive controls and then submitted to further statistical analysis.
Gene expression profiling of 274 HCC patients were detected. We processed the gene expression data using ‘glmnet’ package of R software (version 3.3.1, R Foun-dation for Statistical Computing Vienna, Austria). The following steps for this well-defined process: firstly, importing the ‘raw’ data in.CEL format and the associ-ated clinical survival information; secondly, summariz-ing the gene expression values for each probe set; the last step included background adjustment and z-score normalization.
Identification of the prognostic gene signature
Firstly, we constructed the gene signature from the gene expression matrix of 205 HCC patients. The ‘scipy’ pack-age (scipy.stats.pearsonr) of Python was used to deter-mine whether gene expression correlated with overall survival (OS). 527 genes with a P value ≤ 0.05 from 1163 genes obtained from 205 HCC patients gene expres-sion profiles were used for the subsequent regresexpres-sion model analysis. In general, we used Lasso (shrinkage and selection method for linear regression) to perform the regression analysis in the data matrix (274 * 470). Addi-tionally, we used the penalized regression model with LASSO penalty to achieve shrinkage and variable selec-tion simultaneously, and the optimal values of the pen-alty parameter alpha were determined through 10-times cross-validations. Based on the optimal alpha value, nine prognostic genes with corresponding coefficients were screened out of 527 genes based on gene expression pro-filing and OS data (Fig. 1). The Predicted OS information for each patient was then calculated based on the expres-sion level of each prognostic gene and its corresponding coefficient. Then, R-squared values were calculated to evaluate concordance between predicted OS and real OS
in two optimized algorithms, Lasso and LassoLars. Prog-nostic models including the following parameters were compared: the identified gene signature alone, clinical parameters alone, and the combination of clinical param-eters and the identified gene signature.
Experimental and in silico signature validation
We used three validation cohorts (one internal and two in silico datasets) of HCC in the prognostic study (Fig. 1): internal validation set (n = 69, HCC patients undergoing surgery from October 2010 to January 2010); and two independent cohorts in silico, TCGA set (n = 369, HCC patients undergoing surgery) and HCC GEO dataset (n = 80, GSE10143) [24].
End points
We designed the study following some recommendations for prognostic cancer biomarkers included in the Report-ing Recommendations for Tumor Marker Prognostic Studies statement (REMARK) [7, 25] and the European Association for the Study of the Liver/European Organi-zation for Research and Treatment of Cancer guide-lines (EASLORTC) [25, 26]. Three steps were endorsed by these guidelines for HCC prognostic biomarkers: (1) identifying biomarkers need to follow a mode of training and validation form; (2) independent prognostic value of biomarkers should retain when meeting with known clinical or pathological parameters; and (3) biomarkers need to be validated in any in silico datasets of independ-ent patiindepend-ents.
Statistical analysis
We estimated the survival curves by the Kaplan–Meier analysis and compared by log-rank tests. Differences between the training and validation cohorts were evalu-ated by the Mann–Whitney U test for continuous vari-ables and the Chi squared test for categorical varivari-ables. We performed descriptive analyses and the described statistical tests using SPSS statistical software, version 23 (IBM Corporation, New York, USA). A statistical frame-work was constructed to identify potential gene signa-tures and corresponding prognostic models to optimally predict the primary and secondary endpoints. In order to evaluate the prognostic performance of our developed models, the concordance index (ci) was calculated (31). While ci = 0.5 was obtained for a non-informative model, ci = 1.0 represents a perfectly predicting model. To com-pare the performance between nested multivariable Cox models, the likelihood ratio test was applied. The model was validated using the independent validation cohort in silico (TCGA and GEO datasets). The 95% confidence interval (CI) of the ci was estimated from 1000 bootstrap samples of the training and validation cohort. Finally, the validation was declared successful if the 95% CI did not contain 0.5. In addition, interaction and stratified analy-ses were conducted according to age (< 60 and > 60 years), gender (male and female), HBV status (positive and nega-tive), receiving adjuvant transarterial chemoembolization (TACE) (yes and no), AFP (< 200 and > 200 ng/ml), tumor parameters (tumor diameters < 5 and > 5 cm, tumor dif-ferentiation (I/II and III/IV), tumor numbers (single and multiple), and TNM stage (I/II and III/IV). The frame-work to determine gene signatures and correspond-ing prognostic models was implemented in R Statistics version 3.3.2 (R Foundation for Statistical Computing, Vienna, Austria (32, 33). For all analyses, two-sided tests were performed and P-values below 0.05 were considered statistically significant. We included the three most sig-nificant clinical, pathological, and molecular parameters in the all cohorts of HCC patients to build a composite prognostic model by using the R package: rms (http:// www.R-proje ct.org/).
Results
Patient cohorts
In this retrospective study, a training cohort of 205 patients and an independent, monocenter internal valida-tion cohort of 69 patients and in silico validavalida-tion cohorts of 369 patients with resected HCC were available for the development of a gene signature to predict the clinical endpoints of DFS and OS. Patient data, treatment param-eters, and tumor characteristics of both patient cohorts are summarized in Table 1. The entire cohort was mostly male (74%) with a mean age of greater than 50 years and
with the following tumor parameters: single tumor num-ber (50%), tumor diameter (5.3 ± 4.0 cm), tumor differen-tiation (I/II: 38.5%; III/IV: 61.4%), TNM stage (I: 59.1%; II: 28.7%; III/IV: 18.0%) or receiving adjuvant TACE (yes: 35.4%; no: 64.6%). In addition, HBV DNA-positive patients in the entire cohort was 87.8% in the training set vs. 89.9% in the internal validation set vs. 37.1% in the TCGA and GEO dataset. A first cohort of 205 patients treated by liver surgery was used at Zhongshan Hospital of Fudan University to identify a gene signature and an internal, and two in silico validation cohorts of 69, 369, and 80 patients in the TCGA or GEO dataset (Table 1
and Fig. 1).
A nine‑gene signature associated with prognosis in resected HCC training and validation cohorts
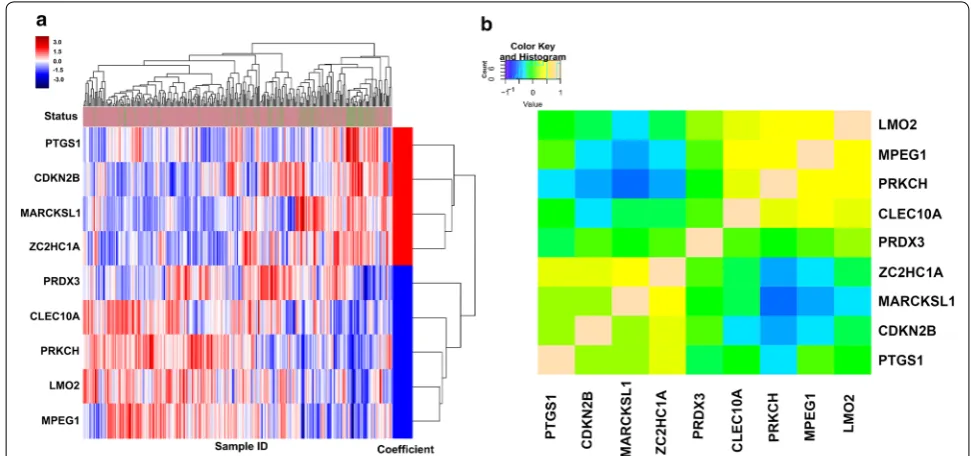
In the training cohort (205 HCC patients at Zhong-shan Hospital), we found a panel of nine genes, includ-ing Myristoylated alanine-rich C kinase substrate like-1 (MARCKSL1), zinc finger C2HC-type contain-ing 1A (ZC2HC1A), prostaglandin-endoperoxide syn-thase 1 (PTGS1), cyclin dependent kinase inhibitor 2B (CDKN2B), C-type lectin domain family 10 member A (CLEC10A), Peroxiredoxin2 (PRDX2), Protein kinase C eta (PRKCH), Macrophage expressed 1 (MPEG1), LIM domain only 2 (LMO2), which showed the strong-est prognostic relevance (Fig. 2b). Among these genes, four were upregulated (ZC2HC1A, MARCKSL1, PTGS1, CDKN2B) and five (CLEC10A, PRDX3, PRKCH, MPEG1, LMO2) were downregulated in HCC with poor prognosis (Additional file 2: Table S2). We then con-structed a nine-gene signature using the coefficient for-mulas of the multivariate Cox model from the training population. The formula as follows: 0.142772 * ZC2HC1A
populations (Additional file 3: Figures S1ID, E). The AUC was also calculated at different time points of DFS and OS (1-year, 3-year, and 5-year, respectively); the sum-mary measure of the AUC all reached over 0.70, showing good consistency performance of the nine-gene signature regardless of different time points for OS and DFS (Addi-tional file 4: Figure S2I).
Among all 643 resected HCC patients, nine-gene signa-ture classified 321 patients into the poor prognosis group. This molecular poor prognosis group was associated with previously important clinical parameters (tumor size and stage) significantly and pathological (microvascular inva-sion and tumor differentiation) characteristics (Addi-tional file 5: Table S3). In contrast, our gene signature was not related to age, gender, non-HBV liver disease, tumor number or receiving adjuvant TACE.
Inclusion of clinical parameters to the nine‑gene HCC signature
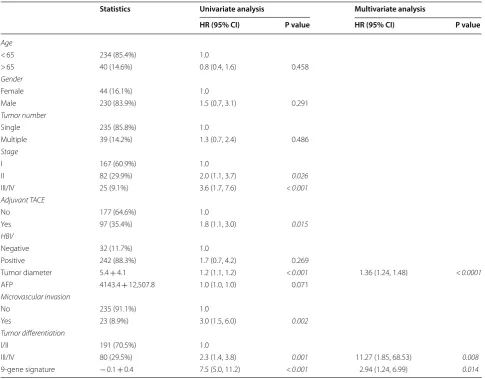
We next to evaluate the independent predictive prognos-tic value of the nine-gene signature. The nine-gene signa-ture was related to OS irrespective of some clinical and pathological factors, including staging, for the training and validation cohorts (Table 2). As our training cohort reflecting the diversity of HCC in term of stage, tumor etiology, or receiving adjuvant therapy, we evaluated the predictive performance of our nine-gene signature in each condition (Additional file 4: Figure S2II). Interest-ingly, our nine-gene signature was associated with OS
in each subgroup significantly, regardless of age, gender, serum levels of AFP, tumor number, tumor size, tumor differentiation, except for tumor stage III/IV and the presence of microvascular invasion (Additional file 4: Fig-ure S2II). Similarly, the Kaplan–Meier analyses showed our molecular signature conferred significant survival benefits in terms of tumor characteristics, such as tumor stage (stage I or II; both P < 0.001), tumor differentiation (P < 0.001), and clinical parameter: presence of microvas-cular invasion (P < 0.0001; see Additional file 6: Figure S3I). Interestingly, to explore the prognostic value of the nine-gene signature for other treatment options, receiv-ing adjuvant TACE after curative resection accounted for 35.4% in the training and validation cohorts. Strati-fied analyses showed that the nine-gene signature also enabled to predict prognosis for HCC patients receiving adjuvant TACE (HR = 3.2, P < 0.001; Additional file 4: Fig-ure S2II, Additional file 6: Figure S3I).
Specifically, in our training and TCGA validation cohorts, 504 (81.3%) of HCC patients was classified into stage I/II disease (Table 1). Therefore, we measured predictive performance of our nine-gene signature in HCC patients with early (Stages I and II) disease. Firstly, we indicated that HCC patients in stage I (n = 339)
and II (n = 165) (from training and validation
popula-tions) showed a wide range of survival times, from a few months to more than 10 years. The nine-gene sig-nature accurately predicted OS of these patients in the Kaplan–Meier analyses (stage I, P = 0.0032, HR = 2.1;
[image:6.595.54.540.88.316.2]stage II, P < 0.0001, HR = 6.1) (Additional file 4: Figure
S2II and Additional file 7: Figure S4II). The nine-gene sig-nature was also evaluated in different subgroups of HCC patients (Additional file 4: Figure S2II). Interestingly, it did not predict survival of stage III or IV HCC patients (P = 0.1; Additional file 7: Figure S4II) and the interaction
analyses showed that significant differences only existed in Stage I, II, and III/IV patients (P = 0.03; Additional
file 4: Figure S2II). Therefore, the nine-gene signature may allow a reliable prediction of survival in early-stage HCC patients.
Then, we compared the AUC of the nine-gene signa-ture with clinical parameters only in the entire cohort, showing that the nine-gene signature outperformed clinical parameters only (AUC: 0.842 vs 0.751, P < 0.001, Additional file 3: Figure S1IF). For the training cohort, it was shown that the established clinical parameters
of tumor diameter (< 5 cm or > 5 cm) and tumor dif-ferentiation (I/II or III/IV) significantly correlated with OS or DFS. For short term OS (Table 3), using only these two parameters resulted in a lower performance (Training: ci = 0.70 (0.46, 0.94), internal validation:
ci = 0.68 (0.21, 0.98); in silico validation ci = 0.54 (0.42,
0.78)) compared with the nine-gene signature (train-ing: ci = 0.79 (0.62, 0.97); internal validation ci = 0.77
(0.55, 0.99); in silico validation ci = 0.65 (0.57, 0.99)).
Finally, both the clinical parameters of tumor diameter (< 5 cm vs. > 5 cm) and tumor differentiation (I/II vs. III/IV) as well as the nine-gene signature, increased the training ci to 0.85 (0.74, 0.99), the internal validation ci to 0.86 (0.58, 1.13), and the in silico validation to 0.78 (0.61, 0.98). While in training, the clinical Cox model was significantly improved by adding clinical parame-ters (P = 0.001), adding the nine-gene signature to the
Table 2 Univariable and multivariable Cox regression of overall survival in training and validation cohort
TACE transarterial chemoembolization, AFP alpha-fetoprotein Italic P values indicate P < 0.05
Statistics Univariate analysis Multivariate analysis
HR (95% CI) P value HR (95% CI) P value
Age
< 65 234 (85.4%) 1.0
> 65 40 (14.6%) 0.8 (0.4, 1.6) 0.458
Gender
Female 44 (16.1%) 1.0
Male 230 (83.9%) 1.5 (0.7, 3.1) 0.291
Tumor number
Single 235 (85.8%) 1.0
Multiple 39 (14.2%) 1.3 (0.7, 2.4) 0.486
Stage
I 167 (60.9%) 1.0
II 82 (29.9%) 2.0 (1.1, 3.7) 0.026
III/IV 25 (9.1%) 3.6 (1.7, 7.6) <0.001
Adjuvant TACE
No 177 (64.6%) 1.0
Yes 97 (35.4%) 1.8 (1.1, 3.0) 0.015
HBV
Negative 32 (11.7%) 1.0
Positive 242 (88.3%) 1.7 (0.7, 4.2) 0.269
Tumor diameter 5.4 + 4.1 1.2 (1.1, 1.2) <0.001 1.36 (1.24, 1.48) <0.0001
AFP 4143.4 + 12,507.8 1.0 (1.0, 1.0) 0.071
Microvascular invasion
No 235 (91.1%) 1.0
Yes 23 (8.9%) 3.0 (1.5, 6.0) 0.002
Tumor differentiation
I/II 191 (70.5%) 1.0
III/IV 80 (29.5%) 2.3 (1.4, 3.8) 0.001 11.27 (1.85, 68.53) 0.008
[image:7.595.56.542.100.479.2]clinical parameters resulted only in a small improve-ment (P = 0.082).
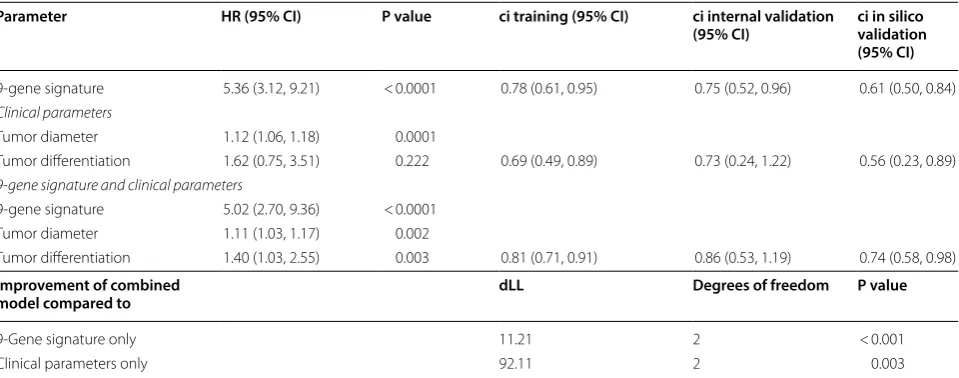
For long term survival (Table 4), using only these two parameters resulted in lower performance (train-ing: ci = 0.69 (0.49, 0.89), internal validation: ci = 0.73 (0.24, 1.22); in silico validation ci = 0.56 (0.23, 0.89))
compared with the nine-gene signature [training: ci = 0.78 (0.61, 0.95); internal validation ci = 0.75 (0.52, 0.96); in silico validation ci = 0.61 (0.50, 0.84)]. Finally, both the clinical parameters of tumor diameter (< 5 cm vs. > 5 cm) and tumor differentiation (I/II vs. III/IV) as well as the nine-gene signature, increased the train-ing ci to 0.81 (0.71, 0.91), the internal validation ci to Table 3 Multivariable Cox regression of short-term overall survival
Three multivariable Cox regression models were built using the training cohort: a model consisting of only the 9-gene signature (top), a model consisting only of the clinical tumor diameter and tumor differentiation, and a model combining both the 9-gene signature and clinical parameters (bottom). HRs are given with their 95% CIs and the corresponding P values. For each model, the concordance index (ci) is given for the training and internal validation cohort as well as for the patients of the or in silico validation cohort. Its 95% CI is determined from 1000 bootstrap samples of the respective cohort. The improvement of the combined model, including the 9-gene signature and the clinical parameters, compared with the 9-gene signature and clinical parameters alone is shown (bottom) based on the difference in log-likelihood (dLL)
Parameter HR (95% CI) P value ci training (95% CI) ci internal validation
(95% CI) ci in silico validation (95% CI)
9‑gene signature 3.37 (1.53, 7.49) < 0.0001 0.79 (0.62, 0.97) 0.77 (0.55, 0.99) 0.65 (0.57, 0.99)
Clinical parameters
Tumor diameter 1.10 (0.98, 1.16) 0.092
Tumor differentiation 1.84 (1.55, 6.09) 0.002 0.70 (0.46, 0.94) 0.68 (0.21, 0.98) 0.54 (0.42, 0.78)
9-gene signature and clinical parameters
9‑gene signature 15.38 (5.02, 47.71) < 0.0001
Tumor diameter 1.07 (1.01, 1.20) 0.003
Tumor differentiation 1.39 (1.10, 3.30) < 0.01 0.85 (0.74, 0.99) 0.86 (0.58, 1.13) 0.78 (0.61, 0.98)
Improvement of combined
model compared to dLL Degrees of freedom P value
9‑Gene signature only 7.24 2 < 0.001
Clinical parameters only 23.41 2 0.082
Table 4 Multivariable Cox regression of long-term overall survival
Three multivariable Cox regression models were built using the training cohort: a model consisting of only the 9-gene signature (top), a model consisting only of the clinical tumor diameter and tumor differentiation, and a model combining both the 9-gene signature and clinical parameters (bottom). HRs are given with their 95% CIs and the corresponding P values. For each model, the concordance index (ci) is given for the training and internal validation cohort as well as for the patients of the or in silico validation cohort. Its 95% CI is determined from 1000 bootstrap samples of the respective cohort. The improvement of the combined model, including the 9-gene signature and the clinical parameters, compared with the 9-gene signature and clinical parameters alone is shown (bottom) based on the difference in log-likelihood (dLL)
Parameter HR (95% CI) P value ci training (95% CI) ci internal validation
(95% CI) ci in silico validation (95% CI)
9‑gene signature 5.36 (3.12, 9.21) < 0.0001 0.78 (0.61, 0.95) 0.75 (0.52, 0.96) 0.61 (0.50, 0.84)
Clinical parameters
Tumor diameter 1.12 (1.06, 1.18) 0.0001
Tumor differentiation 1.62 (0.75, 3.51) 0.222 0.69 (0.49, 0.89) 0.73 (0.24, 1.22) 0.56 (0.23, 0.89)
9-gene signature and clinical parameters
9‑gene signature 5.02 (2.70, 9.36) < 0.0001
Tumor diameter 1.11 (1.03, 1.17) 0.002
Tumor differentiation 1.40 (1.03, 2.55) 0.003 0.81 (0.71, 0.91) 0.86 (0.53, 1.19) 0.74 (0.58, 0.98)
Improvement of combined
model compared to dLL Degrees of freedom P value
9‑Gene signature only 11.21 2 < 0.001
[image:8.595.58.546.102.291.2] [image:8.595.59.539.376.565.2]0.86 (0.53, 1.19), and in silico validation ci to 0.74 (0.58, 0.98). In terms of primary endpoint, DFS was consid-ered. The nine-gene signature for resected HCC com-bined with the clinical features of tumor diameter and tumor differentiation was trained and validated for DFS, yielding the same trending results with OS (Table 5).
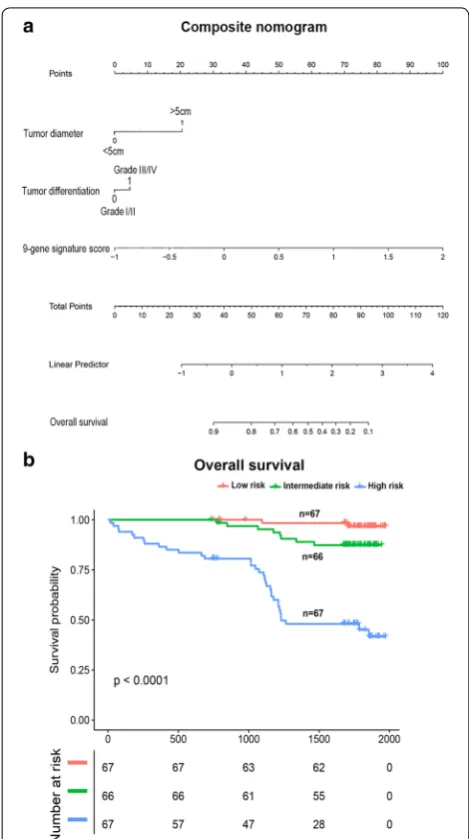
Finally, our established composite nomogram included tumor diameter, tumor differentiation, and nine-gene sig-nature. The contribution of each parameters to predict OS at 5 years was showed in the nomogram (Fig. 3a). The combined scoring model divided HCC patients into 33rd and 66th percentiles accurately according to low, inter-mediate, and high risk categories (Fig. 3b).
Nine‑gene signature predicts prognosis of HBV‑DNA positive HCC patients
Because HCC patients were predominantly HBV infected (86%) in our training or validation cohort, we further measured the performance of identified nine-gene sig-nature and clinical parameters in patients with HBV infected for OS (Additional file 8: Table S4).
First, we evaluated the clinical benefits of the nine-gene signature only in patients with HBV-DNA positive tumors (Additional file 7: Figure S4I). The nine-gene sig-nature predicted 3-year DFS (P < 0.019), DFS (P < 0.0001), 3-year OS (P < 0.0001), and OS (P < 0.0001) in the train-ing and internal validation set (Additional file 7: Figure S4I). In addition, for the in silico validation of the TCGA dataset, the nine-gene signature was also significantly
associated with 3-year OS (P = 0.02) and 5-year OS (P = 0.021).
Using only these two parameters resulted in a lower performance (training: ci = 0.68 (0.31, 1.04), validation: ci = 0.69 (0.49, 0.89)) compared with the nine-gene sig-nature [training: ci = 0.77 (0.65, 0.89); validation ci = 0.73 (0.55, 0.85)]. Finally, both the clinical parameters of tumor diameter and tumor differentiation, as well as the nine-gene signature, increased the training ci to 0.85 (0.75, 0.95) and validation ci to 0.82 (0.68, 0.96). The clinical Cox model was significantly improved by adding clinical parameters (P = 0.01) and adding the nine-gene signature to the clinical parameters also resulted in sig-nificant improvement (P = 0.001).
In silico validation of nine‑gene signature
in microarray‑based aHCC and comparison with other molecular biomarkers
The nine-gene signature was further evaluated in another cohort of 80 resected HCCs from HCC Genomic Con-sortium (GSE10143) [24]. In this 80 HCC patient series, 71% of patients had hepatitis C. Additional file 7: Figure S4I showed that the nine-gene signature also enabled to predict OS (P < 0.0001) for patients primarily with HCV affection.
As for many gene expression signatures derived from tumors, the prognostic value of the five-gene sig-nature outperformed previous molecular sigsig-natures [16], such as the proliferative signature [27], metas-tasis signature [22], and the hypoxia signature [18].
Table 5 Multivariable Cox regression of disease-free survival
Three multivariable Cox regression models were built using the training cohort: a model consisting of only the 9-gene signature (top), a model consisting only of the clinical tumor diameter and tumor differentiation, and a model combining both the 9-gene signature and clinical parameters (bottom). HRs are given with their 95% CIs and the corresponding P values. For each model, the concordance index (ci) is given for the training and internal validation cohort as well as for the patients of the or in silico validation cohort. Its 95% CI is determined from 1000 bootstrap samples of the respective cohort. The improvement of the combined model, including the 9-gene signature and the clinical parameters, compared with the 9-gene signature and clinical parameters alone is shown (bottom) based on the difference in log-likelihood (dLL)
Parameter HR (95% CI) P value ci training (95% CI) ci internal validation
(95% CI) ci in silico validation (95% CI)
9‑gene signature 4.44 (2.36, 8.33) < 0.0001 0.70 (0.58, 0.82) 0.74 (0.53, 0.95) 0.65 (0.55, 0.83)
Clinical parameters
Tumor diameter 1.13 (1.06, 1.20) 0.0001
Tumor differentiation 1.58 (0.89, 2.80) 0.115 0.64 (0.50, 0.78) 0.67 (0.24, 0.99) 0.57 (0.41, 0.73)
9-gene signature and clinical parameters
9‑gene signature 3.95 (0.68, 7.45) < 0.0001
Tumor diameter 1.08 (1.01, 1.12) 0.010
Tumor differentiation 1.29 (0.68, 2.50) 0.422 0.79 (0.55, 1.03) 0.83 (0.57, 1.36) 0.70 (0.58, 0.92)
Improvement of combined
model compared to dLL Degrees of freedom P value
9‑Gene signature only 10.53 2 < 0.001
[image:9.595.58.543.484.673.2]However, in this HCC cohort patients, the nine-gene signature (P = 0.0016) was better associated with OS than the five-gene signature (our 9-gene signature are not comprised these five genes; nonsignificant, P = 0.064; Additional file 6: Figure S3IIA-B). In addi-tion, our bivariate analysis showed the nine-gene sig-nature’s superiority to predict patients prognosis in the setting of surgically resected HCC patients [24] (n = 80, GSE10143, Additional file 9: Table S5). Alto-gether, these findings revealed that the superiority
of our nine-gene signature to predict resected HCC patient prognosis when compared with other molecu-lar biomarkers.
Discussion
In our study, we proposed the nine-gene signature asso-ciated with HCC prognosis closely after liver surgery or adjuvant TACE. This 9-gene signature showed improved prognostic accuracy when compared with the previ-ous five-gene signature [16]. In the Nault et al. study, an established five-gene signature (P < 0.00003 for overall survival) was shown to be better associated with survival than other proliferative [27], metastasis [22], and hypoxia signatures [18]. In addition, there’s another advantage for our gene signature to confer a continuous evaluation of OS rates for individual HCC patients. We presented to challenge the opposition between classical molecular and clinical or pathological biomarkers. Considering the above aim, we combined our nine-gene signature with clinical parameters in a new nomogram to refine model’s predictive performance.
Our nine identified genes contained genes ZC2HC1A,
MARCKSL1, PTGS1, CDKN2B, CLEC10A, PRDX3,
PRKCH, MPEG1, and LMO2. MARCKSL1 is a
mem-brane-bound protein that is associated with cell spread-ing, integrin activation, and exocytosis [28]. In a prospective clinical study including 305 cancer patients [28], MARCKSL1 has a strong prognostic value in lymph node-negative cancer patients, especially in those with high proliferation. The final Cox model predicted that a high expression of MARCKSL1 was related to lower HCC survival, which may be due to its role in activating cell spreading and growth. However, to date, very little is known about ZC2HC1A and PTGS1 and their roles in cancer. PTGS1 (also known as COX1), is a critical lipid metabolism molecular protein, and has been shown to be a pro-inflammatory mediator associated with an increased risk of colon cancer [29]. CDKN2B (also named INK4B), a key cell cycle inhibitor, is related to the cell cycle and TGF-beta signaling pathway in cancer [30,
31]. A recent study [32] showed that loss of STAT5 from hepatocytes in liver tissue lead to enhanced proliferation, which was linked to reduced levels of cell cycle inhibitors p15 (INK4B) and p21 (CIP1). In a clinical study, a genetic variant of CDKN2B had an increased risk of cancer sus-ceptibility [33]. CLEC10A induces both the production and secretion of interleukin (IL)-10 [34], while decreasing the levels of TGF-β. IL-10 triggers anticancer immunity in the tumor microenvironment [35]. Hence, downregu-lated expression of CLEC10A is associated with poor prognosis in HCC, which is in line with our findings.
PRDX2 is a member of the peroxiredoxin family of anti-oxidant enzymes. One previous study has showed that
[image:10.595.56.291.85.505.2]PRDX2 acted as a cell type-dependent role in tumorigen-esis [36]. The new target of miR-122a has been proved to be PRDX2 [37], revealing downregulated in HCC, which is similar to our results. PRKCH is one of the members of the protein kinase C family [38]. Several studies have showed that the role of PRKCH played an important part in apoptosis and anti-apoptosis [39, 40]. The low expres-sion of PRKCH could inhibit the growth of breast can-cer cells, which is conversely upregulated expression in breast cancer. In addition, PRKCH could contribute to resistance against the breast cancer cell death by inhib-iting JNK activity [41]. Aberrant signal transduction via protein kinases such as PKC may occur during liver can-cer development [42]. MPEG1 is overexpressed in sev-eral human cancer tissues, including pancreas, breast, lung, liver, and thyroid [43]. Some studies revealed that the depletion of MPEG1 could impact cell mitosis [44]. A lack of MPEG1 disturbs centrosome duplication, and induces chromosome misalignment and mis-segregation [44]. Additionally, depletion of MPEG1 restrains HCC cells uncontrollable growth [42, 45]. LMO2 is a member of a transcription factor family of proteins and is a deter-minant of vascular development in the zebrafish because of an effect on embryonic angiogenesis, which seems to be on endothelial cell migration, rather than proliferation [46, 47].
The identified nine-gene signature showed good prognostic ability for endpoint DFS or OS in the vali-dation cohort (ci = 0.70 for DFS, ci = 0.78 for OS). The predictive performance of the signature was testified in different HCC patient subgroups (Additional file 7: Figure S4II). This consistency across different sub-groups of patients reveals that the nine-gene signature determining disease progression and survival are con-served regardless of HCC heterogeneity. This is nota-ble, since HCC is known to be derived from various cell types, including hepatocytes, adult stem or progenitor cells [48] and is led by several etiologies. When com-bined with the clinical parameters of tumor diameter and tumor differentiation, its performance could be further improved (ci = 0.79 for DFS; ci = 0.85 for OS). This indicates that the combination of well-established clinical parameters and prognostic biomarkers may lead to a more accurate prognosis than each of them alone. The model including only clinical parameters showed the lowest validation performance (ci = 0.68 for OS; ci = 0.67 for DFS). In the Cox model combin-ing clinical parameters with the nine-gene signature, most signature genes were significantly associated with patient survival. The final Cox model showed bet-ter performance in the training cohort (ci = 0.83) than in the validation cohort (ci = 0.77 for internal valida-tion; ci = 0.65 for in silico validation). This difference is
expected, since the final Cox model is adjusted to the training cohort and potential overfitting might occur. In addition, the validation of the proposed nine-gene signature might be impeded by the significant differ-ences between both patient cohorts. In the valida-tion cohorts, patients were clinically characterized by a higher percentage of HCV-infection, higher tumor numbers, and higher tumor stage. On the other hand, the in silico validation cohort had a higher percentage of unfavorable tumor differentiation (III/IV: 84.9%) than the training cohort (III/IV: 32.6%). These nega-tive prognostic factors outbalanced the posinega-tive ones, resulting in differences in outcomes.
Our validation HCC cohort is characterized by dif-ferent etiologies (e.g., hepatitis C, and hepatitis B virus) and by various tumor stages from early to advanced HCC. In comparison to other studies that mainly focused on HBV-related HCC, we validated our gene signature in another two in silico HCC cohorts, mainly related to HCV infection in Western patients and HBV infection in Eastern patients, all revealing its good pre-dictive performance in different clinical settings. In all, we validated our nine-gene signature in 723 HCC patients undergoing liver resection worldwide and in different settings (Additional file 6: Figure S3I).
In the future, the values of our nine-gene signature also need to be validated in clinical guidelines. Firstly, we could use the nine-gene signature to stratify the risk of HCC patient survival before the decision for liver surgery is made. Particularly, the 9-gene signa-ture, in the presence of MVI and advanced stage HCC, could identify HCC patients with a good prognosis that would benefit from therapy, and patients with a poor prognosis who could avoid unnecessary surgery [49,
50]. Evidently, we need to validate the gene signature in prospective studies and in other kinds of curative ther-apies. Even though the finite treatment options after curative resection in our routine clinical practice, the nine-gene signature could also classify death risk after liver surgery combined with adjuvant TACE (Addi-tional file 7: Figures S4I, II).
Conclusions
in clinical and therapeutic decision making for HCC patients (Additional file 6: Figure S3II).
Additional files
Additional file 1: Table S1. Name list of the genes tested by Nanostring in our study for further analysis.
Additional file 2: Table S2. The coefficient and regulation of 9‑gene signature.
Additional file 3: Figure S1. The area under the curve related to overall survival, the Kaplan–Meier analyses according to 9‑gene signature (Panel I) and each nine genes (Panel II) in training and validation cohorts. Panel I: A: training set; B: internal validation set; C: in silico validation set; D. train‑ ing set; E. validation set; F. entire set. Panel II: The genes were divided by median expression.
Additional file 4: Figure S2. The time‑dependent area under the curve related to overall survival, disease‑free survival at different years (Panel I; 1‑year, 3‑year and 5‑year) and the subgroup analysis for 9‑gene signature in different clinical characteristics (Panel II).
Additional file 5: Table S3. Correlation between 9‑gene signature and clinicopathologic characteristics from training and validation cohort. Additional file 6: Figure S3. The Kaplan–Meier analyses according to 9‑gene signature in different subgroups (Panel I) and the comparison of 9‑gene signature with other molecular score for Kaplan–Meier analyses analysis. Panel II: A: 5‑gene signature; B: 9‑gene signature.
Additional file 7: Figure S4. The Kaplan–Meier analyses for HBV‑related (Panel I) and different stage HCC patients (Panel II) according to 9‑gene signature in training and validation cohort in terms of overall survival and disease‑free survival. Panel II: A: stage I HCC patients; B: stage II HCC patients; C. stage III/IV HCC patients.
Additional file 8: Table S4. Multivariable Cox regression of overall survival for patients with HBV‑DNA positive tumors.
Additional file 9: Table S5. Comparison of the 9‑gene signature and the 5‑genes signature to predict overall survival using bivariate analysis in GEO set of patients (n=80).
Abbreviations
HCC: hepatocellular carcinoma; AFP: α‑fetoprotein; REMARK: Reporting Recommendations for Tumor Marker Prognostic Studies; DFS: disease free survival; OS: overall survival; CI: confidence interval; HR: hazard risk; TACE: tran‑ sarterial chemoembolization; TNM: tumor‑node‑metastasis; BCLC: Barcelona Clinic Liver cancer; ci: concordance index; HBV: hepatitis B virus; MARCKSL1: myristoylated alanine‑rich C; kinase substrate like‑1; ZC2HC1A: zinc finger C2HC‑type containing 1A; PTGS1: prostaglandin‑endoperoxide synthase 1; CDKN2B: cyclin dependent kinase inhibitor 2B; CLEC10A: C‑type lectin domain family 10 member A; PRDX2: peroxiredoxin2; PRKCH: protein kinase C eta; MPEG1: macrophage expressed 1; LMO2: LIM domain only 2.
Acknowledgements
This work was supported by the National Natural Science Fund of China (Grant Numbers: 81672330; 81472218). We thank pathologist (Sun Chun) for helping in the tumor tissue selection.
Authors’ contributions
Zhu GQ, Chen EB, Yang Y, Liu TS, Wang B and Dai Z designed the study. Zhu GQ collected tissue samples and data. Wang B, Xiao K and Shi SM did the statistical analyses. Chen EB, Liu TS, Shi SM and Yang Y prepared figures. Zhu GQ, Chen EB, Liu TS, Yang Y, Zhou SL, Zhou ZJ, Zhou J and Shi YH reviewed the results, interpreted data, and wrote the manuscript. All authors have made an intellectual contribution to the manuscript. All authors read and approved the final manuscript.
Funding
This work was supported by the National Natural Science Fund of China (Grant Numbers: 81672330; 81472218).
Availability of data and materials
Two independent cohorts, TCGA set (n = 369, HCC patients undergoing sur‑ gery) was obtained from https ://cance rgeno me.nih.gov/, and GSE10143 was downloaded from GEO (http://www.ncbi.nlm.nih.gov/geo/). Our expression profiling arrays were analyzed by the ‘scipy’ package (scipy.stats.pearsonr) of Python to determine whether gene expression correlated with prognosis.
Ethics approval and consent to participate
All procedures were performed by the ethical standards of our institutional research committee and with those of the 1964 Helsinki Declaration and its later amendments or comparable ethical standards. Written informed consent was obtained from each participant by the institutional guidelines.
Consent for publication
Informed consent was obtained from all participants for publication.
Competing interests
The authors declare that they have no competing interests.
Author details
1 Liver Cancer Institute, Zhongshan Hospital, Fudan University, Shang‑ hai 200032, China. 2 State Key Laboratory of Genetic Engineering, Fudan University, Shanghai 200032, China. 3 Department of Medical Oncology, Zhongshan Hospital, Fudan University, Shanghai 200032, China. 4 Department of Radiation Oncology, Zhongshan Hospital, Fudan University, Shang‑ hai 200032, China.
Received: 18 February 2019 Accepted: 3 June 2019
References
1. El‑Serag HB, Rudolph KL. Hepatocellular carcinoma: epidemiology and molecular carcinogenesis. Gastroenterology. 2007;132:2557–76. 2. Younossi ZM, Otgonsuren M, Henry L, Venkatesan C, Mishra A, Erario
M, Hunt S. Association of nonalcoholic fatty liver disease (NAFLD) with hepatocellular carcinoma (HCC) in the United States from 2004 to 2009. Hepatology. 2015;62:1723–30.
3. El‑Serag HB. Hepatocellular carcinoma. N Engl J Med. 2011;365:1118–27. 4. Sobin LH. TNM, sixth edition: new developments in general concepts and
rules. Semin Surg Oncol. 2003;21:19–22.
5. Kudo M, Chung H, Osaki Y. Prognostic staging system for hepatocellular carcinoma (CLIP score): its value and limitations, and a proposal for a new staging system, the Japan Integrated Staging Score (JIS score). J Gastro‑ enterol. 2003;38:207–15.
6. Llovet JM, Bru C, Bruix J. Prognosis of hepatocellular carcinoma: the BCLC staging classification. Semin Liver Dis. 1999;19:329–38.
7. Leung TW, Tang AM, Zee B, Lau WY, Lai PB, Leung KL, Lau JT, Yu SC, Johnson PJ. Construction of the Chinese University Prognostic Index for hepatocellular carcinoma and comparison with the TNM staging system, the Okuda staging system, and the Cancer of the Liver Italian Program staging system: a study based on 926 patients. Cancer. 2002;94:1760–9. 8. Fridman WH, Pages F, Sautes‑Fridman C, Galon J. The immune contex‑
ture in human tumours: impact on clinical outcome. Nat Rev Cancer. 2012;12:298–306.
9. Marrero JA, Kudo M, Bronowicki JP. The challenge of prognosis and stag‑ ing for hepatocellular carcinoma. Oncologist. 2010;15(Suppl 4):23–33. 10. Barabasi AL, Oltvai ZN. Network biology: understanding the cell’s func‑
tional organization. Nat Rev Genet. 2004;5:101–13.
11. Koren S, Bentires‑Alj M. Breast tumor heterogeneity: source of fitness. Hurdle for therapy. Mol Cell. 2015;60:537–46.
13. Coulouarn C, Factor VM, Thorgeirsson SS. Transforming growth factor‑ beta gene expression signature in mouse hepatocytes predicts clinical outcome in human cancer. Hepatology. 2008;47:2059–67.
14. He S, Zhang DC, Wei C. MicroRNAs as biomarkers for hepatocellular carcinoma diagnosis and prognosis. Clin Res Hepatol Gastroenterol. 2015;39:426–34.
15. Li C, Chen J, Zhang K, Feng B, Wang R, Chen L. Progress and prospects of long noncoding RNAs (lncRNAs) in hepatocellular carcinoma. Cell Physiol Biochem. 2015;36:423–34.
16. Nault JC, De Reynies A, Villanueva A, Calderaro J, Rebouissou S, Couchy G, Decaens T, Franco D, Imbeaud S, Rousseau F, et al. A hepatocellular carcinoma 5‑gene score associated with survival of patients after liver resection. Gastroenterology. 2013;145:176–87.
17. Shi KQ, Lin Z, Chen XJ, Song M, Wang YQ, Cai YJ, Yang NB, Zheng MH, Dong JZ, Zhang L, Chen YP. Hepatocellular carcinoma associated micro‑ RNA expression signature: integrated bioinformatics analysis, experimen‑ tal validation and clinical significance. Oncotarget. 2015;6:25093–108. 18. van Malenstein H, Gevaert O, Libbrecht L, Daemen A, Allemeersch J,
Nevens F, Van Cutsem E, Cassiman D, De Moor B, Verslype C, van Pelt J. A seven‑gene set associated with chronic hypoxia of prognostic impor‑ tance in hepatocellular carcinoma. Clin Cancer Res. 2010;16:4278–88. 19. Zhang J, Chong CC, Chen GG, Lai PB. A seven‑microRNA expression
signature predicts survival in hepatocellular carcinoma. PLoS ONE. 2015;10:e0128628.
20. Zhang J, Fan D, Jian Z, Chen GG, Lai PB. Cancer specific long noncoding RNAs show differential expression patterns and competing endogenous RNA potential in hepatocellular carcinoma. PLoS ONE. 2015;10:e0141042. 21. Lu M, Kong X, Wang H, Huang G, Ye C, He Z. A novel microRNAs expres‑
sion signature for hepatocellular carcinoma diagnosis and prognosis. Oncotarget. 2017;8:8775–84.
22. Roessler S, Jia HL, Budhu A, Forgues M, Ye QH, Lee JS, Thorgeirsson SS, Sun Z, Tang ZY, Qin LX, Wang XW. A unique metastasis gene signature enables prediction of tumor relapse in early‑stage hepatocellular carci‑ noma patients. Cancer Res. 2010;70:10202–12.
23. Singhal A, Jayaraman M, Dhanasekaran DN, Kohli V. Molecular and serum markers in hepatocellular carcinoma: predictive tools for prognosis and recurrence. Crit Rev Oncol Hematol. 2012;82:116–40.
24. Hoshida Y, Villanueva A, Kobayashi M, Peix J, Chiang DY, Camargo A, Gupta S, Moore J, Wrobel MJ, Lerner J, et al. Gene expression in fixed tissues and outcome in hepatocellular carcinoma. N Engl J Med. 2008;359:1995–2004.
25. Sauerbrei W, Taube SE, McShane LM, Cavenagh MM, Altman DG. Reporting recommendations for tumor marker prognostic studies (REMARK): an abridged explanation and elaboration. J Natl Cancer Inst. 2018;110(8):803–11.
26. EASL‑EORTC clinical practice guidelines. management of hepatocellular carcinoma. J Hepatol. 2012;56:908–43.
27. Lee JS, Chu IS, Heo J, Calvisi DF, Sun Z, Roskams T, Durnez A, Demetris AJ, Thorgeirsson SS. Classification and prediction of survival in hepatocellular carcinoma by gene expression profiling. Hepatology. 2004;40:667–76. 28. Jonsdottir K, Zhang H, Jhagroe D, Skaland I, Slewa A, Bjorkblom B, Coffey
ET, Gudlaugsson E, Smaaland R, Janssen EA, Baak JP. The prognostic value of MARCKS‑like 1 in lymph node‑negative breast cancer. Breast Cancer Res Treat. 2012;135:381–90.
29. Sidahmed E, Sen A, Ren J, Patel A, Turgeon DK, Ruffin MT, Brenner DE, Djuric Z. Colonic saturated fatty acid concentrations and expression of COX‑1, but not diet, predict prostaglandin E2 in normal human colon tissue. Nutr Cancer. 2016;68:1192–201.
30. ShahidSales S, Mehramiz M, Ghasemi F, Aledavood A, Shamsi M, Hassan‑ ian SM, Ghayour‑Mobarhan M, Avan A. A genetic variant in CDKN2A/B gene is associated with the increased risk of breast cancer. J Clin Lab Anal. 2018. https ://doi.org/10.1002/jcla.22190 .
31. Hannon GJ, Beach D. p15INK4B is a potential effector of TGF‑beta‑ induced cell cycle arrest. Nature. 1994;371:257–61.
32. Yu JH, Zhu BM, Wickre M, Riedlinger G, Chen W, Hosui A, Robinson GW, Hennighausen L. The transcription factors signal transducer and activator of transcription 5A (STAT5A) and STAT5B negatively regulate cell prolifera‑ tion through the activation of cyclin‑dependent kinase inhibitor 2b (Cdkn2b) and Cdkn1a expression. Hepatology. 2010;52:1808–18.
33. Campa D, Pastore M, Gentiluomo M, Talar‑Wojnarowska R, Kupcinskas J, Malecka‑Panas E, Neoptolemos JP, Niesen W, Vodicka P, Delle Fave G, et al. Functional single nucleotide polymorphisms within the cyclin‑ dependent kinase inhibitor 2A/2B region affect pancreatic cancer risk. Oncotarget. 2016;7:57011–20.
34. Sakakura M, Oo‑Puthinan S, Moriyama C, Kimura T, Moriya J, Irimura T, Shi‑ mada I. Carbohydrate binding mechanism of the macrophage galactose‑ type C‑type lectin 1 revealed by saturation transfer experiments. J Biol Chem. 2008;283:33665–73.
35. Kudo M. Immuno‑oncology in hepatocellular carcinoma: 2017 update. Oncology. 2017;93(Suppl 1):147–59.
36. Lin LH, Xu YW, Huang LS, Hong CQ, Zhai TT, Liao LD, Lin WJ, Xu LY, Zhang K, Li EM, Peng YH. Serum proteomic‑based analysis identifying autoanti‑ bodies against PRDX2 and PRDX3 as potential diagnostic biomarkers in nasopharyngeal carcinoma. Clin Proteomics. 2017;14:6.
37. Zhou S, Han Q, Wang R, Li X, Wang Q, Wang H, Wang J, Ma Y. PRDX2 protects hepatocellular carcinoma SMMC‑7721 cells from oxidative stress. Oncol Lett. 2016;12:2217–21.
38. Porter SN, Magee JA. PRKCH regulates hematopoietic stem cell function and predicts poor prognosis in acute myeloid leukemia. Exp Hematol. 2017;53:43–7.
39. Abu‑Ghanem S, Oberkovitz G, Benharroch D, Gopas J, Livneh E. PKCeta expression contributes to the resistance of Hodgkin’s lymphoma cell lines to apoptosis. Cancer Biol Ther. 2007;6:1375–80.
40. Lu HC, Chou FP, Yeh KT, Chang YS, Hsu NC, Chang JG. Analysing the expression of protein kinase C eta in human hepatocellular carcinoma. Pathology. 2009;41:626–9.
41. Rotem‑Dai N, Oberkovitz G, Abu‑Ghanem S, Livneh E. PKCeta confers protection against apoptosis by inhibiting the pro‑apoptotic JNK activity in MCF‑7 cells. Exp Cell Res. 2009;315:2616–23.
42. Miao R, Wu Y, Zhang H, Zhou H, Sun X, Csizmadia E, He L, Zhao Y, Jiang C, Miksad RA, et al. Utility of the dual‑specificity protein kinase TTK as a therapeutic target for intrahepatic spread of liver cancer. Sci Rep. 2016;6:33121.
43. McCormack RM, Szymanski EP, Hsu AP, Perez E, Olivier KN, Fisher E, Goodhew EB, Podack ER, Holland SM. MPEG1/perforin‑2 mutations in human pulmonary nontuberculous mycobacterial infections. JCI Insight. 2017;2:89635.
44. Choi M, Min YH, Pyo J, Lee CW, Jang CY, Kim JE. TC Mps1 12, a novel Mps1 inhibitor, suppresses the growth of hepatocellular carcinoma cells via the accumulation of chromosomal instability. Br J Pharmacol. 2017;174:1810–25.
45. Liang XD, Dai YC, Li ZY, Gan MF, Zhang SR, Yin P, Lu HS, Cao XQ, Zheng BJ, Bao LF, et al. Expression and function analysis of mitotic checkpoint genes identifies TTK as a potential therapeutic target for human hepato‑ cellular carcinoma. PLoS ONE. 2014;9:e97739.
46. Gratzinger D, Zhao S, West R, Rouse RV, Vogel H, Gil EC, Levy R, Lossos IS, Natkunam Y. The transcription factor LMO2 is a robust marker of vascular endothelium and vascular neoplasms and selected other entities. Am J Clin Pathol. 2009;131:264–78.
47. Matrone G, Meng S, Gu Q, Lv J, Fang L, Chen K, Cooke JP. Lmo2 (LIM‑ Domain‑Only 2) modulates Sphk1 (Sphingosine Kinase) and promotes endothelial cell migration. Arterioscler Thromb Vasc Biol. 2017;37:1860–8. 48. Andersen JB, Loi R, Perra A, Factor VM, Ledda‑Columbano GM, Colum‑
bano A, Thorgeirsson SS. Progenitor‑derived hepatocellular carcinoma model in the rat. Hepatology. 2010;51:1401–9.
49. Clavien PA, Lesurtel M, Bossuyt PM, Gores GJ, Langer B, Perrier A. Recommendations for liver transplantation for hepatocellular carci‑ noma: an international consensus conference report. Lancet Oncol. 2012;13:e11–22.
50. Ramacciato G, Mercantini P, Petrucciani N, Ravaioli M, Cucchetti A, Del Gaudio M, Cescon M, Ziparo V, Pinna AD. Does surgical resection have a role in the treatment of large or multinodular hepatocellular carcinoma? Am Surg. 2010;76:1189–97.
Publisher’s Note