Bayesian Multi-Target Tracking:
Application to Total Internal
Reflection Fluorescence Microscopy
Seyed Hamid Rezatofighi
A thesis submitted for the degree of
Doctor of Philosophy at
The Australian National University
Acknowledgments
This thesis would certainly not have been possible without the help and support of many peoples. I would like to thank all those who have made this thesis possible.
First and foremost, I want to express my special appreciation and thanks to my supervisors Doctor Stephen Gould and Professor Richard Hartley. I am sin-cerely grateful to them for their valuable supervision, encouragement and kindness throughout my candidature. My success was not possible without them. Being a student of Richard is a privilege that only a few people in the world have had. I am so proud to have the opportunity to be one of those few people.
Besides my main supervisors, I would like to express my gratitude to my ad-visors, Doctor Katarina Mele and Doctor William E. Hughes who supported me throughout my PhD research and helped me to learn about the biological aspect of my thesis. I also appreciate them for inviting me to Sydney and giving me the op-portunity to work with many researchers in CSIRO computational informatics and Garvan Institute of Medical Research. I would like to thank Doctor James Burchfield for his insightful comments and conducive discussions on the biological side of my research.
During my PhD, I had honour of collaborating with Prof. Ba-Ngu Vo and Dr. Ba Tuong Vo. My sincere thanks goes to them as I have learnt so much from them. They had been a great support and helped me a lot while they were extremely busy during my visit periods.
Finally, I am more than grateful to my beloved wife, Anita, and my dear parents, Hossein and Katayoun, who have motivated and supported me in every step of my studies.
Abstract
This thesis focuses on the problem of automated tracking of tiny cellular and sub-cellular structures, known as particles, in the sequences acquired from total internal reflection fluorescence microscopy (TIRFM) imaging technique. Our primary biolog-ical motivation is to develop an automated system for tracking the sub-cellular struc-tures involving exocytosis (an intracellular mechanism) which is helpful for studying the possible causes of the defects in diseases such as diabetes and obesity. However, all methods proposed in this thesis are generalized in order to be applicable for a wide range of particle tracking applications.
A reliable multiple particle tracking method should be capable of tracking numer-ous similar objects in the presence of high levels of noise, high target density, complex motion patterns and intricate interactions. In this thesis, we choose the Bayesian fil-tering framework as our main approach to deal with this problem. We focus on the approaches that work based on detections. Therefore, in this thesis, we first propose a method that robustly detects the particles in the noisy TIRFM sequences with in-homogeneous and time-varying background. In order to evaluate our detection and tracking methods on the sequences with known and reliable ground truth, we also present a framework for generating realistic synthetic TIRFM data.
To propose a reliable multiple particle tracking method for TIRFM sequences, we suggest a framework by combining two robust Bayesian filters, the interacting multiple model and joint probabilistic data association (IMM-JPDA) filters. The performance of our particle tracking method is compared against those of several popular and state-of-the art particle tracking approaches on both synthetic and real sequences. Although our approach performs well in tracking particles, it can be very computationally demanding algorithm for the applications with dense targets with poor detections.
To propose a computationally cheap, but reliable, multiple particle tracking method, we investigate the performance of a recent multi-target Bayesian filter based on ran-dom finite theory, the probability hypothesis density (PHD) filter, on our application. To this end, we propose a general framework for tracking cellular and sub-cellular structures using the multiple model implementation of the PHD filter. Moreover, we assess the performance of our proposed PHD filter on both synthetic and real sequences with high level of noise and particle density. We compare its results from both aspect of accuracy and processing time against our IMM-JPDA filter.
Finally, we suggest a framework for tracking particles in a challenging problem where the noise characteristic and the background intensity of sequences change during the acquisition process which make detection profile and clutter rate time-variant. To deal with this, we propose a bootstrap filter using another type of the random finite set based Bayesian filters, the cardinalised PHD (CPHD) filter,
Contents
Acknowledgments vii
Abstract ix
1 Introduction 1
1.1 Motivation . . . 2
1.1.1 Exocytosis . . . 2
1.1.2 Total Internal Reflection Fluorescence Microscopy . . . 3
1.1.3 Need for Automated Tracking . . . 3
1.2 Scope and Contributions . . . 4
1.3 Summary . . . 5
2 Related Work and Background 7 2.1 Related work . . . 7
2.2 Background . . . 8
2.2.1 Bayesian Filtering . . . 8
2.2.2 Bayesian Filtering With Multiple Switching Dynamic Models . . 11
2.3 Summary . . . 12
3 Spot Detection 13 3.1 Related Work . . . 13
3.1.1 The Multi-Scale Variance-Stabilizing Transform (MSVST) . . . . 14
3.1.2 The h-dome Transformation . . . 14
3.2 Our Proposed Approach . . . 15
3.2.1 Noise Reduction . . . 15
3.2.2 Enhancement . . . 15
3.2.3 Detection . . . 18
3.3 Experimental Results . . . 19
3.3.1 Evaluation Metrics and Parameters . . . 19
3.3.2 Evaluation on Synthetic Data . . . 20
3.3.3 Evaluation on Real Data . . . 21
3.4 Summary . . . 22
4 A Framework for Generating Realistic Synthetic Data 27 4.1 Related Work . . . 27
4.2 Our Proposed Framework . . . 28
4.2.1 TIRFM Principle . . . 28
4.2.2 Intensity and Shape Model . . . 28
4.2.3 Point Spread Function . . . 30
4.2.4 Background Estimation . . . 31
4.2.5 Noise Generation . . . 31
4.2.6 Dynamic Models . . . 32
4.3 Experimental Results . . . 33
4.3.1 Parameter Settings . . . 33
4.3.2 Evaluation . . . 34
4.3.2.1 Vesicle Deformation . . . 34
4.3.2.2 Out of Focus Effect . . . 35
4.3.2.3 Background Estimation Accuracy . . . 36
4.3.2.4 Noise Characteristics . . . 37
4.3.2.5 The Dynamics of Structures . . . 37
4.4 Summary . . . 38
5 An Enhanced IMM-JPDA Filter for TIRF Microscopy Sequences 41 5.1 Related Work . . . 41
5.2 Background . . . 42
5.2.1 The Interacting Multiple Model (IMM) Filter . . . 43
5.2.2 The Joint Probabilistic Data Association (JPDA) Filter . . . 44
5.3 Our Proposed Framework . . . 44
5.3.1 State and Measurement Vectors . . . 45
5.3.2 An Improved IMM Filter for Biological Applications . . . 45
5.3.3 An Enhanced and Computationally Cheap JPDA . . . 47
5.3.4 Track Management . . . 48
5.3.4.1 Initialization and Track Initiation . . . 48
5.3.4.2 Temporary Target Disappearance and Track Termination 48 5.4 Experimental Results . . . 49
5.4.1 Evaluation Metrics . . . 51
5.4.1.1 OSPA . . . 51
5.4.1.2 OSPA-T . . . 52
5.4.2 Evaluation on Realistic Synthetic Sequences . . . 52
5.4.2.1 Spot Detection . . . 53
5.4.2.2 Spot Tracking . . . 53
5.4.3 Evaluation on Real Sequences . . . 55
5.4.3.1 Spot Detection . . . 56
5.4.3.2 Spot Tracking . . . 56
5.5 Summary . . . 58
6 Random Finite Set Based Bayesian Filtering 61 6.1 Random Finite Set . . . 61
6.1.1 Some Definitions . . . 62
6.1.2 Some Examples . . . 63
Contents xiii
6.2.1 Multi-Target Dynamical Model . . . 64
6.2.2 Multi-Target Measurement Model . . . 65
6.2.3 Bayes Multi-Target Filter . . . 65
6.2.4 RFS Bayesian Filtering Variants . . . 66
6.3 Summary . . . 67
7 A PHD Filter for Time-Lapse Microscopy Sequences 69 7.1 The PHD Recursive Equations . . . 69
7.2 Our Proposed Multiple Model PHD Filter . . . 71
7.2.1 The State and Measurement Vectors . . . 71
7.2.2 Modelling Manoeuvring Behaviour of Particles . . . 71
7.2.3 Modelling Spawn Term . . . 72
7.2.4 State-Dependent Survival and Detection Probabilities . . . 73
7.2.5 Modelling Birth Term . . . 73
7.2.6 A Closed-Form PHD Recursion . . . 74
7.3 Tag Propagation in The PHD Filter . . . 75
7.3.1 Tag propagation Scheme . . . 77
7.3.2 A Solution for Crossing Targets . . . 80
7.4 Experimental Results . . . 82
7.4.1 Evaluation on Synthetic Sequences . . . 82
7.4.1.1 Evaluation of The Tag Propagation Scheme . . . 83
7.4.1.2 Tracking Evaluation . . . 84
7.4.2 Evaluation on Real Sequences . . . 87
7.5 Summary . . . 87
8 Dealing With Time-Varying Clutter Rate and Detection Profile 89 8.1 Background . . . 90
8.2 Our Bootstrap CPHD Filter . . . 91
8.2.1 Multiple Model CPHD Filter . . . 92
8.2.2 Multiple Modelλ-pD-CPHD Filter . . . 93
8.3 Experimental Results . . . 95
8.3.1 Setup and Implementation Details . . . 96
8.3.2 Evaluation on Synthetic Data . . . 97
8.3.3 Evaluation on Real Data . . . 100
8.4 Summary . . . 103
9 Conclusion 107 9.1 Discussion and Conclusion . . . 107
9.2 Directions for Future Research . . . 110
10 Appendix 113 10.1 Multiple Model CPHD Recursions . . . 113
List of Figures
1.1 Different steps of exocytosis . . . 2
1.2 A schematic of TIRF microscopy and exocytosis visualization . . . 4
1.3 Some examples of real TIRFM images . . . 5
3.1 Intensity profiles of the noisy and smoothed images . . . 16
3.2 A 3-D presentation of h-dome transform . . . 17
3.3 A 3-D presentation of the optimal point and the adaptive mask . . . 18
3.4 A 3-D presentation of the MPHD method . . . 19
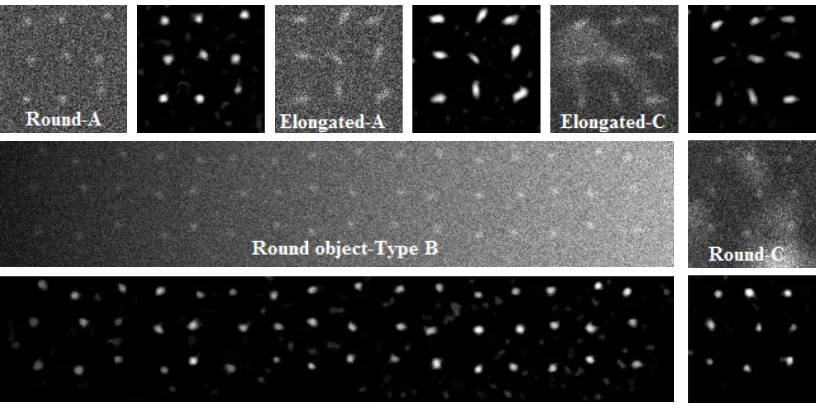
3.5 Different types of synthetic images and the enhanced images . . . 21
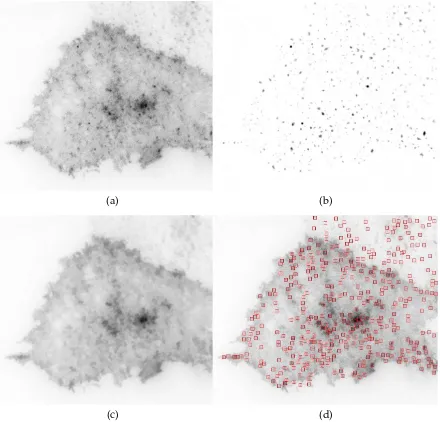
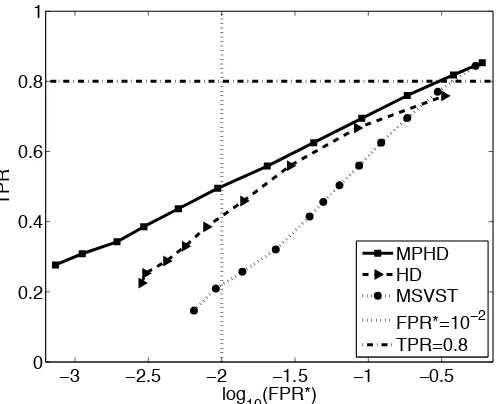
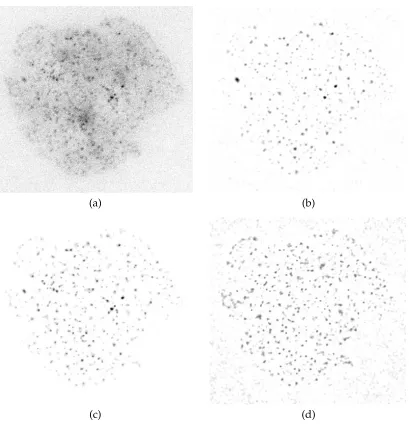
3.6 FROC curves of the MPHD method for the synthetic images at SNR=2 22 3.7 A real TIRFM image and its estimated background, spots and detections 23 3.8 FROC curves of the detectors for the real sequences . . . 25
3.9 A real TIRFM image and the enhancement results using the detectors . 26 4.1 The proposed evolving shape procedure of a sub-cellular object . . . 30
4.2 A realistic synthetic TIRFM image . . . 33
4.3 The shape deformation of the objects in real and synthetic data . . . 34
4.4 Out of focus effect in real data . . . 35
4.5 Simulation of the out of focus effect . . . 35
4.6 A real TIRFM image and its estimated background . . . 36
4.7 Mean intensity and noise characteristics of the sequences . . . 37
4.8 Vesicles’ motion in real and simulated data . . . 38
4.9 Another simulated TIRFM image . . . 39
4.10 A real and synthetic movie with time varying background and noise . . 40
5.1 A block diagram for our IMM-JPDA filter . . . 45
5.2 A part of the realistic synthetic data . . . 53
5.3 FROC curves of the detectors for the realistic synthetic sequences . . . . 54
5.4 Tracking result of the IMM-JPDA for some complex situations. . . 56
5.5 The tracking results of the IMM-JPDA on a real image sequence. . . 58
7.1 A schematic of our tag propagation method. . . 79
7.2 The PHD filtering results without and with tag propagation scheme . . 83
7.3 FPR∗ for the PHD filter without and with tag propagation scheme . . . 84
7.4 Tracking result of two crossing faint vesicles. . . 84
7.5 Processing time versus target density and clutter rate . . . 85
7.6 A failure case in the PHD filtering tracking result . . . 86
7.7 Tracking result of our MM-PHD filter for a real TIRFM movie. . . 88
8.1 Two images of a TIRFM movie before and after injection of insulin . . . 90
8.2 A schematic of the proposed bootstrap filter. . . 91
8.3 A schematic of the proposed MM-CPHD filter. . . 93
8.4 A schematic of the proposed MM-λ-pD-CPHD filter. . . 96
8.5 A synthetic TIRFM movie generated using our framework . . . 98
8.6 The estimation of clutter rate using the MM-λ-pD-CPHD filter . . . 99
8.7 The estimation of detection probability using the MM-λ-pD-CPHD filter 101 8.8 Estimation of clutter rate and detection probability on real data . . . . 103
List of Tables
3.1 Performance of the detectors on synthetic images . . . 24
3.2 Performance of the detectors on real images . . . 24
5.1 The configuration of the competing tracking methods . . . 50
5.2 Performance of the detectors on 10 realistic synthetic movies . . . 53
5.3 Performance of the tracking methods on 10 realistic synthetic movies . 55 5.4 Performance of the data associations on 10 realistic synthetic movies . . 55
5.5 Performance of the detectors on real TIRFM sequences . . . 56
5.6 Performance of the tracking methods on real TIRFM sequences . . . 57
5.7 Performance of the data associations on real TIRFM sequences . . . 57
7.1 Pseudo-Code for the prediction step of our MM-PHD filter. . . 76
7.2 Pseudo-Code for our tag propagation scheme . . . 81
7.3 Performance of the PHD and IMM-JPDA trackers on synthetic movies . 86 7.4 Performance of the PHD and IMM-JPDA trackers on real sequences . . 87
8.1 The trackers’ performance in the high clutter scenario using OSPA error 100 8.2 The tracker’s performance in the low clutter scenario using OSPA error 102 8.3 The trackers’ performance on the real sequences using OSPA error . . . 102
Chapter1
Introduction
The ability to accurately monitor cellular and sub-cellular structures in their native biological environment has enormous potential in addressing open questions in cell biology. In various applications, one of the key steps for understanding biological phenomena is to assess motion of these structures. Investigation and study of the cellular and intracellular mechanisms [71], understanding inflammatory process [28] and wound healing [76] and also scrutiny of drug effects on cancer cells [54] can be counted as some examples from numerous biological applications that can be better understood by analyzing the motion of many different microscopic structures.
Recent developments in time-lapse cell microscopy imaging systems such as elec-tron [16], phase-contrast [126], fluorescence [84] and confocal [82] microscopy imag-ing techniques have had a great impact in the visualization of the these structures behaviour. Total internal reflection fluorescence microscopy (TIRFM) is a recent kind of fluorescence imaging technique that enables visualization of fluorescently tagged sub-cellular structures that are on or close to the plasma membrane of cells [4]. This imaging technique can be powerful tool for studying the intracellular mechanisms such as exocytosis [19].
This thesis is concerned with the problem of automated tracking of sub-cellular structures in TIRFM sequences. Our primary biological motivation is to develop an automated system for tracking the sub-cellular structures involving exocytosis (an intracellular mechanism) which is helpful for studying the possible causes of the defects in diseases such as diabetes and obesity [19]. However, all methods proposed in this thesis are generalized in order to be applicable for a wide range of applications known asparticle tracking1in the biological signal processing community [26].
In this chapter, we start by introducing the biological process of exocytosis and TIRFM imaging in order to explain our research motivation. We then explain our research scope and the thesis technical contribution. At the end of this chapter, we outline the chapters for the rest of this thesis.
1The term of theparticle trackingrefers to the biological applications where the structures appear as similar tiny objects moving through noisy microscopy sequences.
Figure 1.1: Different steps of exocytosis [19].
1.1
Motivation
1.1.1 Exocytosis
Many biological mechanisms such as intracellular trafficking involve the interaction of diverse sub-cellular components moving between different intracellular locations and cellular membrane. Exocytosis is one of the intracellular mechanisms that func-tions to deliver cargo on tubulo-vesicular or granule structures such as secretory vesicles, into or through the plasma membrane. This process involves a number of tightly regulated steps including transport, attachment, and fusion as shown in Fig. 1.1 [19].
§1.1 Motivation 3
are delivered into the plasma membrane. Such molecular trafficking is essential for normal cellular function and defects in these processes have been linked to a variety of pathological states including diabetes and neurodegenerative diseases [19].
One of the most useful techniques for investigating the final stages of vesicle trafficking, particularly trafficking directed to the plasma membrane, is total internal reflection fluorescence microscopy described below.
1.1.2 Total Internal Reflection Fluorescence Microscopy
Total internal reflection fluorescence (TIRF) is an imaging technique that enables the selective excitation of fluorophores in a thin layer very close to the substrate surface inspected.
TIRF uses a light or laser beam, transmitted from a high refractive index transpar-ent medium,νh, and obliquely incident upon a planar interface with lower refractive indexνl at an angle greater than the critical angle of refractionθc. Beyond this angle, the light beam is totally reflected by the interface and an electromagnetic field, also known as evanescent wave, is penetrated into the lower refractive index medium. The intensity of this evanescent field exponentially decays with the distance perpen-dicular to the total internal reflection interface [3]. This penetration depth, so called TIRF zone, can vary between 70−250nm from the interface. This field is able to ex-cite fluorophores located close to the incident surface (Fig. 1.2). Since the excitation of fluorophores is limited to a thin layer, TIRF generates high contrast images with low background fluorescence from out-of-focus planes.
After combining the theory of TIRF with microscope imaging (TIRFM) by Axelrod [3], it became extensively used in many biology applications [37, 53, 72, 86, 104, 107, 117, 118, 124]. One of the most useful applications of TIRFM in cell biology is to visualize sub-cellular structures such as vesicles tagged by fluorescent fusion protein constructs, e.g. green fluorescent protein (GFP), during the intracellular mechanisms such as exocytosis [19, 41, 59]. Fig. 1.2 represents how vesicles in exocytosis events are visualized using this imaging technique.
1.1.3 Need for Automated Tracking
Figure 1.2: A schematic of TIRF microscopy and how vesicles in exocytosis events are visualized using this imaging technique [4, 19].
1.2
Scope and Contributions
Beyond the aforementioned biological motivation, in this thesis we aim to develop a general and reliable automated system for detection and tracking an unknown and time-varying number of tiny sub-cellular structures, known as particles, moving through noisy microscopy sequences including, but not limited to, TIRFM. To this end, we start by developing a method to detect these structures. Then, we will pro-pose several tracking approaches based on Bayesian filtering framework for different conditions.
The main technical contributions of this thesis are:
1. a novel and robust spot detection method to detect similar tiny particles ap-pearing as either bright or dark spots in the microscopy sequences.
§1.3 Summary 5
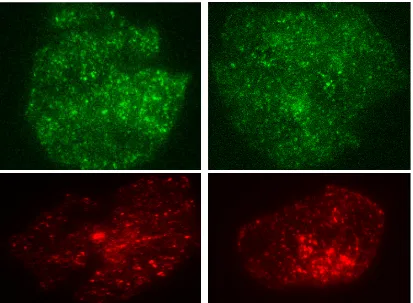
Figure 1.3: Some examples of real TIRFM images captured from different cells.
simulation of the image formation process and accurate measurement and dy-namic models. The sequences generated using this framework allow systematic evaluation of the detection and tracking methods.
3. a reliable multi-target tracking method using a robust Bayesian filter, the Inter-acting Multiple Model Joint Probabilistic Data Association (IMM-JPDA) filter.
4. a general framework for multiple particle tracking in microscopy sequences using a recent Bayesian filter derived based on the random finite set theory.
5. a solution to the problem of tracking multiple particles using a random finite set based Bayesian filter on a challenging biological application where the se-quences characteristics such as noise and background intensity change during the acquisition process.
1.3
Summary
Then, we will focus on the tracking methods proposed based on the Bayesian filter-ing framework. Moreover, the mathematical background for this framework will be given in this chapter.
Chapter 3 describes our proposed spot detection method as the preliminary step for tracking methods. In order to evaluate our detection and tracking methods on realistic synthetic sequences with reliable ground truth, we will propose a simulation framework in Chapter 4.
Chapters 5, 7 and 8 are the main chapters of this thesis which are ascribed to the proposed tracking methods. Chapter 5 describes our multi-target tracking frame-work using the IMM-JPDA filter while Chapters 7 and 8 are devoted to the ap-plication of the recent Bayesian filters based on random finite theory. Before these chapters, we will also provide a brief mathematical background about random finite set theory and its application in multi-target tracking in Chapter 6.
Finally, Chapter 9 concludes the thesis by summarizing the contributions, Pros and Cons, and possible extension of the proposed methods.
Some of the works in this thesis have been already submitted to or published at top-tier medical image analysis conferences and journals.
• Rezatofighi, S. H.; Gould, S.; Vo, B.-T.; Vo, B.-N.; Mele, K.; and Hartley, R., 2015. Multi-target tracking with unknown clutter rate and detection profile: Application to time-lapse cell microscopy sequences. IEEE Trans. Med. Imag., (2015).
• Pitkeathly, W.; Rezatofighi, S.; Rappoport, J.; and Claridge, E., 2013. A frame-work for generating realistic synthetic sequences of dynamic confocal microscopy images. In Proc. Medical Imag. Underst. Anal. (MIUA), 107−112.
• Rezatofighi, S. H.; Gould, S.; Vo, B.-N.; Mele, K.; Hughes, W. E.; and Hartley, R., 2013. A multiple model probability hypothesis density tracker for time-lapse cell microscopy sequences. In Inform. Process. Medical Imag. (IPMI), 110−122.
• Rezatofighi, S. H.; Pitkeathly, W. T. E.; Gould, S.; Hartley, R.; Mele, K.; Hughes, W. E.; and Burchfield, J. G., 2013. A framework for generating realistic synthetic sequences of total internal reflection fluorescence microscopy images. In Proc. IEEE Int. Symp. Biomed. Imag. (ISBI), 157−160.
• Rezatofighi, S. H.; Gould, S.; Hartley, R.; Mele, K.; and Hughes, W. E., 2012. Application of the IMM-JPDA filter to multiple target tracking in total inter-nal reflection fluorescence microscopy images. In Medical Imag. Comput. Computer- Assist. Interv. (MICCAI), 357−364.
Chapter2
Related Work and Background
In this chapter, we will review the methods proposed in literature for tracking cellular and sub-cellular structures in microscopy sequences. Then, by categorizing them into different approaches based on their functionality and applications, we will focus on the tracking methods based on the Bayesian filtering framework. In order to follow the rest of the thesis, we will also provide the mathematical background for this framework in this chapter.
2.1
Related work
Manual scrutiny of many moving microscopic objects over numerous sequences is often a tedious task and suffers from poor accuracy and repeatability. Therefore, automated tracking methods have been extensively used in biological applications in the last decade. These methods are applied for variety of the biological applications on the sequences acquired from different cell microscopy imaging technique such as fluorescence [101], electron [48], phase-contrast [121] and intravital microscopy [74] imaging techniques. They are able to track either a single [21, 28, 94] or multiple microscopic object. Since multi-target tracking is usually more complicated and chal-lenging than tracking a single object, we focus on multi-target tracking approaches in this thesis.
Despite significant technical advances made in automatically tracking moving objects, multiple-target tracking in microscopy sequences remains a challenging task due to the complex nature of biological applications. The microscopy sequences usu-ally contain structures with maneuvering motion patterns and intricate interactions with other structures. Moreover, the structures may enter or disappear from the field of view or be occluded by other objects.
Multi-target tracking methods applied to microscopy sequences can be generally categorized into the cell and particle tracking methods. The cell tracking term is often used for the applications where the body and the shape of cellular structures are clearly distinguishable in sequences [9, 23, 30–32, 48, 54–56, 76, 77, 87, 130]. In these applications, the tracking methods are usually followed by a segmentation algorithm in order to segment the deformable body of the cells. The major difficulties in cell tracking approaches are segmentation of deformable shape of the cells and
simultaneously tracking each individual cell in presence of cellular interactions such as splitting and merging. However, the multi-target tracking step itself is not often a challenging task due to rather limited number of the targets with distinguishable shape and lack of falsely and missed detected objects.
In this thesis, we concern the particle or spot tracking which refers to the appli-cations where the cellular and sub-cellular structures appear as similar tiny objects appearing mostly as bright or dark spots in the microscopy sequences [26]. In multi-ple particle tracking applications, the sequences are usually populated with the hun-dreds of similar tiny objects with maneuvering dynamics while splitting and merg-ing. In addition in some imaging techniques, i.e. fluorescence microscopy imaging, the sequences contain background structures and are contaminated with a high de-gree of noise which complicates the detection of these tiny objects. In contrast to the cell tracking applications, tracking of numerous similar objects in presence of many false alarms and missed detections is the main challenge in the particle tracking ap-plications.
To this end, many particle tracking approaches have been proposed in literature. Some of the most popular particle tracking approaches are methods based on detec-tion followed by a deterministic linking procedure. Here, each particle is separately detected in each frame. Then, a deterministic solution, e.g. an optimization tech-nique, links the corresponding targets between frames [13, 29, 44, 69, 85, 96, 121]. The performance of these algorithms is often sensitive to the detection algorithm and may degrade in the presence of complex target dynamics and highly cluttered detections resulting in very noisy sequences [98].
The Bayesian approaches are another class of tracking algorithms that have be-came popular for particle tracking applications in recent years. These approaches better deal with the aforementioned difficulties by incorporating prior knowledge of object dynamics and measurement models. In these approaches, the posterior den-sity of the targets is either maximized using an optimization technique [9, 57, 102] or estimated recursively using the Bayesian filtering framework. Since the second ap-proach is mainly computationally less expensive than batch estimation based meth-ods, it has become the most popular method for particle tracking applications in the recent years [25, 33, 35, 38, 98, 100, 101, 119, 122, 123].
2.2
Background
In this thesis, we choose the Bayesian filtering framework as the main approach to deal with the multiple particle tracking applications. We provide the mathematical background for this framework in this section.
2.2.1 Bayesian Filtering
§2.2 Background 9
(kinematic) state vector in the state spaceXand the measurement (observation)
vec-tor in the observation space Z at time t, the Bayesian filtering approach is used to
recursively estimate the time evolving posterior distribution pt(xt | z1:t) using the transition density ft|t−1(xt | xt−1), and measurement likelihood gt(zt | xt). In fact,
ft|t−1(xt | xt−1) and gt(zt | xt)express dynamic and measurement models and rep-resent the uncertainty in the following dynamic and measurement equations respec-tively,
xt =Ff,t(xt−1,υt), and
zt =Fg,t(xt,ωt),
whereFf,t(·,·)andFg,t(·,·)are known (possibly non-linear) functions,υt is the pro-cess (dynamic) noise while ωt represents measurement noise. Having prior knowl-edge about the dynamic and measurement models, the posterior pt(xt | z1:t) can be recursively estimated by the Bayesian filtering approach using the following two steps.
1. Prediction step:
pt|t−1(xt |z1:t−1) = !
ft|t−1(xt |xt−1)pt−1(xt−1|z1:t−1)dxt−1, (2.1)
2. Update step:
pt(xt|z1:t)∝ gt(zt|xt)pt|t−1(xt |z1:t−1). (2.2)
The prediction step estimates the state vectorxtat timetby calculating the poste-riorpt|t−1(xt|z1:t−1)using the dynamic model density ft|t−1(xt |xt−1). This posterior is then updated when the measurement zt at time t is available using the measure-ment likelihood gt(zt|xt)and Eq. 2.2.
In the case of linear systems and Gaussian noise, the dynamics and measurement equations can be expressed as
xt =Ftxt−1+υt, and
zt =Htxt+ωt,
where Ft and Ht are respectively the transition and the measurement matrices and the process noise υt and the measurement noise ωt in this case are mutually in-dependent zero-mean Gaussian processes with the covariance matrices Qt and Rt respectively.
1. Prediction step:
µt|t−1=Ftµt−1,
Σt|t−1=FtΣt−1FTt +Qt,
(2.3)
2. Update step:
µt=µt|t−1+Kt
"
zt−Htµt|t−1 #
,
Σt= (I−KtHt)Σt|t−1, (2.4)
whereI is the identity matrix andKtis known as the Kalman gain and is calculated by
Kt=Σt|t−1HTtΣ−S,1t, (2.5)
whereΣS,tis the innovation (or residual) covariance matrix at timet and is given by ΣS,t=HtΣt|t−1HTt +Rt, (2.6)
In the case of non-linear system equations or non-Gaussian noise, there is no a general closed-form solution for the Bayesian recursion and pt(xt |z1:t)has generally non-parametric form. The extended Kalman filter (EKF) [1, 45], and the unscented Kalman filter (UKF) [47] are analytic approximations of the non-linear Bayesian fil-ter. The EKF and UKF filters approximate the posterior density pt(xt | z1:t) by a Gaussian using linearization of the non-linear equations and the unscented trans-form, respectively. Then, they propagate the approximated pt(xt |z1:t)using Kalman recursions.
The particle1 (or sequential Monte Carlo) filtering approach is a general subop-timal solution for the Bayesian estimation in the case of non-linear non-Gaussian system models [40]. This filter uses the sampling approach to represent the non-parametric form the posterior density pt(xt |z1:t). The samples from the distribution are represented by a set of particles; each particle has a weight assigned to it that represents the probability of that particle being sampled from the probability density function. Then, these particles representing the non-parametric form of pt(xt | z1:t) are propagated over time.
In order to apply the Bayesian framework to particle (tiny object) tracking appli-cations, xt includes all kinematic information about a particle such as its position, velocity, intensity and etc. The measurement vector zt contains what can be mea-sured from the microscopy sequences. Based on what is used for the measurement vectorzt, the Bayesian tracking methods are generally divided into two categories as follows.
1. Track-Before-Detect (TBD) techniques: In this approach, there is no explicit detection of the targets. In other words, detection and tracking of the targets
§2.2 Background 11
are performed simultaneously using Bayesian filtering by providing a prior knowledge about the target and background measurement model. In this case, the measurement vectorzt is often the intensity (or any feature extracted from each pixel) of the sequences. The example of this approach for tracking in the microscopy sequences can be found in [28, 38, 76, 98, 100]. In this approach, since the measurement is usually a non-linear function of the state vector, the particle filtering approach which is computationally intensive, is required for the tracking framework.
2. Detection Based techniques: In this approach, a detection technique indepen-dent from the tracking method is first applied on the sequences. In this case, the measurement vectorztis the noisy position (or other measured parameters) of the targets. This approach usually benefits from linearizing of the measurement equation which can be helpful to use the computationally cheaper algorithms such as the Kalman filtering based methods. To propose a practical tracker for densely populated particles with reasonable processing time, we choose this approach in this thesis.
In many biological applications, the cellular structures exhibit maneuvering dy-namics which can be described by multiple simpler dynamic models [25, 33, 35, 100, 123]. The Bayesian filtering framework can incorporate these multiple dynamic mod-els in its formulation using a jump-Markov system explained below.
2.2.2 Bayesian Filtering With Multiple Switching Dynamic Models
The maneuvering and non-linear dynamics can be often characterized by multiple simpler dynamic models. This condition can also be accommodated into Bayesian filtering recursion using a jump Markov system. A jump Markov system (JMS) can be described by a set of state space whose underlying parameters evolve with time according to finite state Markov chain.
Letrt ∈Rdenotes the label of the model in effect at timet, whereR={1, 2,· · · , R} is the model space describing the (discrete) set of all R model labels. Therefore, the
rtcan be assumed as discrete random variable which can be estimated using a Jump Markov system. The idea to estimatert using JMS is to augment the state vector by the index of the model as xt = [xt,rt] ∈ X = X×R, where × denotes a Cartesian product. The integral of an arbitrary functionF defined onXis given by
!
XF(xt)dxt=
R
∑
rt=1 !
XF(xt,rt)dx. (2.7)
The transition density for the augmented state vector is obtained using the fol-lowing factored form:
f
t|t−1(xt |xt−1) = ft|t−1(xt,rt| xt−1,rt−1),
= ft|t−1(xt|xt−1,rt)τf,t|t−1(rt |rt−1),
where ft|t−1(xt | xt−1,rt) is the transition density for the dynamic model rt and
τf,t|t−1(rt |rt−1)is transition probability of the Markov chain from modelrt−1 tort. By substituting the augmented state vectorxt= [xt,rt]and the augmented transi-tion density (Eq. 2.8) into the Bayesian predictransi-tion and update equatransi-tions (Eqs. 2.1- 2.2) and using Eq. 2.7, the Bayesian prediction and update equations for the augmented state vector are obtained as follows.
pt|t−1(xt,rt|z1:t−1) =
∑
rt−1
!
ft|t−1(xt| xt−1,rt)τf,t|t−1(rt |rt−1)pt−1(xt−1,rt−1 |z1:t−1)dxt−1, (2.9)
p
t(xt,rt |zt)∝gt(zt |xt,rt)pt|t−1(xt,rt|z1:t−1). (2.10) Similarly, there is no a closed form solution for the JMS Bayesian recursion in the case of non-linear non-Gaussian models and its practical implementations can be performed using the particle filtering approach [100]. However, in the case of the linear Gaussian models, the interacting multiple model (IMM) filter [12] can be used, which models a maneuvering motion pattern using multiple switching linear dynamics. Further details about this filter will be given in Chapter 5.
2.3
Summary
In this chapter, we reviewed the tracking approaches proposed in literature for time-lapse microscopy sequences. Since cell tracking is out of scope of this thesis, only different types of multiple particle tracking approaches were considered and dis-cussed. We focused on Bayesian filtering approaches and provided its mathematical background and its extension for multiple model dynamics.
Chapter3
Spot Detection
In order to track the sub-cellular structures in microscopy sequences using a detection based tracking approach, the very first stage begins with detection of them in each image of the sequence. These structures usually appears as similar tiny particles and seen as either bright or dark spots occupying few pixels in the image. Moreover, due to limitations in the image acquisition process, the images are often contaminated with a high level of noise. Therefore, the detection of these spots in noisy microscopy sequences is a very challenging task. In this chapter, we propose a method that robustly detects the spots in an inhomogeneous and time-varying background with very low signal-to-noise ratio (SNR).
3.1
Related Work
In the literature, extensive efforts have been made to deal with spot detection in microscopy sequences. The proposed methods can be generally dividend into two categories including supervised (machine learning) and unsupervised methods. Al-though supervised methods may perform better for detecting spots compared to un-supervised methods [99], their superior performance depends on their training step which is subject to having reliable ground truth on the data. However, due to the complexity of real biological sequences, providing reliable manual ground truth is a laborious task which is subject to judgment bias. In addition, supervised methods usually require re-training when the main characteristics of the data change. There-fore, in biological applications, unsupervised detectors with parameters robust to the main characteristics of data are usually preferred.
Unsupervised methods range from relatively simple methods such as local back-ground subtraction [120], to more complicated techniques including top-hat filter [17, 18, 51], the Laplacian of a Gaussian filter [94], Hessian matrix based detection [105], h-dome based detection [29, 100, 101], particle probability refinement filter [123], and wavelet-based multi-scale detectors [35, 75, 128].
In a nice survey work published by Smal et al. [99], the performance of sev-eral state-of-the art spot detectors applied to microscopy images are compared. The methods are tested on synthetic images as well as real images. Of the unsupervised methods, the h-dome based detector (HD) [100, 101] and the multi-scale
stabilizing transform (MSVST) [127, 128] have the best results in both synthetic and real images.
3.1.1 The Multi-Scale Variance-Stabilizing Transform (MSVST)
This approach works on image noise reduction and spot enhancement using a sta-tistical tool, so called variance-stabilizing transform (VST). In this approach, it is assumed that the main sources of noise contaminating many biological microscopy sequences such as fluorescence images are photon noise and the detector electronics noise (readout noise). It can be shown that proper stochastic models for photon and readout noises are Poisson and Gaussian processes, respectively. Therefore, the noise can be appropriately modelled as a Mixed-Poisson-Gaussian (MPG) process [128].
The main technique to deal with Poisson process noise are the variance stabiliz-ing transform (VST) methods. One of most applicable VST methods is generalized Anscombe transform (GAT) which converts a Poisson process to a nearly normal distribution with an asymptotically constant variance [2]. Therefore, it is possible to apply standard denoising methods on the transformed data. The final denoised data is obtained by applying the inversion of this transform on the processed data. Consequently, this technique has been frequently used in the literature for denoising microscopy sequences [15, 127, 128]. Boulanger et al. [15] introduced an adaptive patch-based method using the GAT for reducing the Poisson noise in microscopy images. A better and more general solution for Poisson noise removal was proposed by Zhang et al. [127], where the VST is combined with the filter banks of wavelets, ridgelets and curvelets , so called multi-scale variance stabilizing transform (MSVST). Zheng et al. have also suggested an analytical solution for removing mixed-Poisson-Gaussian noise using the MSVST [128]. Therefore, this approach provides a powerful tool for enhancement and detection of spots in microscopy images.
3.1.2 Theh-dome Transformation
The h-dome transformation, first introduced by Vincent [109], is a technique that cuts off the intensity of each locally maximum object from its maximum intensity by a pre-specified value h (Fig. 3.2). This method uses the gray-scale reconstruction algorithm defined as follows:
H(I,M) =I−R(I,M), (3.1)
where the gray-scale reconstructionR(I,M)is attained by iterating gray-scale geodesic dilations [109] of maskM insideI until stability is achieved. In traditional h-dome transformation, the maskM is chosen as the result of subtracting a constant h from the imageI. More details about this transform can be found in [109].
§3.2 Our Proposed Approach 15
This step chooses all locally maximum structures as candidate objects. Then, it is followed by a sampling procedure and a clustering algorithm for detecting the objects of interest and discriminating them from background structures and noise. In Smal et al. [99], it has been shown that this approach can be used as a reliable spot detector in microscopy sequences.
3.2
Our Proposed Approach
The main problem of the aforementioned MSVST and h-dome detectors is that the performance of these detectors is relatively sensitive to the value of their main pa-rameters, especially in the practical cases where the characteristics of images, such as background intensity and noise level, spatially and temporally changes during acquisition. Our objective in this chapter is to develop a detector which is able to robustly detect the spots in presence of these challenges.
3.2.1 Noise Reduction
The objects of interest (the sub-cellular structures) are often seen as either bright or dark spots which their intensity profile corrupted by high frequency noise and background structures (Fig. 3.1.(a)). For simplicity, we assume that the objects of interest are bright spots. However, the method can be easily applied on dark spots by inverting the image intensity.
The first step to detect the spots is to improve the signal-to-noise ratio (SNR) of the noisy image Iη. To this end, the more sophisticated methods such as VST can be used. However, a simple approach is to smooth the image with a Gaussian kernel. This smoothing acts as a matched filter and enhances the objects as regional peaked domes [101] (Fig. 3.1.(b)). To avoid eliminating small objects, the kernel’s standard deviationσ must be set by the size of the smallest object.
3.2.2 Enhancement
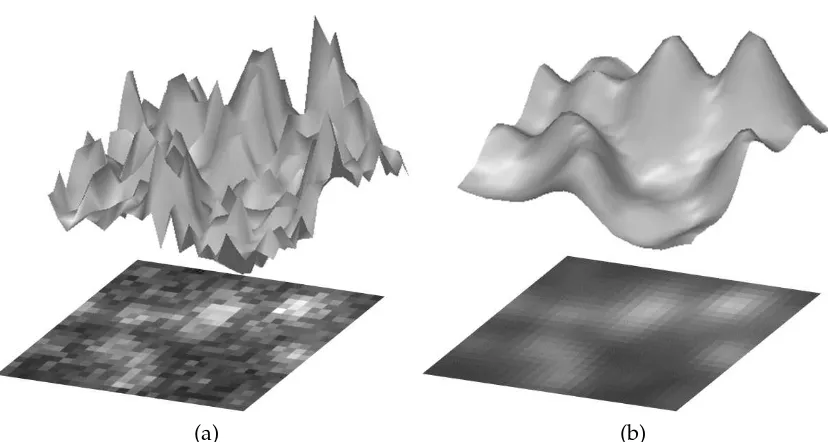
(a) (b)
Figure 3.1: Intensity profiles of (a) the noisy imageIη and (b) the resulting imageIσ after applying a Gaussian kernel with standard deviationσ.
a significant variation in their intensities and are located in a very inhomogeneous background, no value for h can be found such that all objects are enhanced without merging while maintaining enough differentiation from each other.
In all previous methods [29, 100, 101], the appropriate value for the constant h is determined based on trial and error. However, the resulting image still includes many intersecting regions while the maximum intensity of the all objects is approx-imately h [99]. This problem becomes worse especially when the local SNR of the image noticeably changes.
Contrary to all previous methods, our proposed method calculates a height for each locally maximal structure based on its local information and designs an adaptive mask to enhance them appropriately. We will show that the best result using this transform is obtained when all peaks are enhanced with their maximum possible height while intersection between them is avoided. To fulfill this condition, we will show that the height of the designed mask for each peak should be equal to the height of a critical point, namedoptimal point.
To obtain this optimal point for each local maximum xL, first, we use a radial line segment , lS(θ, d), with the length of d starting at xL and heading in the direction defined by angle θ (Fig. 3.3. (a)). The parameter d is set by the user to limit the search area around each regional maximum and should be bigger than the radius of the biggest object of interest.
Within the above search area, the optimal point for a local maximum can be obtained as follows:
§3.2 Our Proposed Approach 17
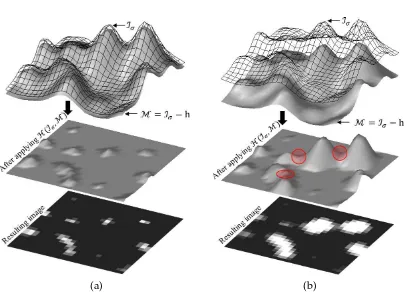
[image:35.595.115.522.104.396.2](a) (b)
Figure 3.2: A 3-D presentation of h-dome transform for a (a) small and (b) large value of the h. Merging area between two peaks is shown with a red circle.
local minimum xθl in the direction θ. Thus, a set of candidate points Lx is obtained for all directions. For 2-D images, we have
Lx={xθl |0≤ θ<2π}. (3.2)
2. Compared to all points which fulfill the first condition, the optimal point, x∗l, has the maximum intensity.
x∗l =argmax x∈Lx
Iσ(x). (3.3)
If the smoothed image Iσ is differentiable for all points in its domain, it can be easily shown that the optimal point for each local maximum is the nearest saddle point to the peak with the highest intensity (Fig. 3.3. (a)). Therefore, using any method which can find the saddle point with the highest intensity for each peak, the adaptive mask can be designed.
(a) (b)
Figure 3.3: A 3-D presentation of (a) a local maximum, its search area and its optimal point, (b) the designed adaptive mask.
Finally, the adaptive maskMa is obtained by making peaks centered at the positions of local maxima with intensity equal toIσ(x∗l(i)) (Fig. 3.3.(b)). Therefore, the spots can be properly enhanced with their maximum possible heights by applying h-dome transform and using the designed mask.
H(Iσ,Ma) =Iσ−R(Iσ,Ma). (3.4)
Moreover, R(Iσ,Ma) would be a reasonable estimation of the image’s background (Fig. 3.4).
Although, the above procedure is presented using 2-D images, it can be general-ized for N-dimensional images. In order to enhance the locally maximum structures in N-D images, the best result using the h-dome transform is obtained by applying the adaptive mask calculated from the optimal points. However, the detection of the optimal points (or equivalently saddle points) for higher dimension space can be computationally demanding1.
3.2.3 Detection
The enhanced image resulting from the explained method, the so called "maximum possible height-dome" (MPHD), includes all maximal structures. Since the spots (the objects of interest) in our application are domes having intensities higher than their local backgrounds, they appear as high peaked structures in the enhanced image. Therefore, it is easy to distinguish them from noise structures, which have small peaks, by thresholding on intensity. To localize the position of each detected spot, intensity-weighted centroids of the enhanced domes are calculated.
§3.3 Experimental Results 19
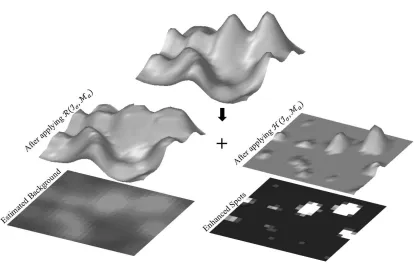
Figure 3.4: A 3-D presentation of maximum possible h-dome (MPHD) enhancement. The MPHD decomposes the smoothed image Iσ into enhanced spots and the
esti-mated background.
3.3
Experimental Results
3.3.1 Evaluation Metrics and Parameters
In order to quantitatively assess the performance of the spot detection algorithms, the same performance measures used in Smal et al. [99] are also reported here. These metrics include the true positive ratio (TPR) and the modified false positive ratio (FPR∗), which are the number of true positive and the number of false posi-tive divided by the number of objects in ground truth, respecposi-tively. True and false detections are defined as follows.
The distance between the center of each detected object and its corresponding position in ground truth was calculated. If this distance is less than a small threshold, dp, it is counted as a true positive, otherwise the detected object is a false positive.
To study the sensitivity of the methods to changes in the value of the main param-eter (or threshold),ℓ, we similarly use free-response receiver operating characteristic
(FROC) curve which plots the TPR value versus FPR∗ value for different threshold values. Moreover, we also measure the values ST =−∂TPR/∂ℓand SF= −∂FPR∗/∂ℓ at ℓ = ℓ∗. The threshold ℓ∗ corresponds to the value for which the FPR∗ = 0.01
The main parameters required for each detector according to [99], include:
1. (NS,ℓF)for the MSVST detector, where NSis the number of wavelet decompo-sition level and 10−ℓF is the FDR parameter.
2. (σL,σM,ℓh)for the HD detector, whereσL is the standard deviation of the spot enhancer kernel, σM is the maximum object size and ℓh is the value of h in h-dome transform.
Our detector also has two parameters (σ,ℓI) including the standard deviation of
smoothing filterσand the threshold value on intensityℓI. The method is insensitive
to the free parameter of the search area, d, as it should be only bigger than the radius of the biggest object of interest. The parameter ℓ(·) for each detector is assumed as
the main threshold value which is used for generating FROC curve and studying the sensitivity of the methods to this value.
3.3.2 Evaluation on Synthetic Data
The performance of the aforementioned detection methods including our proposed MPHD detector, was first evaluated using the same synthetic data (with ground truth) used in [99]. In this data, two types of object (round or elongated) are mod-elled. Each type of object is placed randomly in the images with different types of background including uniform background (type A), gradient background (type B), and non-uniform background (type C). In every experiment, 16 synthetic images (each containing 256 objects) with a very high level of Poisson noise (SNR=2) were used (Fig. 3.5). Throughout this thesis, the SNR value is used for representing the level of noise and is calculated using definition of Smal et al. [99] which is the dif-ference in intensity between the object and the background, divided by the standard deviation of the object noise 2. In this section, the value of d
p for calculation of true and false positives is chosen to be 4 pixels which is the exactly same as the value reported in [99].
Fig. 3.6 represents FROC curves of the MPHD method for the synthetic images with SNR= 2. The FROC curves3 are generated by changing the value of threshold
ℓI. In Table 3.1, the performance of the spot detectors at ℓ = ℓ∗ are compared
us-ing aforementioned evaluation metrics. Moreover, the average CPU processus-ing time required for the detection of the objects in a single frame of the synthetic is also reported in this table.
By referring to Table 3.1 and Fig. 3.6, it can be inferred that the performance of detection for the proposed method in all types of synthetic images is comparable to the other two methods. Moreover, one of main advantages of this method is to have significantly low sensitivity to changes in threshold value as the performance measures ST and SF are noticeably lower. Considering processing time, there is no noticeable difference between different the detectors. However, the MSVST performs slightly faster in this experiment.
2In Chapter 4, we will be more precise about this definition and its equation.
§3.3 Experimental Results 21
Figure 3.5: Examples of different types of synthetic images at SNR= 2 and their enhancement results after applying the MPHD method usingσ =2.
3.3.3 Evaluation on Real Data
The described detection methods were also tested on real TIRFM sequences (Figs. 3.7 and 3.9). In order to prepare ground truth labels, an independent expert manually annotated all visible structures visible in real TIRFM sequences (21752 spots) using the freely available software tool MTrackJ [70]. The detected points were double-checked by another biologist expert to maximize the reliability of the ground truth.
In addition to the threshold ℓ = ℓ∗, we define a new threshold value ℓ = ℓ∗∗ for
which the TPR = 0.8 (only 80% true positives). This value is hereafter considered in this thesis in addition to what reported in [99]. Because, we would like assess the performance of the detectors when the most of the targets are detected. In order to use the detections for tracking algorithms, the main concern is to detect more objects. Because the tracking algorithms can often deal with the false detections while requiring more detection rate for the reliable tracking results. Therefore, we also reported FPR∗, ST =−∂TPR/∂ℓand SF =−∂FPR∗/∂ℓatℓ=ℓ∗∗. Since the spots in the real sequences are dense and close to each other, we choose dp =1.5 pixels in this experiment.
−2.4 −2 −1.6 −1.2 −0.8 0.75 0.8 0.85 0.9 0.95 1 log 10(FPR*)
TPR Type A
Type B Type C FPR*=10−2 TPR=0.8
−2.6 −2.2 −1.8 −1.4 −1 0.75 0.8 0.85 0.9 0.95 1 log 10(FPR*)
TPR Type A
Type B Type C FPR*=10−2 TPR=0.8
Figure 3.6: FROC curves for the MPHD detector for the synthetic images at SNR=2 in the case of round (left) and elongated (right) objects for varying threshold.
are well-distant from each other and are located in simple background structures. Therefore, the performance of the detection methods cannot be properly evaluated using this synthetic data.
The values of ST and SF in Table 3.2 confirm our claim about low sensitivity of the MPHD detector to changes in the value of the threshold.
To compare the processing time of the detectors, the MSVST detector requires noticeably less time than the other two detectors. However, this significant difference is mainly because of applying one level wavelet decomposition (NS = 1) as the optimal parameter on our real data. Note that the MSVST processing time is sensitive to the number of wavelet decomposition. Since the main computation burden in the MPHD method is for the enhancement step, the threshold value, ℓI, has almost no
effect on the processing time.
3.4
Summary
In this chapter, we proposed a new spot detection method using a new approach to the h-dome transform. We showed that the designation of an adaptive mask using the intensity of the optimal points can properly enhance the dome shape structures. To show the efficiency of our proposed scheme, we compared the result of our de-tector against two state-of-the art methods, HD and MSVST, in both synthetic and real sequences. The results demonstrated that our detector can perform as well as other detectors on synthetic images while working better on real sequences where SNR is spatio-temporally varying. Moreover, according to the experimental results, the MPHD method seems to be more robust in the changes in the threshold value compared to two other detectors.
§3.4 Summary 23
(a) (b)
[image:41.595.99.539.187.609.2](c) (d)
Figure 3.7: (a) A real TIRFM image, (b) its enhanced spots (b) its estimated back-ground and (d) its detection result after applying the MPHD method. The intensity
Methods Image Round Objects Elongated Objects Time
Type TPR ST SF TPR ST SF (Sec.)
A .99 .00 .01 .99 .00 .03
MSVST B .99 .00 .02 .99 .00 .02 .70
C .93 .03 .01 .96 .02 .01
A .99 .11 .05 .99 .01 .09
HD B .97 .22 .05 .99 .01 .09 .73
C .90 .21 .05 .97 .16 .05
A .99 .00 .00 .99 .00 .00
MPHD B .97 .01 .00 .99 .00 .00 .80
C .94 .01 .00 .95 .00 .00
Table 3.1: Performance comparison of the MSVST, HD, and MPHD detectors using the synthetic images with SNR= 2 and the parameters, dp = 4, NS = 3, σL = 2.5,
σM = 6 and σ = 2. True positive rate (TPR) and the values ST = −∂TPR/∂ℓ and SF=−∂FPR∗/∂ℓat thresholdℓ=ℓ∗ are reported here.
Methods ℓ=ℓ∗ ℓ=ℓ∗∗ Time (ms)
TPR ST SF FPR∗ ST SF ℓ∗−ℓ∗∗
MSVST .23 .02 .00 .39 .15 .48 9.0−14.3
HD .41 .74 .06 .44 .92 2.46 47.4−94.9
MPHD .50 .00 .00 .32 .00 .03 45.7−48.4
Table 3.2: Performance comparison of the MSVST, HD, and MPHD detectors at thresholdsℓ =ℓ∗andℓ= ℓ∗∗using the real sequences with the parameters, dp=1.5,
NS=1, σL =1.0,σM =4 andσ=1.3.
chapters. Therefore, the MPHD method is used as the preferred detector throughout this thesis.
In the cases where spots are too close to each other, most spot detection algo-rithms usually fail to detect the spots correctly. In this situation, the MPHD method similarly cannot perform well and enhances the spots as very small peaks. Thus, they may not be detected after intensity thresholding. This can be counted as the main weakness of this approach. However in Chapter 4, we will show how to suppress this error for moving objects using simple temporal averaging which improves the background estimation.
§3.4 Summary 25
−3 −2.5 −2 −1.5 −1 −0.5
0 0.2 0.4 0.6 0.8 1
log10(FPR*)
TPR
[image:43.595.196.444.309.511.2]MPHD HD MSVST FPR*=10−2 TPR=0.8
(a) (b)
[image:44.595.75.484.186.613.2](c) (d)
Figure 3.9: (a) A real TIRFM image and the enhancement results using the MPHD (b), MSVST (c), and HD methods. The intensity of the images is inverted for better
Chapter4
A Framework for Generating
Realistic Synthetic Data
Manual annotation of hundreds of moving sub-cellular structures over numerous noisy sequences of fluorescence microscopy is painstakingly slow and suffers from poor accuracy and repeatability. As such it is difficult to provide reliable ground truth for evaluation purposes. To this end, many spot detection and tracking meth-ods proposed in literature are evaluated using synthetic data with known ground truth [25, 33, 35, 57, 69, 96, 98–100, 122, 123, 128]. However, differences between real and synthetic images may lead to inaccurate conclusions about the performance of an algorithm. In this chapter, we present a framework for generating realistic synthetic fluorescence microscopy sequences through simulation of the image formation pro-cess and accurate measurement and dynamic models. The sequences generated using this framework appropriately reflect the complexities existing in real sequences. We believe that the sequences are an apt evaluator for detection and tracking methods1.
4.1
Related Work
In many previous works [25, 33, 35, 38, 57, 69, 96, 122, 123], simple assumptions have been used in generating synthetic fluorescence data such as sequences with con-stant signal-to-noise ratio (SNR) and without background structures, and particles with fixed and similar shapes which their intensity distribution is modelled based on Gaussian point spread function (PSF). Although these assumptions may ease the procedure for generation of synthetic data, they do not reflect the complexities ex-isting in real sequences. In general, real fluorescence microscopy sequences contain numerous spots with different sizes moving through spatio-temporally varying back-ground and SNR.
Although, the level of noise (SNR) may challenge the spot detection and tracking algorithms [26, 99], this is not the only difficulty that these algorithms may confront in real data. For example, many detection algorithms fail in presence of background structures [99]. Moreover, the robustness of the methods to the size and shape of
1The code and the generated sequences are available at my personal website.
particles cannot be appropriately assessed using the synthetic sequences containing similar objects.
Some effort has been recently made to improve the models. For example, the background structures are simulated using a simple procedure in Smal et al. [99]. However, this simulation can not properly mimic the real background of fluores-cence microscopy images. In recent work, a simulation framework was proposed by Boulanger et al. [14] to generate more realistic sequences. In their approach, a statistical scheme is suggested for modelling the time-varying background estimated from real sequences. However, it requires a pre-assumed model such as linear, expo-nential or bi-expoexpo-nential on intensity model of the background.
Lack of a well principled framework along with demanding need from the com-munity for generating realistic synthetic sequences of fluorescence microscopy moti-vate us to work on a more general and reliable simulation framework2.
4.2
Our Proposed Framework
To generate realistic synthetic data, we propose an improved dynamic and measure-ment model of total internal reflection fluorescence microscopy (TIRFM) sequences as described below.
4.2.1 TIRFM Principle
As we discussed in Chapter 1, TIRFM uses an evanescent field to exclusively illumi-nate the sample within a few hundred nanometers from the imaging surface [3]. In cell biology studies the evanescent field is produced at the surface of a glass cover-slip on which cells reside in some aqueous medium. The field behaves as a sheet of light whose intensity decays exponentially with distance from the imaging surface defined by IE(z) =IE(0)e−z/ζ, where IE(z) is the intensity of the field at distance z, IE(0)is the intensity of the field at its origin, z=0, andζ is the decay constant.
4.2.2 Intensity and Shape Model
Real TIRFM sequences generally contain hundreds of dynamic sub-cellular struc-tures which appear as bright spot like objects,O, superimposed onto a spatially and temporally varying background B. Noting this fact that the background is additive to the sequences [98, 99], the noise-free intensity of the sequencesI observed at time
t and at point (pixel) x= (xx, xy)can be modelled using the following equation.
I(x,t) =B(x,t) +O(x,t), (4.1)
§4.2 Our Proposed Framework 29
For TIRFM, the object intensity model observed at pixel x and at time t can be mathematically defined as
O(x,t) =
Nt
∑
i=1 IO(zit)
$
O(x; xit,Σit)!Ps(z=zit) %
(4.2)
where Nt is number of objects at time t, ! denotes the convolution of an image including the region occupied by an object, O, with the three-dimensional point spread function (PSF), Ps, of the objective lens at the object’s depth zit. xit= (xix,t, xiy,t) is the position of each objectiat timetandΣi
tis a shape matrix which can be different for each object and evolves over the time with the state of the object. IO(·) is the intensity of fluorescence of the object which is proportional to IE(·)and is obtained by the similar decaying exponential equation defined above as IO(z) =IO(0)e−z/ζ.
In real sequences, it has been observed that sub-cellular structures become elon-gated in the same direction of their motion due to various biophysical factors. This phenomenon is observable in dynamic vesicles as they are seen as elongatedcometor
tear dropshaped objects when they move (Fig. 4.1) [36, 108]. To improve the particle model, we propose an evolving procedure for the shape matrix based on the state of the object. In order to generate different shapes such as circle, ellipse and tear drop using a model, the shapes of objects are constructed in a piecewise manner using two half ellipses with different shape matrices which can be evolved based on their dynamics (Fig. 4.1).
Suppose E(x; b,Σ) = &x|(x−b)TΣ−1(x−b)"1' represents an ellipsoid vol-ume (elliptical surface in 2D case) and S(x; b, a) = &x|aT(x−b)#0'represents a half space. Then O can be obtained by combining two half ellipses as follows.
O(x; xit,Σit) =E(x; xit,Σit,1)∩S(x; xit, aθ)∪E(x; xit,Σit,2)∩S(x; xit,−aθ) (4.3)
where
aθ = (
cosθi t sinθit
)
, tanθit= ˙x
i y,t ˙xi
x,t
, (4.4)
and
Σit,k =$Θit%TΓit,kΘit, k =1, 2. (4.5) ParametersΘk
t andΓkt are the rotation and axes matrices respectively and calculated as
Θi t =
(
cosθi
t sinθti
−sinθti cosθit )
,
Γit,1=
( (σi
x)2 0
0 (σi
y)2Fy(∥˙xit∥) )
,
Γit,2=
(
(σi
x)2Fx(∥˙xit∥) 0
0 (σi
y)2Fy(∥˙xit∥) )
.
(4.6)
!
!
(a) (b)
Figure 4.1: The proposed evolving shape procedure of a sub-cellular object (a) before any motion and (b) after movement in directionθt.
The ˙xit = (˙xix,t, ˙xiy,t)T is the velocity element of each object at frame t. The Fx(.)and Fy(.)are deformation functions which distort the shape based on the magnitude of velocity ∥˙x∥. To keep the rate of change of axes constant, the Fy(.) should be equal to F−1
x (.). Moreover, the function must fulfill the constraint Fx(0) = Fy(0) = 1. The form of this function is different for each biological application and depends on many biophysical factors such as viscosity, elasticity and osmotic pressure of the membrane of the structures [36, 108]. In this thesis, we simplify this complexity and approximate it by a quadratic exponential function as the follows.
Fx(∥˙xit∥) =exp *
(˙xix,t)2+ (˙xi y,t)2
ς2
+
, (4.7)
The parameterςsummarizes all biophysical factors in a value and controls the effect of the velocity on this deformation.
4.2.3 Point Spread Function
Although a Gaussian model is a good approximation of the point spread function for different fluorescence microscopy techniques [105, 129], it cannot preserve the out of focus effect that exists in real TIRFM sequences. This effect is observable in real TIRFM for bright particles relatively distant from the evanescent field origin, but are not present in the signal Gaussian function approximation for a PSF. In our framework, the point spread function is modelled using an analytical expression for the diffraction pattern of light through a pupil with a perfect aberration-free lens [20].
Ps(z) = , , ,2
-1
0 P(ϱ)J0(ϱv)exp(juϱ2/2)ϱdϱ , , , 2
u=2πNA2z/λw, v=2πNAra/λw (4.8)
where P(ϱ) is a pupil function with an aperture radius Ra, J0(.) is a first order Bessel function, ϱ = ra/Ra, ra =
.
![Figure 1.1: Different steps of exocytosis [19].](https://thumb-us.123doks.com/thumbv2/123dok_us/1819278.137532/20.595.87.458.128.425/figure-different-steps-of-exocytosis.webp)
![Figure 1.2: A schematic of TIRF microscopy and how vesicles in exocytosis eventsare visualized using this imaging technique [4, 19].](https://thumb-us.123doks.com/thumbv2/123dok_us/1819278.137532/22.595.75.494.99.483/figure-schematic-microscopy-vesicles-exocytosis-eventsare-visualized-technique.webp)