Abstract: Wireless Sensor Networks is a real time system that is used in communication system. The WSN consists of nodes with the insufficient power to collect the important information from the field. So many researchers use a different algorithm to prolong the network lifetime they are DEFL, MTE, MDR. In this work we have proposed an Artificial Bee Colony algorithm. This is an energy efficient algorithm and consumes energy with balancing to increase the network lifetime with optimal path and reduce a packet loss. Algorithm quickly identifies the shortest path on each node. It is optimizing the routing paths and provide a successful multipath data transmission.
Index Terms:Artificial Bee Colony, Distributed Energy Fuzzy Logic, Minimum Total Energy, Minimum Drain Rate.
I. INTRODUCTION
Wireless Sensor Network (WSN) technology started in the year of 1998 and it has been attracting more attention and the international involvement and the resource constrained sensor nodes have been much smaller in size. Fig.1 shows the basic structure of WSN Wireless sensor network is stated as a network of devices that can communicate the information gathered from a monitored field through wireless links. Wireless sensor networks are called wireless sensor and actuator networks. It is spatially distributed sensors to monitor physical or environmental conditions, such as temperature, sound etc. The WSN is built a node each node is connected to one or several sensors. The sink or base station act like an interface between users and network. The required information from the network by injecting queries and gathering results from the sink.
The sensor nodes that can be in communication among themselves by using a radio signal. Wireless sensor node is sensing with radio transceivers, computing devices and power components. Each individual node in the wireless sensor network have a limited processing speed, communication bandwidth and storage capacity for an available resource. In WSN clustering is one of the important methods used to
Revised Manuscript Received on June 13, 2019
S. Rizwana, PG Scholar, Department of Electronics and
Communication Engineering, School of Engineering and Technology, JAIN (Deemed-to-be University), Bangalore, Karnataka, India
Gayathri. K M, Department of Electronics and Communication Engineering, School of Engineering Technology, JAIN (Deemed-to-be-University), Bengaluru, Karnataka, India
Thangadurai N*, Department of Electronics and Communication Engineering, School of Engineering Technology, JAIN (Deemed-to-be-University), Bengaluru, Karnataka, India
.
achieve better network lifetime. It includes a grouping of sensor nodes into small clusters and selecting cluster heads for all the small clusters. Cluster Head (CH) gather the information from each cluster nodes and forward the information to the base station. Each node in a sensor network is provided with a wireless communications device called as radio transceiver and a battery as an energy source. The cost of sensor nodes is varied from hundreds of dollars, based on the size of the sensor network and individual sensor nodes complexity. WSN consist of various types of sensor nodes. The sensor node is used basically to reduce cost, provide fault tolerance, increase flexibility and also to improve development process and conserve energy. There are two types of sensor networks, namely 1) flat architecture which constitute a homogeneous network 2) hierarchical architecture where all nodes do not have the same roles but shared with common resources [1-2].
The base station is used for the mobile telephone, wireless networking and communications and also for land surveying. Mobile telephony furnishes the connection between mobile phones and the bigger telephone network. The network node as a transceiver and also acts as a router for other nodes in the network and connecting them to a LAN or to the internet. The topology of WSN is referred to the nodes that are arranged within a network. Wireless Sensor Networks consist of sensors that are coordinated. The basic principle of topology of WSN are the same for any other network.
Fig.1 Wireless Sensor Network [15]
The topology of WSN includes various topologies such as Star topology, Mesh topology, Tree topology and so on. In star topology all nodes are connected directly to the gateway. An individual gateway can transmit and receive information to a number of remote nodes. The Mesh topology allow the transmission of message from one node to another node which is within its radio
transmission range. Tree topology is also called as a cascaded star topology. In
Fuzzy Logic Based Routing Algorithm for
Wireless Sensor Networks to Enhance the
Network Lifetime
tree topology each individual node linked to a node and that is placed higher in the tree and then finally to gateway. The sensor node has a limited amount of processing and it is collection of information of the other nodes. They have an ability to measure a physical environment and the task with complex function is executed in the described network [3-4].
A collection of such sensor nodes is coordinate with each other to execute a specific action. The sensor node is fit in to a processing ability to search a simple computation and transmit only a necessary data. These features will allow the sensor networks to be useful in many applications such as military, security and environment. The heterogeneous network consists of many sensor nodes with the different energy, communication range and the sensing range and each sensor nodes are battery powered in an energy. The energy is the most important one because the battery present in the sensor node cannot be replaced. To extend the lifetime of the WSN based on shortest routing path and the sensor nodes create an energy hole in a routing path then this is created by a hop’s operation [5].
The network must be able to operate under the changing environment. The nodes are booted up and the network is formed to maintain the steady state of the operation. Sink node is having the large transmission range compare to the other nodes and be an active node as information sink to extract the information from a sensor network. Nodes are expecting to operate then adjust to changing environments should be applicable in the large areas. In wireless sensor networks, routing protocols is done in different levels of network arrangement. The routes are created in between a pair of nodes so that information can be routed. The change in network topology will update the node information and the information through the network is passed. It also maintains a consistent path and up-to-date routing information about the whole network [6].
II. LITERATURE SURVEY
Jasvir Kaur, Sukhchandan Randhawa, 2018 [7], “A novel Energy Efficient Cluster Head Selection Method for Wireless Sensor Networks”, The group of sensor nodes is used to sense the information from the event of the area and it is passes to the base station which reacts to the environment. The number of cluster is based on the routing protocols in a region and it is divided into a number of clusters within the each cluster and a cluster head is elected based on the some parameter and novel selection method for a cluster head having the efficiency in energy and it is based on Flower Pollination Algorithm this is proposed in this paper. The performance of a proposed is being analysed and it is compared protocols like Leach, C-Leach and K-Means in terms of energy efficiency and FPA is smoother than the other two protocols and it is not sustain in traffic rate.
K. Johny Elma, S. Meenakshi, 2018 [8], “Energy Efficient Clustering for Lifetime Maximization and Routing in WSN”, The sensors are grouping into clusters by the energy efficient of the heterogeneous clustering is that select the cluster head from cluster and the cluster head is nominated with the nodes of the energy. Connectivity is considered as a measure of Quality of the Service and compare the EHC and route
identification technique with the Greedy Perimeter Stateless Routing. It is not reducing the energy and packet losses occur.
Reem Aldaihani and Hosam AboEl Fotoh, 2015 [9], “A new scheme for maximizing the lifetime of heterogeneous wireless sensor networks”, In the proposed work the author has used two types of sensor nodes that are reduced function device and full function device. Full function device are expensive sensor nodes with respect to power and computational capability when compared to reduced function device which are less cost with the limited power supply. This is balancing the network and reduce the communication load on reduced function device to reduce the delay and to increase the connectivity and lifetime by using the limited number of full function device. Power Efficient Gathering in Sensor Information Systems is a chain-based protocol and the related model in lifetime except is the Chain1 model the lifetime of Chiron model is better than the Chain1.
Gaurav S. Wagh, Rajesh S. Bansode, 2016 [10] “Design Analyse and Implement Wireless Sensor Network Performance using Energy Balance Routing Protocol”, The data packet is correctly send to the destination and it is used to improve the hybrid method based on the multi path data sending. The drawback of GSTEB EGSTEB protocol is difficult to distribute a load evenly on all nodes in the tree structure and an overhead in base station and it builds a routing tree using a process for each round in the land Station to assigns a root node in the broadcast’s selection to all the sensor nodes. The node selects its parent by considering it as own information and its neighbor information.
III.TOOL DESCRIPTION
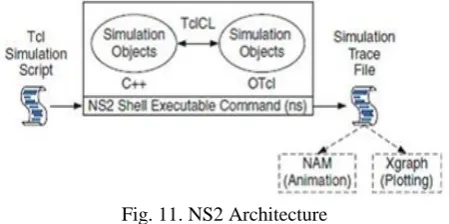
[image:2.595.314.539.556.668.2]NS2 is abbreviated as a Network Simulator Version 2 and it is an open event driven simulator is designed specifically for a research in communication networks and it consists of two key languages, they are C++ and Object-oriented Tool Command Language. The C++ is defining the internal mechanism that is backend of the simulation objects and the OTcl sets up simulation is done by assembling and configuring the object in scheduling discrete events. The basic architecture of NS 2 is shown in Fig. 11.
Fig. 11. NS2 Architecture
OTcl are linked together using the TclC and C++ implementation for the efficiency in the simulation of the detailed in the definition and the operation of the protocols. OTcl script is description of the topology, protocols and the application and Specification of the output form then TclCL is a Tcl with classes After the
results is graphically and interactively with the tools such as Network Animator and X Graph are used. The result of the simulations is an output trace file that is used to calculate delay, throughput etc to visualize the simulation with the program called Network Animator and it is a very good visualization tool that can visualizes the packets as they are propagate through the network. VMware Workstation is a virtual machine software that is used for that runs on x64versions of the Windows and Linux operating systems to run a multiple operating system over the single physical host computer and it is strongly supports the hardware compatibility of works in a bridge between the host and the virtual machine for all kinds of the hardware resources including the hard disks etc
IV. DISTRIBUTED ENERGY FUZZY LOGIC
Distributed Energy Fuzzy Logic (DEFL) is based on the shortest path routing algorithm with the low cost. The strategy permits the distributed implementation of every node gathered only the regional message to make self-sustaining routing decision. It drastically reduces a communication cost. DEFL algorithm assigns cost values based on energy in the network links and it make use of the shortest path algorithms to find the minimum route total path cost from source to the destination. The performance of network lifetime of nodes in DEFL algorithm is compared with other algorithm such as MTE, MDR and FA. Energy efficiency is based on the minimum energy consumption of each individual node in sensor network and it does not consider the even a distribution of energy consumption across the sensors network. In short range communication, single hop communication is not supported to achieve an energy efficiency.
A self-organizing Low Energy Adaptive Clustering Hierarch (LEACH) algorithm is used for adaptive protocol-based clustering. It uses a randomized rotation of cluster heads to evenly share the energy load among all the sensor nodes in the network. It is considered as one of the first hierarchical routing algorithms used on cluster-based network. The basic idea in this LEACH algorithm is to form clusters of nodes in sensor network based on the strength of received signal and it also uses a regional cluster heads as a router to pass the data to the base station.
For distance vector routing, Destination Sequenced Distance Vector (DSDV) is a proactive protocol. A routing table with upcoming hop and total number of hops for all possible nodes is maintained for each network. The routing table is updated at any time by broadcasting periodic updates. The number of jumps to reach the destination node and the sequence number are assigned by the destination node. There are two kinds of update packages namely full dump package which contains all the information and smaller package which contains only the message that has changed since the last full dump [11-12].
Fuzzy logic has a potential to deal with the conflict situation and due to nonlinearity of the data it uses the heuristic human reasoning without any need of complex
mathematical models. Because of many advantages of fuzzy logic, it is widely used various fields.
Many routing algorithms requires only fuzzy logic and simple decision-making circuit. In dynamic networks, to increase the network lifetime distributed energy-aware cost function-based routing algorithm uses a fuzzy logic approach. To design an energy related cost function, it provides a generic framework. Algorithm includes rate of energy consumption and energy remaining in the node with metrics in a cost function.
Energy consumption rate is a combination of an energy drain rate and transmission energy. Fuzzy set is used to described the input and the output of fuzzy variable is characterized by the membership function.
The membership function is representing a degree of the belonging of each crisp input to fuzzy set. It is providing the plotting of each input value to membership value 0, 1 where the membership value is close to the 1 indicate that input value belongs to fuzzy set with the high degree. The certain part of network become disconnected because it is an unwanted in WSNs and especially it gathers information from all nodes of network to data destination. The lifetime of sensor network is a core parameter when it is estimating the performance of routing protocol. The minimum cost energy aware routing protocol is a DEFL algorithm which assigns an energy related cost to values in the sensor network and then using a shortest path algorithm to find the set of minimum routes cost from source to destination Fig. 2 shows the flow chart of DEFL algorithm [13-14].
The energy related input is updated adaptively using assigned link cost values. The key inputs to estimate the node lifetime is the instantaneous energy levels and the energy consumption rates. The energy level provides the direct information of a current energy status of the node and the energy consumption rate provides a movement of energy status which is influenced by node operation including sensing, traffic generation etc.
Mapping mechanism can be utilized to map multiple inputs to a single cost value. Fuzzy logic with mapping mechanism can be used to compute the cost instead of using a crisp value directly. Fuzzy logic can be easily unifying the units of different inputs.
It has an ability to deal with the complex inputs and the design also includes human logic which gives a more rational decision making. It is the distributed algorithm. Each node uses a regional network from one neighbor hop to make an independent routing decision. It is adaptive to the network situations and the link cost values are estimated and assigned to reflect a spatial and temporal variation in the network node operations and traffic conditions. The disadvantage is this is not suitable for low power and more energy consumption.
fuzzification is insert the logic 0 or 1. The rule evaluation is used to initialize a node creation and fuzzy rule base that is loop creation and defuzzification is an output.
Fuzzy Input Values
Neighbour
Finding Distance Energy
Data transmission
Fuzzification
Rule Evaluvation
De-Fuzzification
Intial Member Of Node Creation
Fuzzy Rule Base
Fig.2 Distributed Energy Fuzzy Logic
The Minimum Total Energy (MTE) is an algorithm to minimize a total energy consumed to reach the destination. The traffic is routed through a less energy route then the network nodes on a route it will deplete the energy rapidly because the network partition for other nodes have huge energy. Minimum Total Energy does not consider a remaining energy of the node and it cannot effective to extend the network lifetime. It initializes a node, energy, and position update. Then create the node moving direction and collision avoidance in this error not occur means directly transmit data from source to destination. Fig. 3 Shows the flow chart of MTE algorithm.
The Minimum Drain Rate (MDR) is a mechanism with the remaining energy for the node to anticipate the lifetime according to the present traffic condition. It is based only on the residual energy which cannot be used to connect the route. The node exhausting its energy very quickly and it die and the traffic load characteristics is required for the efficient cost function. MDR is not suitable for the total transmission energy with the minimized to chosen route. It is based on link cost and the cost is consider as a how much energy consumption and create a network load, minimum drain rate and link availability. Then create the mobility and collected the link cost information and then select the optimal path. Fig. 4 depicts the flow chart of MDR algorithm.
Flow augmentation is also same as DEFL, MDR, MTE algorithm. Shortest path strategy algorithm is used for maximizing the network lifetime based on the link costs that reflect in communication energy and a remaining energy level. In route selection process, this algorithm does not consider a node traffic load.
Fig.3 Minimum Total Energy
Link Cost
1.Network load
2.Link Availability
Mobile Agent
Collecting Information related to above link cost
Optimal Path Selection
V. RESULT & DISCUSSION
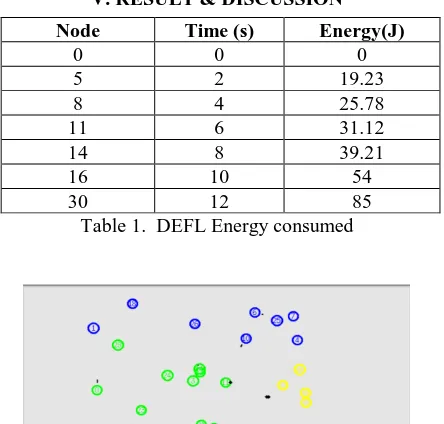
[image:5.595.60.282.69.281.2]Table 1. DEFL Energy consumed
Fig.5. NAM Window
Fig. 5 shows the NAM window, where the nodes are shown for the existing system. In NAM window 30 nodes are created and give a traffic agent, data transmission etc. Then the packet is transmitting from one to another node and packet loss is occur.
[image:5.595.70.269.209.324.2]The traffic rate for node 5 and 6 is compared with DEFL, MDR, MTE algorithm which is shown in Fig. 6. In that graph DEFL is dissipated 8.4 joules of energy and for every node start energy is 10 joules for 2 nodes this much of energy is dissipated then the losses is occurred from node 5 to 6 at the traffic rate to send a 50 packet and MTE, MDR, FA is dissipated the 9 joules and above then more losses occur.
Fig.6. Traffic Rate Node at 5 and 6
Energy consumed is use as a total amount of energy in the network the existing system DEFL algorithm consumed 83 percentage of energy at 12 seconds and the MTE, MDR, FA algorithm consumed above 90 percentage of energy at 12 seconds which can be seen in the Fig.7.
Fig.7. Energy consumption
In that terminal window shows the total amount of energy used and the remaining. The centroid position is also to create for the 30 node and the size of the sensor node is changed.
[image:5.595.310.545.359.514.2]Table 1 shows the time and energy consumed by the few nodes by using DEFL algorithm. For node 5 is the time and energy used is 2 seconds and 19.23 percentage respectively. And same came be seen for another node like 8, 11, 14,16 and 30 in Table1. Fig. 8 shows the terminal window and where we can observe the overall energy consumed by the DEFL algorithm is 83.01 Joules and the remaining energy is 16.98 Joules for DEFL algorithm.
Fig.8. Terminal Window
VI. PROPOSED METHOD
The Artificial Bee Colony is an optimization algorithm that is complete analogy of the shortest path and it is consisting of individuals with the different temporary technics to represent the distributed adaptive system of the smart control energy. The operate mutually and efficiently of the releasing message about the discovered paths to determine the quality at specified nodes similarities between behaviours in the insect societies and the network routing is the last decade and many routing protocols is used in that ABC is have expanded for wireless networks, satellite networks and WSNs and the benefit is increased the flexibility to adapt and changing the environments and this is design for a optimization algorithm for the dynamic and for multi objective work. The bee members are utilizing the communication protocol with the end-to-end for the bee to group. ABC algorithm have a 3 bee groups in the colony they are onlooker, scout, and employed bee and each bee represent
the position.
Node Time (s) Energy(J)
0 0 0
5 2 19.23
8 4 25.78
11 6 31.12
14 8 39.21
16 10 54
[image:5.595.56.282.500.657.2]The ABC algorithm employ the populations of the bees to identify the optimal path and the bee is waiting means they are choosing a food source is an onlooker and a bee are randomly searching is the scout and the bee is going to the previously visited food source is the employed bee. The bee is denoted as node and the food source is a base station. The positions of the food sources are representing the possible solutions to the optimized the problem and corresponds to the quality of the associated solution. Worker bees are typically engaging in the other hive maintenance duties when they are middle aged with the switch for a foraging about three weeks old, to the colony and constantly leave the hive searching for the new sources. The ABC flow chart is shown in Fig. 9.
START
INITIALIZE THE NODE
NEXT ROUND SEARCH AROUND
THE INITIAL POSITION
CALCULATE THE FITNESS VALUE
UPDA TE
GREATER GROUP
FORMATION
FIND NEW POSITION
CALCULATE PROBILITY LOWER
STORE THE OPTIMAL PATH
END OF CYCLE SELECTS RANDOM
[image:6.595.357.473.131.494.2]POSITION
Fig. 9. ABC algorithm flowchart
First start the process and initial the node then search the initial position of cluster head and calculate the value for the shortest path and update the node and start the next round and the cluster member are more means select the any one position and calculate the probability to find the another new position then form a group then energy is lower means store the optimal path and end the process. A very short distance resembling a round path and prefer the nearer food sites over the distance ones in order to increase the energy efficiency of the colony and the amount of food sources is increases the number of onlookers and visiting them increases. The scouts carry a random search process for discovering a new food source.
The ABC algorithm is prolonging the network lifetime and reduce packet loss, delay, and traffic rate. The M-leach protocol is used select the cluster head at a time for energy. Dynamic Source Routing is used and it is a self-maintaining routing algorithm used in wireless network. The algorithm can also been work with the cellular telephone systems and the mobile networks and it form a route on-demand to transmitting node requests. This is using a source routing instead of the relying on routing table at each of the intermediate device. Determining source routing is requires to gathering the address of each node between the source and destination during the route discovery and the gathered data is used by the nodes processing for the route discovery packets. In LEACH protocol data is transmitted from cluster head to the base station node through communication no matter the distance between cluster head and base station. Energy consumption increases if the distance is more. M-LEACH protocol is modified Leach algorithm which allows the sensor nodes to use a many hop communication with the cluster to maximize the energy efficiency of protocol. The direct communication between cluster head is not possible due to the distance between them. The solution proposed is that
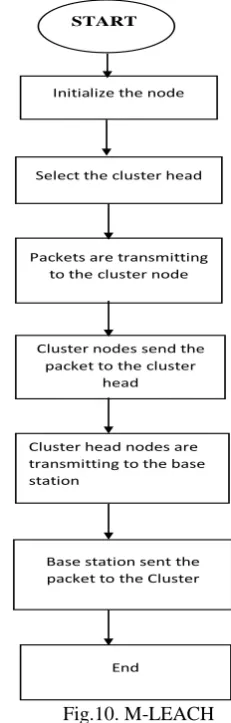
multi-hop approach is followed in both inside and outside the cluster. Cluster head can perform the message fusion to receive message and allowing a less in total transmitted and forwarded message in to the network. The M-LEACH flow chart is shown in Fig. 10.
START
Initialize the node
Packets are transmitting to the cluster node
Cluster nodes send the packet to the cluster
head Select the cluster head
Cluster head nodes are transmitting to the base station
Base station sent the packet to the Cluster
End
Fig.10. M-LEACH
First initialize the node and choose the cluster head based on the shortest path and the another cluster member are send the data to the cluster head then CH send the information to the land station or if the cluster head is not selected then more energy losses is occur .The cluster head is selected at a time in the cluster member in group. M-LEACH is the initial and most widely used energy-efficient for clustering in WSN that is proposed for minimizing the power consumption, prolong network and the clustering task is alternated among the nodes and it is based on the duration. To forward the data to base station the cluster head uses communication. It is based on the aggregation which includes the original data into the lesser size of the information to carry only the meaningful data of all individual sensor’s nodes. It is dividing the network into a many cluster of the sensors and which is developed by using the localized coordination to control not only reduce an amount of information are transmitted to the destination and also make the routing and information dissemination are the more scalable and robust.
[image:6.595.52.286.225.348.2]Fig.12. NAM Window
Fig. 12 shows the NAM window for the proposed algorithm. In NAM window 32 nodes are created and given a traffic agent, data transmission etc. The 30 nodes are clustered into 10 cluster members in that select the cluster head with is shortest distance to the base station.
[image:7.595.312.543.106.233.2]Energy consumed is a total amount of energy used by a node in the network for DEFL is compared with the proposed system. DEFL is consumed 83 percentage of energy at the time if 10 seconds and proposed system consume 15 percentage of energy at the time of 10 seconds then DEFL is consumed more energy compared to the proposed system. Fig. 13 shows the energy consumed by DEFL and proposed work from this we can observe that proposed work consumes less energy when compared to DEFL algorithm.
Fig.13. Energy Consumed
The remaining energy of DEFL is 16 percentage at 12 seconds for 30 nodes. It indicates that the energy is utilized by all other node for transmission. The proposed system has an 84 percentage of residual energy at 12 seconds and the same energy is stand for long time. The residual energy is shown in the Fig. 14.
Fig.14. Residual Energy
[image:7.595.302.552.341.439.2]In the terminal window total amount of energy is used and the remaining part of energy based on ABC algorithm have displayed which is shown in Fig 15.
Fig.15. Terminal Window showing the output of ABC algorithm
[image:7.595.53.288.399.528.2]Table 2. shows the energy consumed by proposed algorithm. Node 3 transmits the packet to another node by using 2 seconds and the 1.98 percentage of energy. Similarly, for the nodes 10, 19, 20 and 32 the time taken to transmit the packet and the energy consumed is shown in table 2.
Table 2. Energy consumed
Node Time (sec) Energy (J)
0 0 0
3 2 1.98
10 4 3.21
19 6 5.14
20 8 9.34
32 10 14.98
Table 3. shows the comparison of energy consumed by DEFL and Proposed algorithm. We can observe that the proposed algorithm consumes less energy when compared to the DEFL algorithm. For example, for node 6 the energy is consumed is 31.12 Joule but in proposed system the energy consumption is only 5.14 Joules. So that we can conclude that the proposed algorithm has an extended network lifetime.
Table 3. shows the comparison of DEFL and proposed algorithm
Time DEFL algorithm
energy consumption (J)
Proposed algorithm Energy
consumption (J)
0 0 0
2 19.23 1.98
4 25.78 3.21
6 31.12 5.14
8 39.21 9.34
10 54 14.98
VIII. CONCLUSION
The energy is an important aspect in each network to improve the network lifetime. To make the appropriate trade-off between the energy efficiency and an energy consumption among with the sensor nodes. The DEFL is compare with the proposed
[image:7.595.320.538.560.698.2] [image:7.595.58.277.611.754.2]path. DEFL uses a leach protocol which is a single hop communication and it transmit from source to destination so more energy is used and the network lifetime is not extended but in the proposed algorithm, M-Leach protocol by a multi-hop communication select the three cluster head at a time, so only less energy is used then it extends the network lifetime. The future scope is created the greater number of nodes and evaluate the node density and use different protocol to extent network lifetime.
REFERENCES
1. H. Yetgin, K. T. K. Cheung, M. El-Hajjar, and L. Hanzo, “A survey of network lifetime maximization techniques,” IEEE Communication. Survey. Tut., Vol. 19, no. 2, pp. 828–54, Jan. 2017.
2. G. Anastasi, M. Conti, M. D. Francesco, and A. Passarella, “Energy conservation in wireless sensor networks: A survey,” Ad Hoc Networking, Vol. 7, no. 3, pp. 537–68, May 2009.
3. C.-W. Tsai, T.-P. Hong, and G.-N. Shiu, “Metaheuristics for the lifetime of WSN: A review,” IEEE Sensors J., Vol. 16, no. 9, pp. 2812–31, May 2016.
4. Z. Lu, W. W. Li, and M. Pan, “Maximum lifetime scheduling for target coverage and data collection in wireless sensor networks,” IEEE Transaction Vehicle Technology, Vol. 64, no. 2, pp. 714–27, Feb. 2015. 5. N.Thangadurai and Dr.R.Dhanasekaran, “Optimal Energy Consumption to extend the lifetime of Wireless Sensor Networks” Journal of Computer Science, Vol. 9, Iss. 5, pp. 646-653, 2013. 6. N.-T. Nguyen, B.-H. Liu, V.-T. Pham, and Y.-S. Luo, “On Maximizing
the lifetime for data aggregation in wireless sensor networks using virtual data aggregation trees,” Computer. Networking. Vol. 105, pp. 99–110, Aug. 2016.
7. B. F. Solaiman and A. Sheta, “Energy optimization in wireless sensor networks using a hybrid K-means PSO clustering algorithm,” Turkish J. Elec. Engg. Computer. Sci., Vol. 24, pp. 2679–95, Apr. 2016. 8. N. Gautam, S. Sofat, and R. Vig, “Energy-efficient mobile cluster-head
data collection model for wireless sensor networks,” Turkish J. Elec. Engg. Computer. Sci., Vol. 24, pp. 3448–58, Jun. 2016.
9. Kaur, Jasvir et al. "A Novel Energy Efficient Cluster Head Selection Method For Wireless Sensor Networks". International Journal Of Wireless And Microwave Technologies, vol 8, no. 2, 2018, pp. 37-51. 10. K. Johny Elma, S. Meenakshi “Energy Efficient Clustering for Lifetime
Maximization and Routing in WSN”, International Journal of Applied Engineering Research, Volume 13, Number 1 pp. 337-343, Jan. 2018. 11. N. Thangadurai and Dr.R.Dhanasekaran, “A Review of Clustering
based Energy Efficient Genetic Algorithms for Wireless Sensor Networks”, European Journal of Scientific Research, Vol. 101-3-4, pp. 360-371, 2013.
12. Reem Aldaihani , Hosam AboElFotoh, “A new scheme for maximizing the lifetime of heterogeneous wireless sensor networks”, 1st International Conference on Computing Science and Engineering, Volume 1,March. 2015.
13. N. Thangadurai and Dr.R.Dhanasekaran, “Energy Efficient Cluster based Routing Protocol for Wireless Sensor Networks”, International Journal of Computer Applications, Vol. 71, No. 7, pp. 43-48, 2013. 14. Gaurav S. Wagh ,Rajesh S. Bansode, “Design Analyze and Implement
Wireless Sensor Network Performance using Energy Balance Routing Protocol”, International Journal for Innovative Research in Science & Technology|, Volume 3 ,September. 2016.
15. http://www.rfwireless-world.com/Articles/WSN-Wireless-Sensor-Netw ork.html
AUTHORSPROFILE
Rizwana S is a PG Scholar in the department of Electronics and Communication Engineering, Jain(Deemed-to-be University), Bangalore. She has obtained her bachelor’s degree in Electronics and Communication Engineering from K.Ramakrishnan College of Technology, Tamilnadu in the year 2017. She has pursuing her Master’s Degree in Embedded System Design at Jain Jain(Deemed-to-be University), Karnataka. Her areas of interest in Wireless Communication and Embedded System Design.
.
Gayathri K M is an Assistant Professor in the Department of Electronics and Communication Engineering, School of Engineering and Technology, Jain (Deemed-to-be University), Bangalore. She has obtained her Bachelor’s Degree in Medical Electronics and Master’s Degree in VLSI and Embedded Systems. Awarded PhD in 2018 from Jain University. She is having 8 years of teaching experience and 4 years of industry experience. She has published 13 research papers in both International and National Journals and presented papers in conferences. She has guided UG and PG students for their academic projects. Her areas of interest are VLSI, Wireless Communication, Satellite Communication and Navigation Systems. She is working as Principle Investigator for ISRO funded projects. She is also an associate member of OSI and IEEE.