City, University of London Institutional Repository
Citation
:
Kiss, I. Z., Broom, M., Craze, P. G. and Rafols, I. (2010). Can epidemic models describe the diffusion of topics across disciplines?. Journal of Informetrics, 4(1), pp. 74-82. doi: 10.1016/j.joi.2009.08.002This is the unspecified version of the paper.
This version of the publication may differ from the final published
version.
Permanent repository link:
http://openaccess.city.ac.uk/974/Link to published version
:
http://dx.doi.org/10.1016/j.joi.2009.08.002Copyright and reuse:
City Research Online aims to make research
outputs of City, University of London available to a wider audience.
Copyright and Moral Rights remain with the author(s) and/or copyright
holders. URLs from City Research Online may be freely distributed and
linked to.
City Research Online: http://openaccess.city.ac.uk/ [email protected]
Can epidemic models describe
the diffusion of topics across disciplines?
Istvan Z. Kiss1, Mark Broom1, Paul Craze2 & Ismael Rafols3,4*
1
Department of Mathematics, University of Sussex, Brighton. BN1 9RF, UK
2
Department of Biology and Environmental Science, University of Sussex, Brighton. BN1 9QG, UK
3
SPRU –Science and Technology Policy Research, University of Sussex, Brighton. BN1
9QE, UK 4
Technology Policy & Assessment Center, School of Public Policy, Georgia Institute of Technology. Atlanta, GA 30332, USA.
*
Corresponding author ([email protected])
August 28th, 2009
Submitted to the Journal of Informetrics
Abstract
This paper introduces a new approach to describe the spread of research topics across disciplines using epidemic models. The approach is based on applying individual-based models from mathematical epidemiology to the diffusion of a research topic over a contact network that represents knowledge flows over the map of science –as obtained from citations between ISI Subject Categories. Using research publications on the protein class kinesin as a case study, we report a better fit between model and empirical data when using the citation-based contact network. Incubation periods on the order of 4 to 15.5 years support the view that, whilst research topics may grow very quickly, they face difficulties to overcome disciplinary boundaries.
Keywords: knowledgediffusion, epidemic model, science map.
1. Introduction
infection. In a similar way, individuals or groups working on a particular research topic or topics can motivate other individuals or groups to start work based on the same or similar research topics with citation being evidence of motivation.
Though models of social contagion date back to the mid 20th century1, the use of epidemiological models to capture the diffusion of research topics through scientific publications was recently discussed by Bettencourt et al. (2006), who found a good fit between suitably adapted epidemic models and data for the spread of a specific research topic (Feynman diagrams in theoretical physics). They further showed that this good fit is not dependent on the particular topic chosen and that epidemic models provide good descriptions of the spread of other topics in both theoretical and experimental physics (Bettencourt et al. 2008).
However, the epidemiological models investigated so far have been of the simple differential-equation-based compartmental type. While compartmental models are transparent and allow the derivation of some analytical results, they are limited in their capability to capture heterogeneities at the individual level and in the interaction between individual epidemiological units, both of which we expect to see in citation networks (see model description below). As a potentially useful alternative method, we have developed an individual-based directed and weighted network model.
The second novelty of the approach we present here is that, whereas previous studies have investigated the growth of a topic in terms of number of published papers or publishing authors, we inquire here into how a research topic spreads over an existing network of disciplines. In other words, whereas previous studies had focused on growth dynamics, this novel perspective captures the diffusion of topics over the network of connections between scientific disciplines, as assigned by the ISI Web of Science’s classification in terms of Subject Categories (SCs), following Leydesdorff and Rafols’ approach (2009). This underlying network of citations among SCs represents the knowledge flows over the “backbone” of the map of science (Boyack et al., 2005). The weight of a link (i.e., the normalised number of citations between SCs) in this network is taken to be a good indicator of the likelihood of a SC becoming research-active in a certain area given that some other related SCs are already research-active in this specific area. We can then ask whether a novel topic (a newly discovered phenomenon, material, method or piece of instrumentation) seeded at one particular node or vertex in the network will diffuse through it following to some extent the weighted connections between SCs.
In this exploratory study we examined the spread of research on kinesin. Kinesin represents a class of eukaryotic motor proteins (often referred to as a molecular motor or “nano-engine”) that functions by moving actively along microtubules (Block, 1998). Kinesin research first emerged in 1985, with the report of its discovery published in the areas of Biochemistry and Cell Biology. In the 1990s, research on kinesin spread broadly to other fields in the biological sciences and in the 2000s it reached other biomedical research, on the one hand, and chemistry, physics and materials sciences, on the other, as
1
illustrated in Figure 1. This later development is associated with potential bionanotechnology applications, what made kinesin an interesting case for the study of interdisciplinary research (Rafols, 2007, Rafols and Meyer, 2009).
Here, we show that the spread of kinesin-related research over a network of disciplines can be well approximated by models used in the context of the transmission of infectious diseases (Anderson & May, 1991; Diekman & Heesterbeek, 2000; Keeling & Rohani, 2008). Similar network models have been successfully used to explain and predict the pattern of infectious disease transmission (Keeling et al., 2001; Green et al. 2008; Kiss et al. 2005, 2006a, 2006b), and such models are well researched in the context of mathematical epidemiology (Keeling & Eames, 2005).
The paper is organised as follows: we first introduce the data and methods; second, we describe the model; then we present the results of the quality of fit for two different disease transmission models (i.e., Susceptible-Infected or SI, and Susceptible-Exposed-Infected or SEI). Results based on the directed and weighted empirical network are compared to the case of homogeneous disciplinary spread (i.e., equal weights) on the same network. The discussion and conclusions briefly explore possible future improvements of the model and its applications in science policy.
Neurosciences
Comp Sci
Geoscience
Agriculture
Ecology
Biomed Sci
Chemistry
Physics Engineering
Env Sci
Materials Sci Infectious diseases
Clinical medicine
General medicine
Neurosciences
Comp Sci
Geoscience
Agriculture
Ecology
Biomed Sci
Chemistry
Physics Engineering
Env Sci
Materials Sci Infectious diseases
Clinical medicine
General medicine
[image:5.612.98.473.89.355.2]2008
Figure 1: Cumulative number of publications related to kinesin in the map of science for 1994 and 2008. Each node represents a Subject Category (SC). The size of nodes is proportional to the number of publications. The positions of SCs are related to similarities in citations as described in Leydesdorff and Rafols (2009). The weighted network of links aims to illustrate the citation flows among SCs.2.
2. Methods and data
A set of publications (articles, reviews and letters) related to the molecular motor kinesin was constructed searching the term “kinesin*” in the bibliographic field “Topic” of the ISI Web of Science database. This search yielded 4,021 publications starting from 1985 (2 publications) to 2007 (394)2. Each publication was assigned to one or more disciplines according to ISI Web of Science’s classification in terms of SCs. The matrix of cross-citations between SCs was obtained from Leydesdorff and Rafols (2009)3. This SC to SC citation matrix had been created for 2006 from the Journal Citation Reports (JRC) of the Science Citation Index (SCI). This matrix of cross-citation among disciplines is very dependent on how the disciplines (here SCs) are defined, an issue on which there is little agreement. However, comparisons of science maps by Klavans and Boyack (2009) and Rafols and Leydesforff (2009) suggest that even for very different classifications the basic characteristics of the overall structure of the science matrix are quite robust4.
2
Due to improved indexing since 1991, this search underestimates the number of publications until 1990 – an effect we will overlook here.
3
The matrix of SC-to-SC cross-ctiations is available at Loet Leydesdorff’s webpage:
http://www.leydesdorff.net/map06/data.xls .
4
This citation matrix of 171 SCs as nodes (N=171)5 was used to construct the contact network over which the transmission dynamics unfolds (in this case, the spread of research topics). This baseline citation network may be understood as representing the knowledge flows among SCs. For example, a citation from SCj to SCi represents a
potential route on which knowledge could have spread from SCi to SCj. The key
assumption in the model is that that the weight of a link of this network is a good indicator in determining the likelihood of a SC becoming research-active in a certain area given that some other related SCs are already research-active in this area. The links were normalised so that the weight of the incoming links for all SCs add up to one. Hence the weight wij of the directed link from SCi to SCj is given by:
) 1 ( SC by made citations total
of #
SC to SC from citations of
#
j i j
= ij
w
with w 1for j 1 N (2).
i
ij = ∀ = K
∑
The distribution of link weights is skewed and close to a scale-free distribution (Barabási & Albert, 1999). The directed and weighted SC network was found to be highly connected with many links but most of them with very small weights. Further descriptive details of the network are presented in the supplementary information.
3. The model
In classic disease transmission models that assume homogeneous random mixing, the population is divided into different compartments based on the disease status of the individuals and other characteristics such as age, gender or risk. Thereafter, the rates of all possible transitions between the compartments are determined. Based on this, a system of differential equations can be derived. In our model, we use a different approach and consider each SC as a node in a network along with all its directed and weighted connections to other nodes or SCs. Based on Sharkey (2008) and Kiss et al. (2005, 2006a, 2006b) we use an individual-based model where equations for the probability of being in a particular state (e.g. susceptible, S; exposed and incubating, E; or infected and infectious, I) at a particular time are worked out based on the links between SCs, the status of neighbours, and given transmission and transition rates. SCs that are susceptible (S) are either not aware of a particular research topic or, if aware, may still not adopt it. Incubating SCs (E) are those that are aware of a certain topic and have moved onto actively engaging with it. This is expected to result in tangible research output in the form of papers. Infected SCs or adopters (I) are those that are actively working and publishing in a particular research topic. Further states such as recovered (i.e., SCs that have stopped working on a particular research area, often denoted by R) and sceptics or stiflers (i.e.,
5
SCs that are aware of the topic but do not adopt it or prefer another competing topic, often denoted by Z) are possible. In our current model the recovered and sceptics states are not considered in order to keep the model as simple as possible.6
We examined two models, a Susceptible-Exposed-Infected (SEI) model and a simpler Susceptible-Infected (SI) model. The SEI model equations are given by:
⎪
⎪
⎩
⎪⎪
⎨
⎧
=
−
∑
=
∑
−
=
),
(
/
)
(
)
3
(
),
(
)
(
)
(
/
)
(
),
(
)
(
/
)
(
t
gE
dt
t
dI
t
gE
t
S
t
I
T
dt
t
dE
t
S
t
I
T
dt
t
dS
i i ij ji j i
i
j ji j i
i
where denotes the probability of node i being infected at time t (likewise
for and ). Throughout the simulation, 1
) ( 0≤ Ii t ≤
) (t
Si Ei(t) Si(t)+Ei(t)+Ii(t)=1, for ∀t>0. The directed and weighted contact network is represented by Tij =rGij with G
denoting the adjacency matrix that includes link weights. r is the transmission rate per contact and 1/g is the average incubation or latent period. The set of equations states that the increase in the probability E
N j i ij ij =(w ), =1,...,
i of a node i being exposed is directly proportional to the probability Si of node i being susceptible and the probability Ij of neighbouring nodes j being infected. For ease of notation, the number of such infectious contacts and their weight and the per-contact rate of transmission are incorporated in Tij.At the same time,
Ei decreases as exposed/infected nodes become infectious after an average incubation time 1/g. More details of the model derivation are given in Sharkey (2008). By numerically integrating the ordinary differential equations, the number of the infected or adopter SCs at time t, according to the model, can be estimated as =
∑
i i t
I t
I( ) ( ).
The SEI model (Eq. (3)) can be simplified to the case of an SI model where the possibility of an exposed period is excluded. The equations for the simple SI model are
)
4
(
,
)
(
)
(
/
)
(
,
)
(
)
(
/
)
(
⎪
⎩
⎪
⎨
⎧
=
−
=
∑
∑
j i j ji i j i j ji it
S
t
I
T
dt
t
dI
t
S
t
I
T
dt
t
dS
where now, the probability Ii of a node i being infected and infectious only depends on the probability Si of node i being susceptible, the probability Ij of neighbouring nodes j being infected and the per-contact transmission rate–without the mediation of an incubation time.
6
The simulations for both models were started at time t = 0 corresponding to 1985 and the equations were integrated forward in time until 2007. The initial infection was seeded in the two SCs corresponding to Biochemistryand Molecular Biology and Cell Biology. The
SEI model has two free parameters that allow to fit model output to empirical data:
• r, the per contact transmission rate.
• g, where 1/gis the average incubation or latent period.
In the SI model, only r was estimated. In both cases the cumulative SC count and I(t)
were normalised by N and compared on a yearly basis. The estimation of parameters was performed based on a modified version of the Kolmogorov-Smirnov statistic. That is, a minimum distance estimation between an empirical distribution function of a sample and the cumulative distribution function of the reference distribution:
)
5
(
.
)
(
)
(
1
sup
1 2007 ,..., 1986 , 1985⎥⎦
⎤
⎢⎣
⎡
⎟
⎠
⎞
⎜
⎝
⎛ ∑
−
=
= = N j j tt
ount
EmpiricalC
t
I
N
AdaptedKS
The count (cumulative) of the SCs that had become active in kinesin-related research provides information at the level of all SCs or population level. We note that although this is a good method to estimate the parameters, we cannot assess the fit by performing the actual Kolgomorov-Smirnov test, as the contributing data are not independent and identically distributed (i.i.d.). Apart from the accurate prediction of the growth in the number of SCs, an appropriate model that fits the data well can also predict the exact SCs that are active, at a particular time, in kinesin-related research. To monitor model prediction at the SC level the following likelihood function is applied:
(
(
)
) (
1
(
)
)
,
(
6
)
log
1
2007 , , 1986 , 1985 1 ) ( 1 ) (∑
⎟
⎠
⎞
⎜
⎝
⎛
⎟
⎠
⎞
⎜
⎝
⎛∏
−
−
=
= = − K t N i t i Y i t i Yi
t
I
t
I
M
L
where , is an indicator function with a value of one denoting a SC that was active in kinesin-related research at time t and zero if otherwise (Keeling et al. 2001, Green et al. 2008).
} 1 , 0 { ) (t ∈ Yi
M denotes the number of time points where comparisons at the individual level were made. In this case, M =23 and this corresponds to yearly comparisons from 1985 until 2007. Notice that due to the –log( ) term, a good fit will be obtained for the smallest values of L. Similarly, to above, we cannot perform the standard likelihood ratio test to asses the model fit, as data are not i.i.d.
4. Results
4.1. Susceptible-Infected model
Weighted network
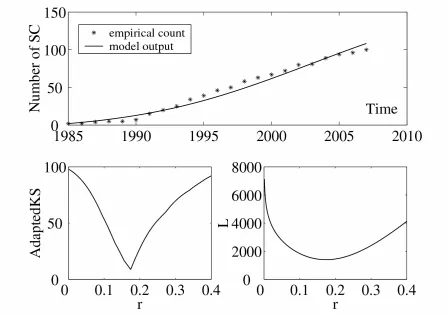
[image:9.612.92.539.217.531.2]For this simple one parameter model, the fit to the empirical data was relatively good and both measures of model fit were minimised for the same value of r (figure 2), correct to three decimal places. This indicates that this simple baseline model captured the spread of kinesin-related research to quite a good degree. The model output slightly overestimated the initial growth but did better for later years.
Figure 2: Best fit curves of the growth of the number of SCs that are active in Kinesin-related research (top panel), AdaptedKS (bottom left) and L (bottom right) as a function of r. Model based on the weighted network and SI type transmission. Best fit for both measures is obtained for r = 0.174 with the corresponding AdaptedKS = 0.051885 (8.872447 in terms of counts) and L = 1395.716852. The optimal value of r is given up to a 10−3 precision.
Exploring variations in the weights
where all links were equal to the average link weight; second, the case when the weights of all incoming links of any node or SC are equal and sum to one.
i. All weights equal
First, we considered the weighted network case where all link weights are assumed to be equal to the average link weight over the whole network ( for
). In figure 3, the best fit case is illustrated with an optimal value of r that is comparable to that obtained from the weighted network case. While the initial fit up to 1990 is very accurate, for later years the fit is less accurate when compared to the weighted network model–in particular the empirical form indicates an elongated S-shape while the fitted forms do not. This indicates that weights based on the citation pattern are important in understanding and modelling the dynamics of the spread. The importance of weights is further emphasised by the higher values of AdaptedKS and L compared to the weighted network case.
22295 / 171 = ij
w
N j
i, =1,K, ∀
Figure 3: Best fit curves to the growth of the number of SCs that are active in Kinesin-related research (top panel), AdaptedKS (bottom left) and L (bottom right) as a function of r. Model based on a network with all weights equal to the average weight across all links of the original network and with an SI type transmission. r = 0.229 minimises
AdaptedKS (=0.114695 or 19.612834 in terms of counts) with a corresponding value of
AdaptedKS=0.153308 (26.215715 in terms of counts). The optimal values of r are given up to a 3 precision.
10−
ii. Weights of all incoming links of a node equal and sum to one
In this second case the network is weighted such that the weights of links pointing towards any node are all equal to the inverse of the destination node’s in degree. (e.g., the weight of all links that point to a node with an in degree equal to 10 will be equal to 1/10=0.1). The results of this case are very similar to the previous one. As shown in Table 1, the former weight distribution performs marginally better in minimising the value of AdaptedKS but does clearly better in minimising L.
In conclusion, the simple SI model shows a relatively good agreement with empirical data for kinesin, but this agreement can be shown to depend on the use of the weighted network. This result supports the main idea behind this paper: that diffusion of topics on the map of science is more likely to occur between disciplines with existing knowledge flows. However, in what follows we explore if the addition of a latent or incubation period to the basic model, while keeping the weighted network, can improve the agreement between model output and empirical data.
4.2. Susceptible-Exposed-Infected model
An important component of the transmission of topics is the latent or incubation period that represents the time needed to assimilate and different research ideas. The SEI
model has two parameters, with the latent period having an important effect on the initial growth rate of the number of SCs becoming active, (i.e. α, with I(t) = ce
(
1/g)
)
αt
). In figure 4 we illustrate the best fit prevalence curves based on the AdaptedKS and L. To interpret these results, it is useful to think in terms of first considering a fixed latent period
(
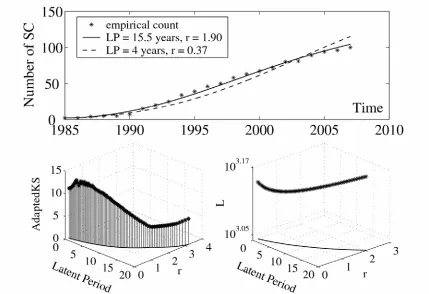
and thereafter determining the value of r that minimises the difference between data and model output. Long latency periods delay the infection and many infected individuals remain exposed for longer. Thus, to get a reasonable fit, high values of the transmission rate r are required. This tendency is reflected by a set of optimal parameter pairs (1/g, r)with both latent period and transmission rate increasing simultaneously (figure 4, bottom left and right). However, the quality of fit, along the set of optimal pairs, changes with the best agreement based on AdaptedKS occurring for (1/g, r) = (15.5, 1.90). For longer latent periods this measure indicates that the discrepancy between model output and data increases (figure 4, bottom left). A similar tendency is observed when the parameter estimation happens based on L with the best agreement between data and model output for (1/g, r)= (4.0, 0.37).
g
/ 1
The minimum value of the AdaptedKS is considerably lower than that corresponding to the SI model. The minimum value of L is also clearly lower, although this is obtained for a parameter pair that is very different compared to the pair that minimised AdaptedKS. While the agreement at the population level is much better for the SEI model, for the same pair of parameters, the agreement at the individual level is not as good as for the simple SI model. The same observation is valid when considering the minimum value of
is difficult to obtain. This difficulty is indicative that the model may be improved further as described in the next section.
Figure 4. Best fit curves to the growth of the number of SCs that are active in Kinesin-related research (top panel), AdaptedKS (bottom left) and L (bottom right) as a function of the latent period and r . Model based on the weighted network with SEI type transmission. A latent period of 15.5 years and r = 1.90 minimises AdaptedKS
(=0.026186 or 4.477749 in terms of counts) with a corresponding value of
L=1460.664702. A latent period of 4 years and r = 0.37 minimises L (=1358.911193) with a corresponding value of AdaptedKS=0.087254 (14.920351 in terms of counts). The optimal values of r are given up to a precision with the latent period to a precision of ¼ years.
2
10−
Model Network Type r g AdaptedKS L
SI Empirical weighted 0.174 NA Min=0.051885 Min=1395.716852 0.229 NA Min=0.114695 1700.530081
SI All weights equal
0.238 NA 0.153308 Min=1694.533715 0.230 NA Min=0.115324 1811.015665
SI Weights of all incoming
links sum to one 0.238 NA 0.148455 Min=1806.257798 1.90 1/15.5 Min=0.026186 1460.664702
SEI Empirical weighted
Table 1: Summary of parameter estimates for different networks and disease transmission models. In bold we indicate the best fit model and optimal parameters.
5. Discussion
The results of the simulations showed that relatively simple models with the directed and weighted network of SCs can produce good fits and deliver estimates of transmission rates and incubation times. As the present study is essentially a proof of concept, these results should be treated with a degree of caution but they do suggest directions in which this methodology could be further developed. We envisage two aspects in which the models might be incrementally improved.
First, we have deliberately restricted this initial study to the two simplest epidemiological models, with empirical data that only considers whether SCs have been active in kinesin research. While the transmission among SCs is crucial in the initial ‘seeding’ stages, after a SC started work on a particular research topic, the main driver of growth may come from activity within that particular SC. Hence, some form of within SC dynamics that goes beyond dichotomous description of SCs and takes into account its degree of activity (i.e. its relative amount of publications it has in the topic) can be important if trying to improve the model fit.
Second, whilst here we have used a cumulative description, assuming that one active/infected SC never lost its activity in the field, changing the type and/or number of states of a node (i.e. compartments) may result in a better description of the observed spread. For example, allowing SCs to “forget” kinesin after some period without publications seems a realistic assumption. This would echo the findings of Bettencourt et al. (2008), where elaboration of their simple epidemiological model to include recovered (i.e. researchers who have produced papers on a particular topic but have then moved on to other research) and sceptics (i.e. researchers who stifle or prevent the movement of ideas they do not accept) classes resulted in better descriptions on their empirical data.
than those requiring a large investment of experimental equipment (e.g., nanofabrication) even when the underlying social and cognitive networks are quite similar.
6. Conclusions
This paper has demonstrated the feasibility of applying individual-based epidemic models to the spread of a research topic over the map of science. It has made two contributions beyond previous epidemic models (Betterncourt et al., 2006, 2008): the use of a directed and weighted network of disciplines to describe the spread of topics, and the introduction of individual-based models. Using research on kinesin as a case study, we have confirmed that the agreement between model output and empirical data significantly increases when the normalised weighted contact network between SCs is used (the base map of science). The investigation has allowed us to discuss possible further improvement in the models, e.g. by considering internal SC growth dynamics (e.g. taking into account not only whether a SC is infected, but also how active it is) or loss of activity (recovery) of a SC.
Although this is a proof of concept study and results need to be treated with caution, the incubation periods obtained, on the order of 4 to 15.5 years, support the view that, whilst research topics may grow very quickly, they face difficulties to overcome disciplinary boundaries. This type of information regarding the diffusion rate of research topics over disciplines may be of particular interest for emergent fields such as nanotechnologies to test claims (and hype) of radical changes in knowledge dynamics (Bonaccorsi, 2008).
Acknowledgements
References
Anderson R.M. & May R.M. (1991) Infectious diseases of humans: dynamics and control, Oxford: Oxford University Press.
Barabási, A.-L. & Albert R. (1999), Emergence of scaling in random networks, Science 286, 509-512.
Bettencourt, L.M.A., Cinrón-Arias, A., Kaiser, D.I. & Castillo-Chávez, C. (2006). The power of a good idea : Quantitative modeling of the spread of ideas from epidemiological models,
Physica A (2006) 364, 513-536.
Bettencourt, L., Kaiser, D., Kaur, J., Castillo-Chávez, C. & Wojick, D. (2008). Population modeling of the emergence and development of scientific fields. Scientometrics, 75(3), 495-518.
Bonaccorsi, A. (2008). Search regimes and the industrial dynamics of science. Minerva, 46, 285-315.
Block, S.M. (1998). Kinesin: what gives? Cell 93(1), 5-8.
Boyack, K. W., Klavans, R., & Börner, K. (2005). Mapping the Backbone of Science.
Scientometrics, 64(3), 351-374.
Diekmann O. & Heesterbeek, J. A. P. (2000) Mathematical epidemiology of infectious diseases: model building, analysis and interpretation. Chichester, UK: John Wiley & Sons Ltd. Chen, C. and Hicks, D. (2004) Tracing knowledge diffusion. Scientometrics 59(2), 199-211. Green, D.M., Kiss, I.Z., Mitchell, A.P. & Kao, R.R. (2008). Estimates for local and
movement-based transmission of bovine tuberculosis in British cattle. Proceedings of the Royal Society B, 275, 1001-1005.
Eames, K.T.D. & Keeling, M.J. (2002) Modeling dynamic and network heterogeneities in the spread of sexually transmitted diseases, PNAS (2002) 99, 13330-13335.
Etzkowitz, H. and Leydesdorff, L. (2000). The dynamics of innovation: from National Systems and "Mode 2" to a Triple Helix of university-industry-government relations. Research Policy, 29, 109-123.
Keeling, M.J. et al. (2001) Dynamics of the 2001 UK foot and mouth epidemic: stochastic dispersal in a heterogeneous landscape, Science 294, 813-817.
Keeling, M.J. & Eames, K.T.D. (2005) Networks and epidemic models, Journal of the Royal Society Interface 2, 295-307.
Keeling, M.J. & Rohani, P. (2008). Modelling infectious disease in humans and animals, Princeton, NJ: Princeton University Press.
Kiss, I.Z., Green, D.M. & Kao, R.R. (2005) Disease contact tracing in random and clustered networks, Proceedings of the Royal Society B 272, 1407-1414.
Kiss, I.Z. Green D.M. & Kao, R.R. (2006a). The network of sheep movements within Great Britain: network properties and their implication for infectious disease spread. Journal of the Royal Society Interface, 3, 669-677.
Kiss, I.Z., Green, D.M. & Kao, R. R. (2006b) The effect of network heterogeneity and multiple routes of transmission on final epidemic size, Mathematical Biosciences 203, 124-136. Klavans, R., and Boyack, K. (2009). Towards a Consensus Map of Science. Journal of the
American Society for Information Science and Technology 60(3), 455-476.
Leydesdorff, L. & Rafols, I. (2009) A global map of science based on the ISI Subject Categories.
Journal of the American Society for Information Science and Technology. 60(2), 348-362.
Moya-Anegón, F. de, Vargas-Quesada, B., Chinchilla-Rodríguez, Z., Corera-Álvarez, E., Muñoz-Fernández, F. J., & Herrero-Solana, V. (2007). Visualizing the marrow of science.
Mulkay, M. (1974). Conceptual displacement and migration in science: A prefatory paper.
Science Studies, 4(3), 205-234.
Rafols, I. (2007) Strategies for knowledge acquisition in bionanotechnology: Why are interdisciplinary practices less widespread than expected?. Innovation: the European Journal of Social Science Research. 20(4), 395-412.
Rafols, I. & Leydesdorff, L. (2009). Content-based and Algorithmic Classifications of Journals: Perspectives on the Dynamics of Scientific Communication and Indexer Effects. Journal of the American Society for Information Science and Technology, DOI:
10.1002/asi.21086.
Rafols, I. and Meyer, M. (2009) Diversity and Network Coherence as indicators of
interdisciplinarity: case studies in bionanoscience. Scientometrics, 81(2), in print. DOI 10.1007/s11192-009-0041-y.
Rogers, E. M. (1962). The diffusion of innovations. New York, Free Press of Glencoe. Rosvall, M., & Bergstrom, C. T. (2008). Maps of random walks on complex networks reveal
community structure. Proceedings of the National Academy of Sciences, 105(4), 1118-1123.
Takeda, Y., Mae, S., Kajikawa, Y. and Matsushima, K. (2009) Nanobiotechnology as an emerging research domain from nanotechnology: A bibliometric approach.
Scientometrics, 80(1), 23-28.
Supplementary Information
Can epidemic models describe
the diffusion of topics across disciplines?
Istvan Z. Kiss1, Mark Broom1, Paul Craze2 & Ismael Rafols3,4*
1
Department of Mathematics, University of Sussex, Brighton. BN1 9RF, UK
2
Department of Biology and Environmental Science, University of Sussex, Brighton. BN1 9QG, UK
3
SPRU (Science and Technology Policy Research), University of Sussex, Brighton. BN1
9QE, UK 4
Technology Policy & Assessment Center, School of Public Policy, Georgia Institute of Technology. Atlanta, GA 30332, USA.
*
Corresponding author ([email protected])
1. Descriptive statistics of base network
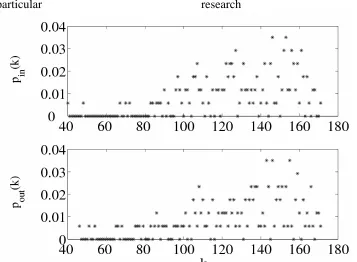
The directed and weighted SC network is a highly connected network with the average number of connections per subject category k ≅130.38. We define the in and out
degree of SCi as the number of incoming
( )
i ink and outgoing
( )
kouti citations/linksrespectively. Every directed link has an origin and a destination SC. Hence, the average
in degree ⎟
⎠ ⎞ ⎜
⎝
⎛ = =
∑
=
N
i i in
in k
N k k
1
1
and the average out degree ⎟
⎠ ⎞ ⎜
⎝
⎛ = =
∑
=
N
i i out
out k
N k k
1
1
particular research ideas.
Figure S1: In and out degree distribution of the SC network showing the proportion of SCs with a particular in and out degree count.
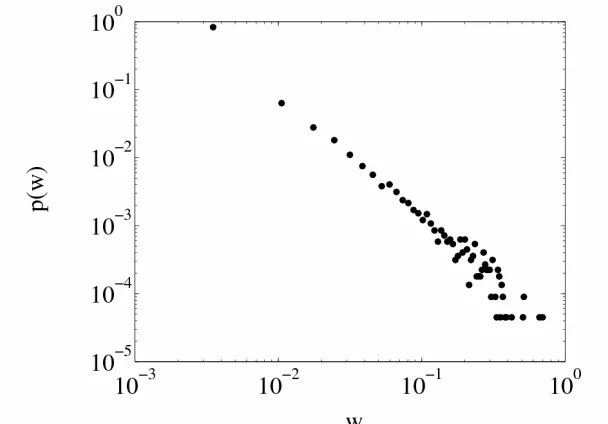
Figure S2: The weight distribution of all links (22295) from the SC network based on citations cumulated over 2006. Distribution based on bins of equal size with bin centres and proportions plotted on a log-log scale.
References
Barabási, A.-L. & Albert R. (1999), Emergence of scaling in random networks, Science
286, 509-512.