Rochester Institute of Technology
RIT Scholar Works
Theses
Thesis/Dissertation Collections
2001
Evaluation of bond graph based object oriented
approach to determination of natural frequencies of
packaging system elements
Vladimir Jaram
Follow this and additional works at:
http://scholarworks.rit.edu/theses
This Thesis is brought to you for free and open access by the Thesis/Dissertation Collections at RIT Scholar Works. It has been accepted for inclusion
in Theses by an authorized administrator of RIT Scholar Works. For more information, please contact
.
Recommended Citation
Evaluation
of
Bond Graph
Based
Object
Oriented Approach
to Determination
of
Natural
Frequencies
of
Packaging
System
Elements
by
Vladimir Jaram
A Thesis
Submitted
to
the
Department
of
Packaging
Science
of
Rochester Institute
of
Technology
Executive
Leader Program
March 2001
Department of Packaging Science
of Rochester Institute of Technology
Rochester, New York
CERTIFICATE OF APPROVAL
M.S.
Degree
The M.S. degree thesis of Vladimir Jaram
has been examined and approved
by the thesis committee as satisfactory
for the thesis requirements for the
Master of Science degree
Acknowledgements
I
wouldlike to
acknowledgethe
help
I have
receivedduring
my
researchfor writing
ofthis
work.First,
I
wouldlike to thank my
colleage andfriend,
Prof.
Dr. Vjekoslav Damic
ofthe
Dubrovnik
Polytechnic for making
useful and valuablesuggestions,
andfor making his
BondSim
softwarefor the Bond Graph
simulation execution available.My
greatthanks
alsogoto
my
mentor
dr. Daniel
Godwin for his
constructive suggestions.Lastly
I
wouldlike to
notemy
gratitudeto
Prof. Dr. Vjera
Krstelj
ofthe
Faculty
ofMechanical
Engineering
andNaval
Architecture,
University
ofZagreb,
andDirector
ofthe
Centre
ofEvaluation
of
Bond
Graph Based Object Oriented
Approach
to Determination
of
Natural Frequencies
of
Packaging
System Elements
by
Vladimir Jaram
2001
ABSTRACT
Packaged items passing through distribution
systemencounter vibrations.It
needsto
be
examined what
happens
to
anobject,
packaged orunpackaged, in the
distribution
environment whenit is
subjectto
outsidevibrations,
sothat
wemay
predictits behavior resulting from
distribution
vibrations.To
prevent productloss
from
both
static anddynamic
forces
encounteredin
distribution,
corporations areturning
in
increasing
numbersto
services of package engineering.This
work evaluatesthe
application ofBond Graphs Based
Object-Oriented
Approach to
Determination
ofNatural Frequencies
ofPackaging
System Elements.
Using
the
Bond
Graph,
a model ofthe
Package-product
systemundertesting
wasdeveloped
to
closely
simulatethe
realtesting
model and conditions.The
testing
model equipment andpackaging
system weredeveloped using
the
Bond Graph
computer assistedmodeling
approach.Using
simulation,
vibrations characteristics ofthe
packaging
model wereobtained,
i.e.,
naturalfrequencies
and other relevant properties ofthe
system(model).
An
analysis ofthe
frequency
characteristics was conductedby
application of physicalmodeling
using
a suitable visual computerdevelopment
platform.The
results obtainedby
simulation,
andthose
obtained onthe
vibrationtable
(32,9 Hz
vs.26,777
Hz)
are closeto
eachother,
they
arevery
encouraging,
andthey
openfurther
possibilities.This
workhas
provedthat the
Bond
Graphs based
approachhas its
placein
a computer aidedtotal
Packaging
Distribution
Design
process.It
should also enable oneto
shortenthe
entiredesign/testing
process,
to insure
that those
expensive parts(products)
are notdestroyed
during
the
testing
process,
andthat the
finished
packagedesign
meetsthe
design
objectives.This
Table
of
Contents
1
.Introduction
1
1
.0.Goals
ofthis
work andhow these
goals willbe
achieved1
1.1. About Bond
graphs1
1
.2.Bond
graphs andPackaging Technology
2
1
.3.Distribution
Packaging
3
1
.3.1.Hazards in Distribution
3
1
.3.2.Distribution Environment
3
1
.4.Vibrations
4
1
.4.1.Distribution Vibrations
5
1
.4.2.The Natural
Frequency
5
1
.4.3.Vibrations
ofPackaged Products
6
1
.4.4.Forced Vibrations
andProduct
Sensitivity
8
1
.4.5.New Trends in Vibration
Testing
9
2. Vibration
Testing
10
2.1. Vibration Test Methods
1 1
2.2. Experiment
-Determining
the
naturalfrequency
of aninternal
productcomponent
(Critical element)
12
2.2.1
.Description
oftesting
product model12
2.3.
Testing
Machine
atthe
R.I.T.
15
2.4. Experiment
16
2.4.1
.Experiment
result(Natural
frequency)
16
3. Bond Graphs Based Object Oriented Approach
to Determination
ofNatural
Frequency
19
3.1. Model Representation
19
3.2. Simulation Software
20
3.3.
Bond
graphs model oftesting
element21
3.3.1.
BG
model21
3.3.2.
Mechanical
properties oftesting
element material24
3.4. Mathematical
model ofbeam
vibrations25
3.4.1.
Introduction
25
3.4.2. Basic
kinematics
26
3.4.3. Lagrange
equationsof element motion29
3.4.4.
The beam
elementdynamics
30
3.4.5. The
weightdynamics
31
3.5.
Executing
Simulation
33
4.
Conclusion
38
5. References
39
Appendix
1
-Characteristics
ofLansmont
vibrationtest
machine41
1.
Introduction
To
preventproductloss due
to
the
static anddynamic forces
encounteredin
distribution,
corporations areturning
in
increasing
numbersto the
package engineering.As
new markets openfor
sophisticated consumergoods,
such asthe
ubiquitous personalcomputer,
corporatedecision
makers arebecoming
sensitiveto
the relationship
ofeffective,
protectivepackaging
to
product andcompany
well-being.Although
most obviousin
the
case of electronicproducts, protective packageengineering is
alsobeing
appliedin many
other productareas,
from
pharmaceuticalsto
fruit
[1].
Product-package
testing
machinery
andinstrumentation,
andthe
expertisenecessary for
efficient packagedevelopment
areincreasingly
in demand
as packageengineering keeps
improving. As
withany
innovation,
progress with more sophisticatedconcepts, methods,
and procedures requires acorresponding
increase in
knowledge,
understanding, andtechnical
skills[1]-Bond
graphs as model representationlanguage
are usedfor
computer simulation and analyzes ofdynamic engineering
systems.They
are well suitedfor modeling behavior
of a complexmultidisciplinary
systemin
a unified way.Recent developments
ofthis methodology based
on object-oriented approach and symbolic computational algebra supporthave
widened,
evenmore,
the
capabilities ofthis
methodology
to
deal
with realengineering
systems.Consequently,
they
canbe
usedfor
simulation oftesting
productbehavior
(characteristics)
whenthey
are exposedto
different kinds
ofstress,
including
shocks andvibrations.This
work evaluatesthe
application ofBond Graphs Based
Object-Oriented
Approach to
Determination
ofNatural
Frequencies
ofPackaging
System Elements.
1.0.
Goals
ofThis Work
andHow
They
Will
be
Achieved
Packaging
systemtesting
procedure willbe
reviewed.The packaging
system model willbe
also analyzed andtesting
objectives willbe determined. A
model oftesting
equipment andpackaging
system willbe developed using Bond Graph
computer assistedmodeling
approach.The
modelofthe
system shouldbe developed in
such away that
vibration characteristics canbe
predicted withreasonably
good accuracy.Using
simulation,
vibrationscharacteristics ofthe
packaging
system willbe
obtained,
i.e.,
the
naturalfrequencies
and other relevant properties ofthe
system(model).
The
resultsobtainedby
simulation willbe
comparedto
those
obtained onthe
testing
machine(the
same modelhas already
been tested
on atesting
machine atthe
R.I.T.).
Finally,
conclusionswillbe
drawn
regarding
resultsachieved,
andfeasibility
ofusing the
Bond Graph modeling
and simulation approach as an aidin
acompletepackaging
systemdesign
process.1.1.
About Bond
graphsBond
graphs(BGs)
wereborn
in
their
presentform
onApril
24,
1959. (Professor
Henry
M.
Paynter
gavea seminar onthe subject,
"Ports,
Energy
andThermodynamic
Systems"atCase
Institute
ofTechnology, Cleveland, Ohio,
USA).
His lectures to
students weregatheredlater into
the 1961 MIT
pressbook "Analysis
andDesign
ofEngineering
His
efforts were motivatedby
his
preoccupation
withthe
logical philosophy underlying
analogies
in
general.Such
concerns were much earlierformalized
by
the
mathematician,Eliakim Hastings
Moore,
in the
following
dictum:
"We
lay
down
afundamental
principleofgeneralizationby
abstraction:The
existence of analogiesbetween
centralfeatures
ofvarioustheories implies the
existence ofa generaltheory
which underliesthe
particulartheories
and unifiesthem
withrespectto those
centralfeatures...
"It took nearly 20
more yearsbefore the BGs became widely known
and employed.The
individuals primarily
responsiblefor this
promotionwere,
mostnotably,
Dean
Karnopp,
Ronald
Rosenberg,
andJean Thoma.
While originally intended for
modeling engineering
systems,
they
have
meanwhilefound
widespreadapplicationin
many
areas of physical system modeling2.BGs
are avery appealing
tool
for
modeling
physicalsystems,
because
they
representthe
flow
of powerthrough
a system.Since
energy
and mass arethe only tradable
goodsin
our physicaluniverse,
aBG
modelis
more
likely
to
reflect physicalreality
than
a modelderived
by
using
any
othermodeling
methodology.Furthermore,
the dynamics
and control of complex mechanical systems and advanced mechatronic systems canbe investigated
moreefficiently
by
using BGs. The
mechatronics systems areusually
complex and combine mixedtechnologies
andthus
mechatronicdesign
requires a good
modeling technique
applicable across a wide range of physicaldomains3
1.2.
Bond
graphs andPackaging Technology
The
functional
representation ofengineering
systems(and
ofpackaging
systems,
too)
describes how the
system works[2].
The design
process shouldinvolve exploring design
alternatives, simulation,
and possible redesignin
orderto
achieve stated goals.Among
criteriafor making
adesign
decision,
meeting
allfunctional
requirementsis
a vital one.The
explanation ofhow
system worksin its
environmentis based
on a model.Modeling
is
usually done manually
and adhoc. It is
alabor
intensive
andtime
consuming
processdifficult
to
validate and reuse.Automated modeling
approach(and
tools),
onthe
otherside,
reducehuman involvement in
modeling
process and ensurethat
modeling
principles arefollowed,
andthat
modelsdeveloped
are more
likely
to
be conceptually
correct.The BGs
are recognized asimportant
techniques
in
automatedmodeling,
systemdecomposition
andcomposition,
simulationand,
quantitative reasoning.They
have been
developed
as a unified approachto
the
modeling
ofdynamic
systemsin
engineering
by
using
a standard set of entitiesto describe
physicalphenomena.The
modelsbased
onBGs
are morecompact and more
easily interpreted using
representation methods such asblock
diagrams,
1
Henry
M. Paynter: The Gestation
andBirth ofBond
Graphs;
http
://www.hankpaynter. com/Bondgraphs.html2
Francois
E. Cellier: Hierarchical Non-Linear Bond Graphs: A Unified
Methodology
for
Modeling
Complex Physical
Systems,
Department
ofElectrical
andComputer
Engineering,
The
University
ofArizona;
http://www.ece.arizona.edu/~cellie^ondgraph.html3
Jozef Wojnarowski: Bond
graphs andmechatronicsystems,Silesian Technical
University,
Department
Mechanics,
Robots
andMachines, Gliwice, Poland;
signal
flows
ordirected
graphs.By
using BGs it is
possibleto
constructknowledge base
containing
models ofengineering
componentsbased
on severalstandard elements.Packaging
systemscanbe
viewed as acollectionofinterconnected
components.Each
component on
its
ownusually
consistsof simpler components and so on.To
representthe
model of a
packaging
system,
agenericmodel of a component shouldbe defined first. The BGs
and
Bond
diagrams
serve as model representationlanguage.
The basic item
ofa modelis
a componentrepresented as an object which contains allinformation
onits
propertiesandbehavior. The
models areheld in
adatabase
which supports common modelmanagementoperations.
The
study
ofthe
systembehavior
canbe
conductedby
simulation.Prior
to
simulation
the
modelis
processed.The integration
ofthe
system equationsis
providedby
a suitabledifferential
algebraicequation solver.1.3.
Distribution
Packaging
The
goalin distribution packaging (transport packaging) is
to
providea correctdesign for
packaging
sothat
its
contents arrivesafely
atdestination (it does
notinclude packaging for
consumergoods,
such asthe
primary packaging for
food,
beverages,
pharmaceuticals,
andcosmetics)
withoutusing too
much ortoo
little packaging
materials.The design
ofdistribution
package musthave that
goalin
mind.Since distribution packaging
must always
be
economicalit
shouldbalance
productionprotection,
ease ofhandling
andstorage,
shipping
efficiency,
manufacturing
efficiency,
ease ofidentification,
customerneeds,
and environmental
responsibility
to
achievethe lowest
overall cost.1.3.1.
Hazards
in Distribution
The
product mustbe
protectedduring
distribution
from damage
ordestruction
and,
likewise,
if
the
productis
hazardous,
people andproperty
mustbe
protectedfrom
the
product.For
consumer
goods,
the
retailer expectsto
receive anattractive, unblemished,
salable packagecontaining
an undamaged product.The
package-productsystem shouldbe designed
to
withstand
the
rigors ofthe distribution
environment.From the
point ofthe
product'screation, the
product-packaging
system mustsurvivethe
hazards
encountered untilit
reachesits
final
destination,
at whichtime the packaging may be discarded
or recycled.The hazards
ofdistribution
aremany
andvaried,
andit is usually difficult
orimpossible to
predictexactly
what aproduct-package system
is going
to
encounter[1].
1.3.2.
Distribution Environment
The
first step in
designing
an effective package systemis to determine
the
severity
ofthe
shipping
environment[3]. Information
ondistribution
environmentprovidesthe packaging
professionals withthe
data
on whichto
base decisions in these
areas.Improvements in
distribution
equipment,operating
procedures,
andrecording devices
overthe
last
several yearshave
resultedin
a needfor
newdata
to
establishor reconfirm shockand vibrationenvironmental profiles of
today's distribution
systems.However,
caution shouldbe
expressedbefore
heading
out andmeasuring
the
environment.Defining
environmentsis
not as simple asshipping
afew data
recordersthrough
adistribution
channel.It is
acomplex,
long,
drawn
outstudy requiring
more resourcesthan
typically
onecompany
caninvest
[4].
Evaluation
ofthe
product'sdistribution
method candetermine
whichhazards the
productis
likely
to
comeacross,
as well asthe level
ofintensity
ofthose
hazards. Then the
package system canbe designed
accordingly.Package
handling, transportation,
and storage canlead to
avariety
ofhazards
withinthe
vibration,
temperature
extremes,
andcompressionloads. The
method ofdistribution
greatly
influences the
presence andseverity
ofthese
hazards,
sounderstanding the shipping
environment
is
essentialto
designing
a packagethat
willeffectively
protectits
product.There
arefour different
ways ofdetermining
the
environmentthrough
whicha productis
shipped:
observation, damage
claims,
literature
search,
anddirect
measurement.These techniques
canbe
usedindividually
orin
conjunction with each other[3].
1.4.
Vibrations
As
a package movesthrough
distribution,
we needto
be
concerned withthe dynamic forces
encountered
due to
manhandling
(dropping,
throwing
and other abusesdue to
manualloading,
unloading
and movementsofpackages),
warehousehandling
equipment(stresses
appliedby
mechanicalhandling
equipment such asforklifts,
conveyors, etc.),
vehicleimpacts
(starting,
stopping
and otherjolts due to the
movement oftrucks,
railcars,
ships,
andaircraft),
vehicle vibrations(the
naturally
occurring
vibrationsresulting from the
motion ofengines andmoving
contact of
the
vehicle withhighway
andrails)
[1].
These four
sets of conditionsmay
resultin impacts
and vibrationsto
our product-packagesystem.
Package
systemsmay be designed
to
minimizethe
damage
causedin
distribution,
but
sometimes
the
productitself
mustbe
redesignedin
orderto
survive[1].
Vibration is
associated with alltransportation modes,
although each modehas its
owncharacteristic
frequencies
and amplitudes.Frequencies
above100 Hz
areoflittle
concernto
most
packagers,
because in
mostpackaging
situations,
the
product willbecome
isolated (that
is,
its
vibration output willbe less
than the
input received)
atthese higher frequencies. The
mosttroublesome frequencies
arebelow 30 Hz because
they
are most prevalentin
vehicles,
andit is
difficult to
isolate
productsfrom them
[5].
Truck
vibrations,
for
example,
occurpredominantly
atthe
naturalfrequencies
ofthe load
onthe
suspension
system,
ofthe
unsprung
mass ofthe tires
againstthe
suspensionsystem,
and ofthe trailer
andbody
structure.They
are exacerbatedby
the
condition andirregularities
ofthe
roadbed,
the
engine anddrive
train,
tire
and wheelimbalance,
andthe
dynamics
ofthe
loading,
or
freight
[5].
Vibration damage
often occursdue
to
relative motion.Reducing
oreliminating
relative motion(wherever
one partis free to
move againstanother) lessens this type
of vibrationdamage. Tight
shipping
casedimensions,
particularly in the
verticalaxis,
arepreferred whereverthis
is
compatible with
top
load
compressionof product and package[5].
Vibration
resonance occurs wheneverthe
forcing (input)
frequency
is the
same asthe
naturalfrequency
ofthe
product and/orthe
package system.Resonance
exists notonly for the total
assembly,
but
alsofor
parts orsubsections withinthe
total
structure.For
protectivepackaging
purposes,
allresonancepoints shouldbe located
andquantified.This is done
by
subjecting
the
productto
a range offrequencies
andby
observing the frequencies
at which a resonanceconditionoccurs.
For packaging
purposes,atypical
resonance search mightsweep the
frequencies
between
3
-100
Hz
at0.5-1
.0octave per minute
(refer to ASTM D 999). The
search shouldbe done in
all axes[5].
Damage
causedby
resonance vibrationcanbe
difficult to
resolve.The
problemis
complicatedin that
allcushioning
materials are resilientand,
whilethey
areacting
to
attenuatethe
shock,
they
are alsoacting
as aspring
responding
to
vibrationinput. For many applications, it has been
cost-effectivemethodof
decreasing
damage. The
measure oflast
resortis to design
avibration-isolation
cushioning
system[5].
Occasionally,
entireloads
gointo
a stack resonancecondition,
where eachsucceeding
container goes
into
resonancewiththe
previous container untilthe
entire stackis
bouncing,
creating
conditionslikely
to
cause excessivedamage
[5].
Materials
usedto isolate from
vibration arefor the
most partthe
sameasthose
usedto
isolate
from
shock.An ideal
vibration-isolation providesisolation in
the
3-100
Hz
range,
sincethese
arethe
predominantfrequency
rangesthat
causedamage
during
transport.
However,
cushioning
materials,
like
all othersprings,
alsohave
characteristic resonance points.A properly
selectedisolation
material resonates at aninput
frequency
that
is less
than
half
ofthe
product'sresonance
frequency
[5].
1.4.1.
Distribution
vibrationsVibration is
encounteredin everyday life. Packaged items passing
through
distribution
systemencounter vibrations.
It is those
complex mechanicalvibrations,
andthe
accompanying
changesin
acceleration,
whichmay lead
to
physicaldamage. It is necessary to
examine whathappens
to
anobject,
packaged orunpackaged,
in the distribution
environment whenit is
subjectto
outside
vibrations,
and we wouldlike to
predictbehavior resulting from distribution
vibrations[1]-Vibration is
associated with alltransport modes,
although each modehas its
characteristicfrequencies
andamplitudes.Vibration
damage
cantake
severalforms.
Scuffing
and abrasioncanoccur wherever one part
is free
to
move against another.Many
particularproducts sifts or settle when vibrated andthis
leaves
an open voidatthe
top
ofthe boxes
andbottles,
whichthe
consumer
invariably
interprets
as an under-fill.The energy developed
onthe
outputsideduring
a resonance condition cando many
things:
fatigue
andfinally
fracture
metalcans andpails;
flex
and crackdelicate
circuitson circuitboards;
disintegrate
or otherwise alterthe
texture
offood
products;
separate and settle granular componentsin
afood
product or settleloose
protectivefill;
aggravatescuffing
and abrasion problemsby
severalorders ofmagnitude;
causeindividual
containersor componentsto
bang
into
oneanother;
disturb
pallet patterns ordunnage
(load-securing)
systems;
initiate
stackresonance;
unscrewbottle
caps andthreaded
fasteners.
The
greatestvibrationinput in
atypical truck
is
directly
overthe
rear wheelsandtailgate.
If
damage
is
restrictedto,
oris
most severein
that
sectionofthe vehicle,
vibrationinputs
arealmost
certainly to
blame. Vibration
inputs
arealsousually the
sourceif damage
seemsto
occuronly in the
productlayer
nextto the
pallet or atthe
top
layers
[5].
1.4.2.
The
Natural
Frequency
When
aforce is
appliedto
a systemsetting it in
motion andthen
withdrawn,
the
system willvibrateat a precise
frequency.
This
frequency
is
defined
as naturalfrequency
(fn).
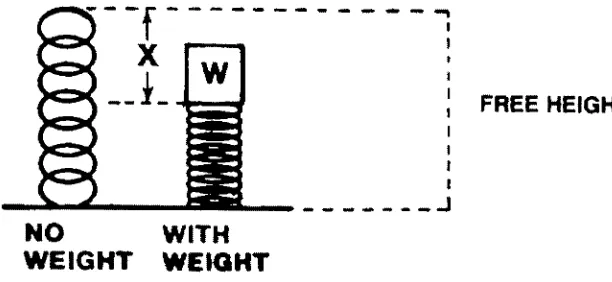
Spring-mass system shown
in Figure 1
. will vibrate withthe
samefrequency
onceit is
setinto free
motion.
It
will oscillateaccording
to the displacement
equation:x=
Asin(wf)
(1)
The
mass on aspring,
shownin Figure 1
.,is
anideal
modelfor
a productin
whichwe wouldlike
to
predictthe behavior resulting from
distribution
vibrations(product
on cushions orstructuralcomponents
in
products).FREE
HEIGHT
NO
WITH
[image:12.504.96.402.104.245.2]WEIGHT
WEIGHT
Figure 1
.A Mass
on aLinear
Spring
1.4.3.
Vibrations
ofPackaged Products
For
packaging
we are concerned withthe
maximumvelocity
and withthe
maximum accelerationof a product.
If
wehave
a product of mass m(kilograms
orlb)
supportedby
a piece of cushionmaterial,
weassumethat
it behaves
as alinear
spring.At
restthe
cushionis depressed
(5St)
from the level
ofthe
unloaded condition.If
we setthe
product-cushion systeminto
motionby
depressing
the
productdownward from
the
resting
position andthen
releasing
it,
the
product(or
mass)
will vibrateindefinitely
between the
depressing
distance
andthe initial
position,
if
weassume
that there
is
nofriction
ordamping.
We may
also approximatethe
motionof atrailer truck
traveling
on ahighway by
the
sinusoidal motion of alinear
spring-mass system(truck
body
andthe
load
arethe
mass,
andthe
suspension system
is
alinear
spring;
althoughthese
springs arereally
notlinear,
the
useableparts of
the
springs whenworking
together
arevery
closeto
being
linear). An
externalforce
setsthis
spring-mass systemin
motion whentruck
goesover apothole,
expansionjoint,
or someother road surface
discontinuity.
From
empiricalinvestigation
and mathematical analysisthree
general statementsrelating the
input
and output vibrationsmay be
made[1]:
The
outputvibrationwill occurwiththe
samefrequency
asthe
forcing
vibration(not
atthe
natural
frequency
ofvibration).There may be
otherfrequencies
presentin
the
vibrationresponse
to
the
forcing
vibration,
but the
amplitudesand accelerations associated withthese frequencies
are much smallerthan those
of vibrationatthe
forced
frequency,
ff).
The
outputamplitudeofvibrationofthe
spring-mass systemis
directly
relatedto
the
input
amplitude of
the
forcing
vibrationby
a calculablenumber, the
magnificationfactor:
Output
Amplitude
=Input Amplitude
xMagnification Factor
The
maximum acceleration experiencedby
the
spring-masssystemis
directly
relatedto the
maximumacceleration associatedwith
the
forcing
vibration multipliedby
the
samemagnification
factor:
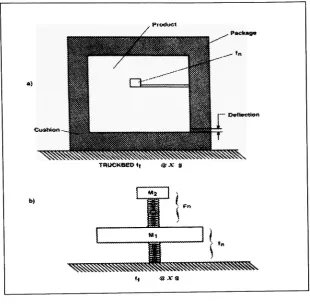
Figure 2
shows aproduct-packagesystem.The
producthas
asmallinternal
component,whichis known
to
have
a naturalfrequency
(this may be
asmallcircuitboard,
transistor
orsimilarmechanical/electrical part).
When the
productis
placedin
the
packageacushiondeflection
(8St)
is
observed.c<x*uet
!
^^
TBUCKBEOIf X a
2
b)
Ml
](
r
f xa
Figure
2. A
Product-PackageSystem
To simplify
matters andhelp
formulate the
problemthe
modelshownin Figure 2b may be
used(the
productis
depicted
asamass(MO
on alinear
spring
representing the
cushion).A
product-packagesystem reducedto its
simplestform is
shownin
Figure
3.
iff
gnmcAL Biemm
M2.
PRODUCTM3.
CONTAINERcmmoN
The
product-packagesystemconsistsoffour basic
components:the
outercontainer,
the
cushion,
the
product,
and acritical element.The
critical elementis the
mostfragile
componentof
the
product(e.g.,
the
filament
ofthe
radartube). It is the
partthat is
mosteasily damaged
by
a mechanical shock or
by
vibrations.1.4.4.
Forced
Vibrations
andProduct
Sensitivity
The
vibrationsensitivity
of a productmay
be defined
asthose
input
vibrationfrequencies
of sufficientamplitudeoccurring
in
the
distribution
environment,
which can causethe
resonance andfailure
ofthe product,
or of acomponentwithinthe
product.Information
onthe
vibrationsensitivity
may be
used eitherto properly design
a package systemthat
will minimizethe
product's responseto the input
vibrationsin
distribution,
orto
redesignthe
product.The
three-step
methodis
usedto
determine
vibration sensitivity:Identification
ofthe
naturalfrequencies
ofthe
productIdentification
ofthe
naturalfrequencies
which occurin
the
distribution
environmentDetermination
weatherfailure
occurred whenthe
product was vibrated atthe
sensitivefrequencies
atthe
amplitudesencounteredin the distribution
environment.To
develop
aprecise,
low-cost
packagefor
productprotection,
somefundamental information
about
the
productis
needed.To
protectthe
productfrom
shock,
afragility
level
mustbe
determined.
Fragility
is the
maximum acceleration andvelocity
changethe
productcanwithstand
before damage
occurs.This information is
chartedto
form
adamage
boundary
curve.A
productgenerally
has different damage
boundary
curvesin
each orientation ofthe
product.Ideally
the
fragility
level is determined experimentally through
atest
procedure such asthe
American
Society
for
Testing
Materials
(ASTM)
D
3332
"Test Method
for Mechanical-Shock
Fragility
ofProducts,
Using
Shock
Machines."Due
to
productavailability
andthe time
neededto
perform afragility
assessment, the
fragility
level
is
oftenderived
through
estimation.Once the
shockfragility
is
known for the product,
cushioning
materialthat
providethe
necessary
protection canbe
selected.Historically,
the
use of cushion curveshelps
adesigner
identify
the
material;
andthickness
andloading
rangebased
on a pre-determineddrop
height
and required accelerationlevel.
Ranges
ofthickness,
impact
anddrop
heights
aregenerally
providedfor
a given material.By
comparing cushioning
curves of various materials(generated using the
sametest
method),
acushioning
material withthe
least
amount of surface area andthickness
canbe
chosen.
Ideally
the
effectsof vibration onthe
product should alsobe investigated
whendesigning
a cushion system.Products
typically
containa number ofcomponents,
eachhaving
a unique responseto the
vibrationinput.
By
performing
a vibrationtest
onthe
product withoutpackaging,
the
dominant
responsefrequencies
ofthe
product elements canbe identified.
Resonant frequencies
of productscanbe identified
by
using
the
ASTM D 3580 "Standard Test
Method
ofVibration
(Vertical
Sinusoidal
Motion)
Test
ofProducts"orthe
ASTM D 51 12
"Standard Test Method for
Vibration (Horizontal Linear
Sinusoidal
Motion)
Test
ofProducts."The
objectivein
designing
a packageis
to
avoidoverlapping
product elementresonance,
as wellasamplificationrange ofthe
cushioning
material(per
loading
andthickness)
andsignificant environmentalinput
frequencies
for
the
intended
modeoftransportation.
Since the
vibrationtest
equipmentis
quitesophisticated,
cushiondesigns
are often createdbased solely
on shock.Vibration
evaluation of a packagegenerally
occurs oncevibratory
damage
producedin the
distribution
environmentis
recognized.Limited data
on vibrationis
another reason
why it is
notinitially
consideredin
adesign.
Most
previously
publisheddata has
become
obsoletedue to
changesin manufacturing
processesfor
many
oftoday's
cushioning
Additional
factors besides
shock andvibration,
suchaseconomics,
materialavailability, volumerequirements,
etc.,
alsoplay
a rolein
selecting
acushioning
material.However,
shock and vibrationcharacteristicsarethe
key
elements[6].
1.4.5. New Trends in Vibration
Testing
New trends in
vibrationtesting
are4:Using
Environmental
data
obtainedfrom field data
recorderThis data is then inputted into
a computer controlled vibration machineThis type
oftechnology
brings the
actualshipping
environmentthe
product experiencesinto the
laboratory
and enables usto
recreatethe damage
potentialthe
package would encounter.Large
companies aredoing
vibrationtesting
before
shock ordrop
testing,
i.e.,
they
design for
vibration protection
first (since
a product always experiences vibration and studies showthat
high
drop
heights
are unlikely).In
otherwords,
vibrationis
certain,
whereas shock ordropping
is
probable.
When
a compromisebetween
shock and vibrationis
made,
most companies will now chose vibration protectionfirst.
From the data
obtainedfrom the field data
recorder adynamic
vibrationcushion curve canbe
developed. In the
nearfuture
vibration cushion curvesbased
ongeometric shapes willbe
available
to the packaging
industry
(in-package
test
method).Packaging
designers face many
challengesin predicting the
performance ofcushioning
materials whendesigning
protective packaging.A
prime objectiveis to
choosethe
propercushioning
materialthat
would protectthe
productfrom hazards
ofthe distribution
environment(shock
and vibration).An
additional goalis to
achievethe
most cost-effective package possibleunder given parameters.
Historically,
shock attenuation characteristicsfor cushioning
materialshave
been
presented as a material characteristiconly
(ignoring
other variablesin the
package~the
container,
friction,
and air-flowdynamics)
whichmay
resultin (or lead
to)
a packagethat
fails to
optimize cost and/or performance.Shock
attenuationis commonly
presented as acushioning
curve,
whichis
a plot of peakacceleration
in G's
vs.staticloading,
andis
usedto
compareandqualify
materials and packagedesigns. The
methodin
whichcushioning data
arederived determines
how
it
canbe
usedfor
agiven purpose.
While
amaterialcharacteristictest
is
suitablefor
material comparisons andqualifications,
it is
not certainhow
applicableit is for
packagedesign.
A
major supplier of protectivepackaging
solutionshas developed in-package
test
methodsfor
evaluating
shock andvibration characteristicsofcushioning
materials overthe
pasttwo
decades.
To better
predictpackage performance comparedto traditional
methodsPackage
designers
can usedata
based
onthese
methods[6].
Though there is
noindustry-accepted test
methodfor
determining
the
vibration responses ofcushioning
materialsfor
packaging, there
have
been many
attemptsto
create such a method.Cushioning
responsecharacteristicsto
vibrationareknown
as vibrationtransmissibility.
Vibration
transmissibility
of acushioning
systemis
expressed as a non-dimensional ratio ofits
response amplitude
to
the
excitation amplitude.The
ratiomay be
one offorce, displacement,
velocity,
oracceleration.The
shape of atransmissibility
curveis dependent
onthe
degree
ofdamping
in the
system.The
closestthe
industry
has
cometo
adopting
a standardfor
vibrationtransmissibility
-though
it
wasfar
from
being
accepted- wasin
the
late
1970s.
The U.S. Air Force
published anextensive amount of
data
oncushioning
materialsbased
uponatest
methodit developed. The
test
method anddata
were publishedin the
MIL-HDBK-304B,
"Military
Standardization
Handbook,
Package
Cushioning
Design."Problems
associatedwiththe
military
method,
whichtried to
replicate atrue
single-degree-of-freedom spring-massmodel,
included the
introduction
of unwanted noise
into the
system andpreventing
the test block from
leaving
the
cushionsample.
Adopting
the
principlesdiscussed in Part I
(PT&E,
March
'97,
p.26)
[6]
for
the in-package test
for
shock,
a major supplier of protectivepackaging
solutionshas developed
atest
methodfor
generating
vibrationtransmissibility
data
oncushioning
materials.Using
the
samein-package
set-up,
the test
packageis
placed on a vertical sinusoidal vibration machine.A
frequency
sweep
from 5 to 150 Hz
andback to 5 Hz is
conducted at one octave per minute at a0.5
G input (the
rateand
input is
referencedto the ASTM D 999 "Standard Methods for Vibration
Testing
ofShipping
Containers"). A
vibration accelerometeris
attachedto
the test block
to
measurethe
vibration response
through the
cushion system.The frequencies
at whichcoupling, resonance,
and attenuation
take
place canbe identified for
the
thickness, loading,
and material under evaluation.It is
possiblethere
couldbe different frequencies for
coupling, resonance,
and attenuationbetween the sweep from 5
to
150 Hz
andthe sweep from 150
to
5 Hz.
This
occurs whenthe
cushion under
test
breaks down
during
amplification.On
the
secondsweep,
the
transmissibility
curve
is generally
offsetto
the
low
frequency
side ofthe initial
curve,
thus
an average ofthe
two
frequencies is
consideredfor
coupling, resonance,
and attenuation[6].
Computer Aided
Engineering (CAE)
methods are usedfor
computersimulation and analyzes ofdynamic engineering
systems.They
are well suitedfor modeling behavior
of a complexmultidisciplinary
systemin
a unified way.Recent developments
ofthis
methodology based
on object-oriented approach and symbolic computational algebra supporthave
widened,
evenmore,
the
capabilities ofthis
methodology
to
deal
with realengineering
systems.Consequently,
CAE
methods canbe
usedfor
simulation oftesting
productbehavior
(characteristics)
whenthey
are exposed
to different kinds
ofstress,
including
vibrationsand shocks.Using
simulationit
shouldbe
possibleto
predictthe behavior
of asystem subjectedto
vibrations.
Results
obtainedby
employing modeling
and simulations shouldthen
be
comparedto the
resultsobtained onthe
testing
table (experiment).
Bond Graphs based
approachin
computeraidedtotal
Packaging
Distribution
Design
processshould speed
up the
completedesign
processby
continuousevaluationby
simulation after eachdesign/change
step,
sothat
the
finished
packagedesign
could meetdesign
objectives.That
approachshould also enable us
to
shortencompletedesign/testing
process,
and also sparethose
expensive parts(products)
from
destruction
during
the
testing
process(e.g.,
testing
for
resonant
frequencies).
2.
Vibration
Testing
Natural
frequencies
of a product areusually
identified
using
aVibration Table
capable ofproducing
sinusoidalmotion.The
productis securely
attachedto the
table,
andthe
systemis
vibratedat
frequencies between
3
and100 Hz
withan associated maximum acceleration ofbetween
0.1 to 0.5
g's(zero to
peakamplitude).A
constant0.5
g'sis commonly
employedthroughout
the
frequency
rangesweep.The
naturalfrequencies
ofthe
products arethose
whichcause components
to
resonate, identifiable
eithervisually
orby
the
intense
sounds ofthe
vibration.
The
frequency
sweep may be
interrupted
andthe
frequency
kept
constantto
confirmthe
resonantfrequency
andthe
componentaffected.This
proceduresimply
identifies the
naturalfrequencies
ofa productin the
range of3 to 100 Hz. The
naturalfrequencies may
ormay
notbe
the
breaking
points ofthe
product[1].
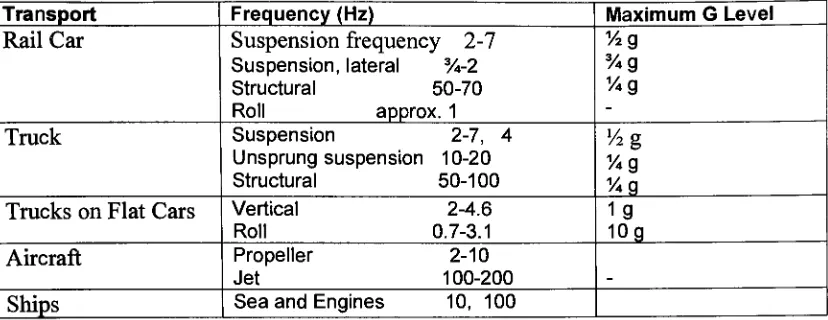
Table 1
.Vibrations
Encountered
in Distribution
Transport
Frequency (Hz)
Maximum
G
Level
Rail
Car
Suspension
frequency
2-7
Suspension,
lateral
%-2
Structural
50-70
Roll
approx.1
1/2g
%9
%g
Track
Suspension
2-7,
4
Unsprung
suspension10-20
Structural
50-100
'/2g
%g
Tracks
onFlat Cars
Vertical
2-4.6
Roll
0.7-3.1
ig
10g
Aircraft
Propeller
2-10
Jet
100-200
Ships
Sea
andEngines
10,
100
It is important to
emphasizethat
if any
ofthe
naturalfrequencies
ofthe
product matchup
withfrequencies occurring in the
proposeddistribution
system,
carefulproducttesting
is
needed.2.1.
Vibration
Test Methods
Standard test
methodsfor
vibrationtest
of products aredefined
by
the ASTM
standards.The
test
methods coverthe
determination
of resonance of unpacked products andcomponentsapplied
to
the
surface on whichthe
productis
mountedfor
test. Information
obtainedfrom the
test
methodsmay be
usedfor
productmodification.This may become necessary if
a product'sresponse requires
design
of animpractical
orexcessively costly shipping
container.Referenced
ASTM Documents for
vibrationtest
methods are:D 3580
Test
Method
ofVibration (Vertical Sinusoidal
Motion)
Test
ofProducts
D 4332
Practice
for
Conditioning
Containers, Packages,
orPackaging
Components
for
Testing
D 51 12
Test Method
ofVibration (Horizontal Linear Sinusoidal
Motion)
Test
ofProducts
E 122
Practice
for Choice
ofSample
Size
to
Estimate
aMeasure
ofQuality
for
aLot
or
Process
D 996
Terminology
ofPackaging
andDistribution Environments
A
vibrationtest
machine consists of aflat
horizontal test
surface of sufficient strength andrigidity
sothat the
appliedvibrationsareessentially
uniform overthe
entiretest
surface.The
test
surface should
be
driven
so asto
moveonly
horizontally/vertically
along
a single axisin
sinusoidal motion
(rotary
motionis
notacceptable).The
frequency
and amplitude of motion shouldbe
variable andunder controlto
coverthe
specified range(test intensities
shouldbe
sufficient
to
vibratethe
productatacceleration andfrequency
levels
that determine
if
product resonanceoccursin
the
expectedfrequency
range ofthe transportation
environment).Experience
has
shownthat individual
transportationenvironmentsmay
containfrequencies
ranging from 0.2 to
above100
Hz.
Accelerationlevels
sufficientto
excite resonancenormally
range
from 0.1 to 0.5
g.[7]
[8].
Specimen-Mounting
Devices
ofsufficient strengthandrigidity
are requiredto
attachthe
productsecurely to
the test
surface.The
resonantfrequency
ofmounting device
shouldbe
abovethe
intended test
rangefor
the
product.The
device(s)
should supportthe
productin
a mannersimilar
to
the
way in
whichit
wouldbe
supportedin its
shipping
container.Relative
motionbetween
the
test
surfaceandthe
productshall notbe
permitted[7]
[8].
5
[1]
Brandenburg
andLee:
FundamentalsofPackaging
Dynamics,
2ndEdition,
MTS
Corporation,
Minneapolis,
USA,
1985
2.2.
Experiment
-Determining
the
Natural
Frequency
of anInternal Product
Component
(Critical
Element)
2.2.1.
Description
ofTesting
Product Model
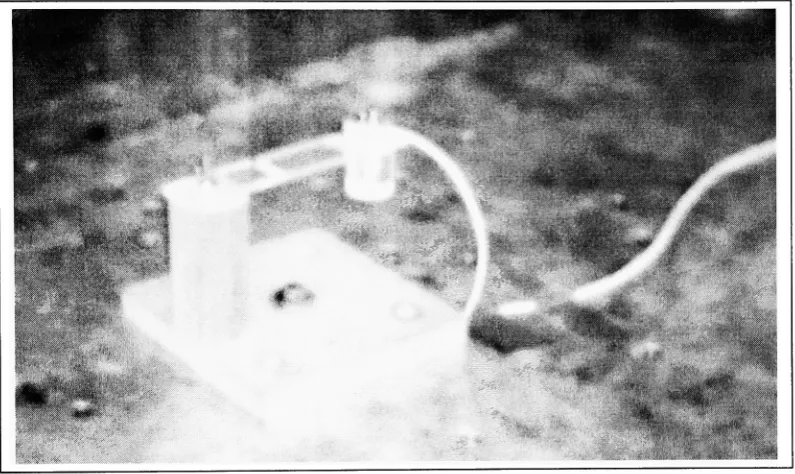
Actual
model ofthe
productthat
has been tested is
shownin Figure 4. As described in
section1
.4.3.(Vibrations
ofPackaged
Product)
ofthis
work,
and as shownin Figures 2
and3,
the
physicalmodel of
the
productthat
wastested
had
a critical element.That
criticalelement(cantilever
beam)
made ofPlexiglas
wasthe
mostfragile
componentofthe
product model.It
[image:18.504.54.452.198.435.2]was
the
partthat
wasmostsensitiveto damage
by
vibrations.Figure 4. Model
ofthe
Product That Has
Been
Tested
Product
modelwas made of wood andPlexiglas;
Base
-Oak,
Post
(support)
-Pine
and
Clamped
beam
(cantilever)
with clamped weight(internal component,
criticalelement)
-Plexiglas.
The
modelofthe
producthas
been
fixed securely
to
the
horizontal test
surfaceby
a screw.The
test
surfacehas been
driven to
moveonly
vertically
along
a single axisin
a sinusoidal motion.Relative
motionbetween the test
surfaceandthe
productis
not permitted.Figure
5
showsProduct
Model
developed
withl-DEAS
software(SDRC
Inc.,
USA)
'(.-.-. _JSU
<i
[image:19.504.45.461.85.407.2]zl
Figure 5.
Testing
Product Model
-Model
developed
withl-DEAS
softwareIn
Figures
6a
and6b
physicaldimensions
ofthe
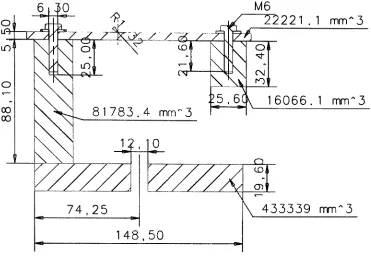
productmodel are shown(front &
top
view)
22221
.1
mm-3
74,25
148,50
16066.
1
mrrT3
[image:20.504.76.447.96.356.2]433339
mm"3
Figure 6a. Physical Dimensions
ofthe
Product Model (front view)
?4,83
9 ea
"Ott
lO*
U~)
-P4
o
O
-+
27,30
o 00
o
lO
CD
Z^
64,24
59,50
+
-00
m
-P4
Figure
6b. Physical
Dimensions
ofthe Product Model
(top
view)
[image:20.504.99.427.407.654.2]The
Product
System Model
reducedto
its
simplestform is
shownin Figure 7. That
modelmay
be further
reducedto something that
wemay investigate
mathematically.Internal
component
(Critical element)
J
m
[image:21.504.144.384.108.270.2]Vibration Table
Figure 7. The Reduced Product System Model
2.3.
Testing
Machine
atthe
R.I.T.
Vibration Machine Test System
atthe R.I.T. is Lansmont
model7000-10
(Lansmont
Corporation, Monterey, CA,
USA).
Characteristics6ofthe
vibration machinetest
system are shownin Appendix 1
.6
Instruction
manualfor
theLansmont
model7000-10,
TouchtestVibration
System;
Lansmont
Corporation,
Ryan
ranch researchpark,5 Harris
Court, Building N, Monterey,
CA
93940-5739
2.4.
Experiment
The
experimenthas been
performed on aLansmont
model7000-10
vibrationtest
machine.The
frequency
and amplitude of motion were variable and under control.The
product(model)
tested
vibrated at acceleration andfrequency
levels that determine if the
product resonance existsin
the
expectedfrequency
range.The
frequencies
rangedfrom 3
to
100 Hz.
Acceleration
level
to
excite resonance was
constant,
0.5
g.The
naturalfrequency
of a cantileverbeam is identified using
aLansmont
vibrationtable
capable of
producing
sinusoidal motion.The
product(model)
wassecurely
attachedto
the
table,
andthe
system wasvibrating
atfrequencies between 3
and100 Hz
with an associatedmaximum acceleration of
0.5 g (a
constant0.5
g'sis commonly
employedthroughout the
frequency
range sweep).2.4.1.
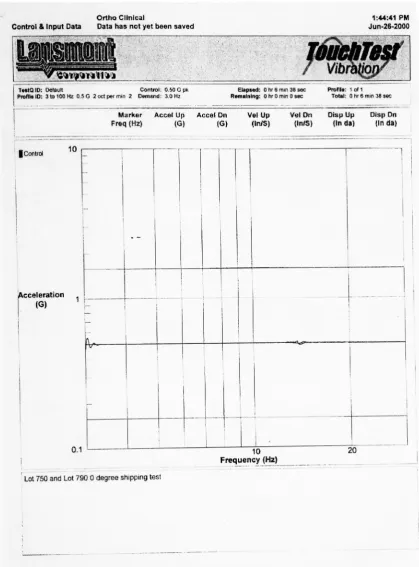
Experiment Results (Natural
Frequency)
Natural
frequency
ofthe
clampedbeam
(cantilever)
with clamped weight- all made ofPlexiglas
- obtained on vibration
table
was26.777 Hz.
It
canbe
seen on resultdiagrams,
Figure 8 (Part
1
and
Part
2).
It
shouldbe
notedthat
some ofthe
factors
affected accuracy.Those factors include: the
fixturing
andmounting
methodsfor the
accelerometers,
and relative motionbetween the
test
surfaceandthe
product(model)
tested
(it is
not permitted).OrthoClinical
Control&InputData Data hasnotyetbeensaved
/
Vib,
TusrtQID: Prodis ID:
default Control; 0.50 Gpk
3 to100Hz 0,5 G 2octpermin 2 Demand: 3.0 Hz
Elapaed: 0 hr Qmin38sec
Remaining: ohr 0rmn0sec
Profile1of1
Total: 0hr8civin33see
Marker AccelUp AccelDn
Freq (Hz)
(G)
(G>
VelUp
(tn/S)
VylDtt Oiap
Up
Otsp
On(in/S) (m
da)
(Inaa)IConwl 10
Acceleration
V-0.1 10
Frequency (Hz)
20
Lot750andLot7900degreeshippingtest
Figure
8 (Part 1).
Result Diagrams
for
Model
Testing
atthe R.I.T.
Laboratory
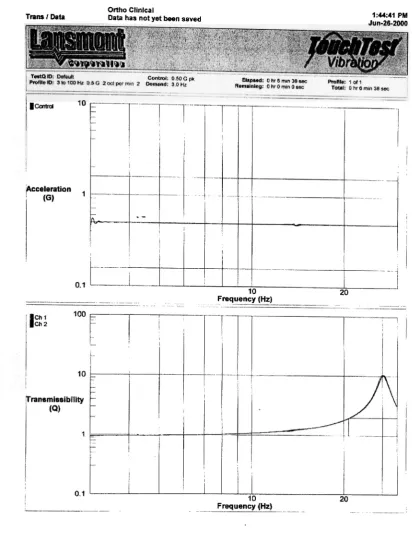
[image:23.504.43.463.50.618.2]TransIData
Ortho Clinical
Datahasnot yetbeansaved 1:44:41PM
Jun-26-2000
Tetto.ro. Defend Control: OSOGpk
Profile10: 3 to 100 Hs0.85 Zoclpermrn2 Demand:3.0 Mj
ICcrrtrol 10
Acceleration
(Q)
0.1
Cll2
100
10
Transmissibility
(Q)
0.1
Elapud: 0 hr 0mm38eec Profile; 1of1
rUmainlna:0 hf 0mm0sec Total:ohra mmMaec
10
Frequency (Hz)
10
Frequency (Hz)
-iV :
,..
20
i
i
l
20
Summary
-TransOrthoClinical
Data hasnotyetbeensaved
.:
xj**ii9iiii*i_
ChannelDescription:
Fn TransUp Trans Dn to Limit HI Limit
(Hi) (Q) (Q) (Hz) (Hz)
Ch 2|Channel2 26777 10 11 10.49 20.749
30.061"
Figure 8 (Part 2). Result Diagrams for Model
Testing
atthe R.I.T.
Laboratory
[image:24.504.36.449.53.592.2]3.
Bond Graphs Based
Object Oriented Approach
to
Determination
ofNatural
Frequency
This
sectiondeals
withthe
development
ofthe Bond Graph
modelofthe
productmodeldescribed
in section2.2.1.
(Description
ofTesting
Product
Model).
Based
onthat
model predictions ofthe dynamic behavior
andthe
vibration characteristicsof
the
model subjectedto
vibrations
based
onthe Bond Graph
methodology
couldbe
obtained.In this
workthe
approach givenin
reference[2]
wasfollowed.
3.1.
Model
Representation
The
solution ofthe
problemis based
on a model(a
model of a system).For that
purposethe
system
is
simplifiedby
abstracting
its
observable attributes.Attention is usually
paidonly to the
features that
are relevantto the
problembeing
solved.Based
on such anidealised
picture, the
system
is described in
a suitableform,
andthis
is
used as abasis for the
solution ofthe
problem.
Simulation
models are usedto
simulatethe behaviour
ofengineering
products and processesin
their
environment.By
experimenting
on modelsinstead
of realequipment, its behaviour
canbe
studied evenbefore it is built
and purchased.Consequently,
Simulation
models canbe
used at various stages ofdesign
-from the early
stages ofconceptualdesign to the final
prototypetesting.
Modeling
andsimulationplay
animportant
rolein the design
of such products.The
conceptofSystem
plays a central role whenbuilding
a modelfor
a particular problem.We pay
attentiononly to that
part which we areinterested in. Such
partis termed the
systemfor
the
given problem.Everything
that is
notincluded in
the
system constitutesits
environmentFurther
modeldevelopment is
more concerned withthe
systemthan
withits
environment.We
usually
speak of a model of asystem,
but it is
understoodthat there is
anenvironment,
whichthe
systeminteracts
with.These interactions
arerelatively
simple and canbe described
by
actions at
the
boundary
ofthe
system.The
systemusually
consists of components.Decomposition
of a complex systeminto its
componentsgenerally
simplifiesthe modeling
task
and gives abetter insight into the
structure ofthe
system.When
doing
that
it is very
usefulto
retainthe
structure ofthe
systemin the
modeltoo.
If
systemdecomposition is to be
continuedfurther,
every
component shouldbe treated
as another systemconsisting
of simpler components.At
eachlevel
ofdecomposition the
model ofthe
corresponding
component canbe
represented ascompounded,
i.e.,
consisting
of simplercomponentmodels.
Finally
alevel
is
reached wherecomponents aretreated
aselementary
ones,
i.e.,
notconsisting
offurther
simplercomponents.Such
components are modeled as entities anddefine the level
ofdetail
ofthe modeling
process.It
shouldbe
pointed outthat
it is
notnecessary that the
model structurecorrespondto that
ofthe
physical systemin
alldetails.
We usually
start off withrelatively
crudemodels,
anddetails
are added
later
by
elaborating
the
models oftheir
components.Top-down
systemdecomposition
andbottom-up
compositionare powerfulmodeling techniques.
To
usetheir
full
powerit is necessary do define how to
modelcomponentsthat
wetreat
as entities(elementary
components)
andhow
to
describe interactions between them. In
engineering
it is
naturalto base
these
considerationson physicalreasoning using knowledge
from
variousbranches
of physics.Such
an approachis
sometimestermed
physicalmodeling
[9].
Processes
taking
placeinengineering
systemsgenerally
belong
to
various physicaldomains
eg.,
rigidand solidbody
mechanics, fluid mechanics,
electricity
andmagnetism,
semiconductorphysics,
thermodynamics
andothers.It
meansthat
wehave
to deal
with multi-domainphysical processes.One
well-known approachin
engineering
designed
to
deal
with such multi-domainphysicalproblemsis
the Bond
graphmethod ofHenry
Paynter.
The Bond
graph methodusesthe
effort-flowanalogy
to
describe
physical processes[10 111
Processes
are representedgraphically
in
aform
ofelementary
components(bond
elements)
with one or more ports.The
process "seen"at a portis
described
by
a pair of effort andflow
variablesthe
productof which is power.Such
variablesare called powervariables.There is flow
of powerthrough every
port in or out ofthe
component.The direction
ofthe
powerflow is depicted
by
ahalf-arrow. In
addition
to
powervariablesthere
are alsovariablesthat
representthe
accumulationof efforts and offlows
overtime.
These
variablesaretermed
generalized momentaandgeneralizeddisplacements
respectively.The
bond
graph showsthe
structureofthe
modelin
away that
resemblesthe
structureof a real system.It
shouldbe
stressedthat
systemdecomposition
combinedwiththe bond
graphmodeling
methodleads
to
alumped-parameter
model representation.For the
case where variablesinside
acomponent change
continuously
over some area of spaceit is
necessary
to discretize
them,
i.e.,
to
representthem
by
afinite
number of parts(components). This
canbe done in
variousways, e.g.,
by
using the finite
elementdiscretization
method.3.2. Simulation Software
There
aremany
softwaretools using bond
graphs which supportsimulation, e.g.,
ENPORT
(Rosenberg
,1974),TUTSIM
(Kraan, 1974),
CAMP
(Granada, 1985),
BONDYN (Felez
etal,
1990),
MMT
toolbox
(Gawthorp,
1996). Of these CAMAS (Broenink
etall,
1995)
seemsto
be
more relevant
to the
approach usedin this
work.It
supportsbond
graph andblock diagrams
representation
in
multidimensionalform
andhierarchical
modeling.CAMAS
consists ofdifferent
modulesas separate programs.
It normally
runs onworkstations,
but there is
also a restricted versionfor PCs (no
multidimensional elements and noimplicit integration methods)
[2].
The BondSim
systemhas
been
usedfor
problemsolving described in this
work.It is
designed
as a compactmodeling framework based
onthe
object oriented approachin
a visual environment.The
core ofthe
modeling
system'sphilosophy is
systemdecomposition
and composition.This is based
on ageneral model ofthe component,
which contains allinformation
on
its structure,
properties,
andbehavior. The
model of asystemis
represented as atree
ofinterconnected
component modelsthat
areheld in the library. The modeling
systemis designed
in
a visual environment which supports graphicalediting
and an automatic generation ofthe
model's
database. The functional
model representationis based
onbond
graph methodology.Much
attentionis devoted
to
describing
standard physical processesin
a symbolicalform. In
addition
to basic bond
graphelements,
ablock diagram-like
description is
also supported.The
final
system modelis
generatedin
a symbolicalform. Simulation
ofthe
system simulatoris
based
onsolving differential
algebraic equationusing
suitable methods[2].
The
modeling
and simulation environment weredesigned
as a compact computerworkbenchBondSim
[2].
All the bond
graphdiagrams in this
work were createdusing the
BondSim7).
It
wasalso used
for solving the
naturalfrequency
problemdescribed in this
work.3.3.
Bond
Graphs Model
ofTesting
Element
3.3.1.
BG Model
In
orderto
develop
the
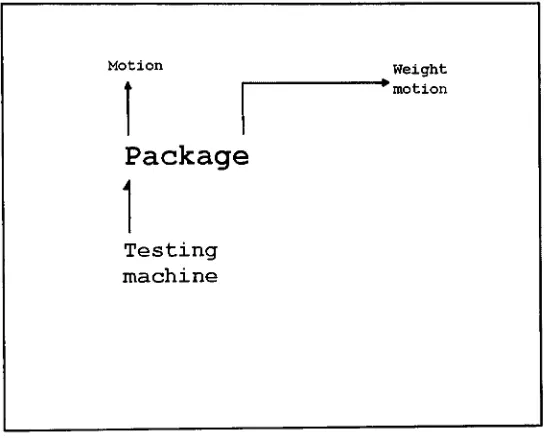
model we will analyze physical situation shownin Figure 9
first. We
canidentify
several components:testing
machine,
package(i.e.,
the
model withits
components exposedto
vibrations and motion).Physical interaction happens between the
testing
machineand
the
package(model).
The
model ofthe
testing
machineis
setup
to
simulateforced
vibrationsimposed
onthe
package system
(from
outsidethe
package system).It is
modeled asa sinefunction
exciterwitha changeable
frequency.
Motion Weight
'motion
Package
[image:27.504.118.393.272.491.2]Testing
machineFigure 9.