Evaluation of fouling in a pilot scale membrane bioreactor
256
0
0
Full text
(2) EVALUATION OF FOULING IN A PILOT SCALE MEMBRANE BIOREACTOR. Thesis submitted by Maneerat Tiranuntakul BSc (Industrial Chemistry) Srinakarinwirote University (Thailand), ME (Chemical Engineering) Kasetsart University (Thailand). March 2011. A thesis submitted in fulfillment of the requirement for the degree of Doctor of Philosophy School of Engineering, James Cook University Queensland, Australia.
(3) i. LIST OF PUBLICATIONS M. Tiranuntakul, P.A. Schneider and V. Jegatheesan, H.L. Fracchia, “Modelling based design of a pilot-scale membrane bioreactor for combined nutrient removal from domestic wastewater”, Conference proceeding, IWA World Water Congress and Exhibition, Beijing, China. 2006. M. Tiranuntakul, V. Jegatheesan and P.A. Schneider, “Assessment of critical flux in a pilot scale membrane bioreactor”, Bioresource Technology, Volume 102, Issue 9, May 2011, Pages 5370-5374..
(4) ii. STATEMENT OF ACCESS I, the undersigned, author of this work, understand that James Cook University will make this thesis available for use within the University Library and, via the Australian Digital Theses network, for use elsewhere.. I understand that, as an unpublished work, a thesis has significant protection under the Copyright Act and;. In consulting this thesis I agree not to copy or closely paraphrase it in whole or in part without the written consent of the author, and to make proper public written acknowledgement for any assistance, which I may have obtained from it.. Beyond this, I do not wish to place any further restriction on access to this work.. _________________________ Signature. ______________ Date.
(5) iii. STATEMENT OF SOURCES DECLARATION I declare that this thesis is my own work and has not been submitted in any form for another degree or diploma at any university or other institution of tertiary education. Information derived from the published or unpublished work of others has been acknowledged in the text and a list of references is given.. ____________________________________ Signature. ____________________ Date.
(6) iv. ACKNOWLEDGEMENTS. Firstly, I would like to convey my sincere gratitude to my supervisor Dr Philip A. Schneider and my co-supervisor A/Prof. Dr. Jega V. Jegatheesan for their guidance, encouragement, and patience.. Secondly, I would like to thank Thai government, Queensland government, Townsville CitWater, Kubota Company and JCU School of Engineering for the financial support and materials support throughout my entire PhD study.. In regard to my experimental work, my appreciation goes to the following persons: •. Mr. Eric van Prooije and Mr. Cameron Tully, for their assistance related to pilot plant setting-up and commissioning. •. Mr. Stuart Peterson and Mr. Curtis Arrowsmith from the JCU workshop for their kind assistance with my experimental apparatus. Finally, I would like to thank my parents, my aunty, my brother and sister for their love and support. And thank you to all my friends in Townsville for their friendship..
(7) v. DEDICATION. Dedicated to. My parents, my aunty and my husband.
(8) vi. ABSTRACT A 2.4-m3 pilot plant MBR for wastewater treatment was designed and constructed for membrane biofouling studies. Three categories of membrane fouling study were carried out with this MBR pilot plant in order to obtain a better understanding of MBR performance and fouling. Firstly, critical flux assessment based on various defining concepts and influencing parameters was examined. The results showed small variations of critical flux values obtained from different defining concepts. Decline of critical flux as the step change of fouling air flow rate increased was observed, while step length had no obvious effects on the critical flux. A positive relationship between aeration rate and critical flux is observed, while higher sludge concentration caused lower critical flux.. Secondly, fouling mechanisms under. different sludge composition and different flux regimes were tested. Under supracritical flux operation, cake resistance accounted for the main fouling contribution, while pore fouling was marginal in both supra-critical flux and sub-critical flux regimes. EPS carbohydrate in soluble and bound forms has greater impact on both pore fouling and cake fouling than protein. Finally, optimization of the MBR pilot plant was carried out. Based on equivalent permeate yield and equivalent energy consumption for each experimental run, three operational variables showed significant influence in membrane fouling rate increase. They were, in the order of importance, filtration mode > scouring frequency > regular aeration intensity. The optimum operating conditions determined by the proposed methodology were 11 L/m2.min air intensity with continuous filtration and scouring 24 times per day for the pilot plant MBR..
(9) vii. TABLE OF CONTENTS LIST OF PUBLICATIONS.…………………………………………………………i STATEMENT OF ACCESS………………………………………………………...ii STATEMENT OF SOURCES……………………………………………………...iii ACKNOWLEDGEMENTS……………………………………...………………….iv DEDICATION……………………………………...…………………………..……v ABSTRACT……………………………………...…………………………………..vi TABLE OF CONTENTS………………...…………………...…………………….vii LIST OF TABLES………………………………………………..………..….......xiii LIST OF FIGURES……………...…………………...………………………....... xv. CHAPTER 1 INTRODUCTION 1.1 Background and thesis aim………………………….…………………….............1 1.2 Thesis structure……………………………………………………………...…….3. CHAPTER 2 LITERATURE REVIEW 2.1 Membrane filtration: an overview…………………………………………...…….5 2.1.1 Membrane process………………………………………………….........5 2.1.2 Membrane material and categorization………………………….............7 2.1.3 Industrial application of microfiltration membrane………………..……9 2.2 Development of MBR technology……………………………….…………..……9 2.2.1 General wastewater treatment……………………………………..…….9 2.2.2 Membrane bioreactors………………………………………..………...10 2.2.3 MBR process configuration……………………………...………...…..12.
(10) viii. 2.3 Membrane fouling……………………………………………………..…………13 2.3.1 characterization of membrane fouling……………………………..…...13 2.3.2 Mass transfer in crossflow filtration………………………………...….14 2.3.3 External and internal fouling resistance………………………………..17 2.4 Membrane biofouling and influencing factors…………………………………...18 2.4.1 Biofouling mechanism……………………………………………..…..18 2.4.2 Stages of MBR fouling…………………………………………………20 2.4.3 Factors affecting performance in submerged MBR……………………22 2.5 MBR fouling and activated sludge components………………………………....23 2.5.1 Fouling caused by mixed liquor suspended solid……………………...23 2.5.2 Fouling caused by extra-polymeric substance……………...………….24 2.5.3 Fouling and fractions of activated sludge…………………………..….25 2.5.3 Fouling caused by sludge categories………………………………..….27 2.6 Critical flux……………………………………………………………………....27 2.6.1 The concept of critical flux………………………………………….....27 2.6.2 Critical flux determination……………………………………………..28 2.6.3 Factors affecting the critical flux……………………………………....30 2.7 Measures against fouling in submerged MBR system…………………………..33 2.7.1 Air scouring outside the membrane module…………………………...33 2.7.2 Air sparging inside the membrane module………………………….....34 2.7.3 Aeration mode………………………………………………………....34 2.7.4 Sub-critical flux filtration……………………………………………...35 2.7.5 Intermittent filtration…………………………………………………..35 2.7.6 Backwashing…………………………………………………………..36.
(11) ix. 2.8 Summary…………………………………………………………………….......36 CHAPTER 3 DESIGN, CONSTRUCTION AND NUTREINT TREATMENT PERFORMANCES OF A PILOT SCALE SUBMERGED MEMBRANE BIOREACTOR 3.1 Introduction………………………………………………………………………38 3.2 MBR modeling based design…………………………………………….38 3.2.1 MBR configuration and simulation models…………….……...39 3.3 Some important MBR design considerations…………..………………...41 3.3.1 Design considerations based on biological treatment factors….41 3.3.2 Design considerations based on hydrodynamics……………….44 3.3.3 Design consideration based on program logic control…………47 3.4 Construction and commissioning………………………………………...50 3.4.1 Construction of the MBR system………………………………50 3.4.2 Commissioning of the pilot scale MBR………………………..53 3.5 Results of SMBR modelling based design and treatment performance of the SMBR…………………………………………..………………………..55 3.5.1 Simulation based design results…………………...…………...55 3.5.2 Sludge physical properties……………………...……………...60 3.5.3 DO and MLSS concentration…………………………………..63 3.5.4 Nutrient removal in the MBR system……………...…………..65 3.6 Conclusions………………………………………………………………68. CHAPTER 4 INFLUENCING PARAMETERS OF CRITICAL FLUX ASSESSMENT.
(12) x. 4.1 Introduction………………………………………………………………………69 4.2 Experimental materials and method……………………………………………...69 4.2.1 Experimental facility…………………………………………………...73 4.2.2 Experimental design……………………………………………………73 4.2.3 Flux stepping and flux cycling methods for critical flux test…………..75 4.3 Results and discussion……………………………………………………………78 4.3.1 Clean water flux test……………………………………………………78 4.3.2 Strong form critical flux………………………………………………..79 4.3.3 Weak form critical flux………………………………………………...80 4.3.4 Sustainable flux………………………………………………………...91 4.3.5 Comparison of critical flux based on different determination methods and sustainable flux…………………………………………………..…........93 4.3.6 Influencing parameters for critical flux enhancement……………….....95 4.4 Conclusion………………………………………………………………………..98. CHAPTER 5 MEMBRANE FOULING BEHAVIOR UNDER DIFFERENT SLUDGE COMPOSITIONS AND DIFFERENT FLUX STAGES 5.1 Introduction……………………………………………………………………..99 5.2 Experimental materials and method…………………………………………….101 5.2.1 Experimental facility………………………………………………….101 5.2.2 Experimental design…………………………………………………..102 5.2.3 Laboratory analysis…………………………………………………...103 5.2.4 Membrane fouling analysis…………………………………………...106 5.2.5 Observation of membrane fouling morphology………………………107.
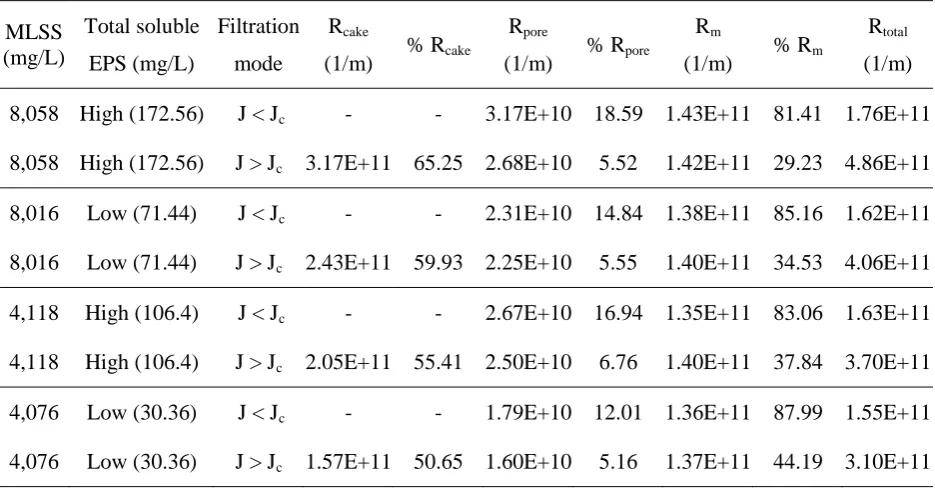
(13) xi. 5.3 Results and discussion…………………………………………………………..108 5.3.1 Fouling contribution…………………………………………………..108 5.3.2 Effect of colloids on membrane fouling mechanisms………...………109 5.3.3 Effect of EPS contents on membrane fouling mechanisms..………....111 5.3.4 Effect of sludge concentration on membrane fouling mechanisms......116 5.3.5 Fouling morphology…………………………………………………..120 5.4 Conclusion………………………………………………………………………123. CHAPTER 6 OPERATIONAL STRATEGIES AND OPTIMISATION FOR SUBMERGED MEMBRANE BIOREACTOR 6.1 Introduction……………………………………………………………………..125 6.2 Experimental materials and method…………………………………………….130 6.2.1 Experimental facility………………………………………………….130 6.2.2 Experimental design using orthogonal array………………………….130 6.3 Results and discussion…………………………………………………………..134 6.3.1. Membrane fouling index……………………………………………..134 6.3.2. Membrane fouling results…………………………………………….135 6.3.3 Optimum operating condition of the MBR system…….……………..147 6.3.4 Confirmation experiments…………………………………………….152 6.4 Conclusion………………………………………………………………………154. CHAPTER 7 CONCLUSIONS AND RECOMMENDATIONS 7.1 Conclusion………………………………………………………………………155 7.2 Recommendation for future work………………………………………………156.
(14) xii. REFERENCES……………………………………………………………………158. APPENDIX A: Calculation details for chapter 3…...………………...……………190 APPENDIX B: Experimental data for chapter 4…………………………………...209 APPENDIX C: Experimental data for chapter 5……………………...……………223 APPENDIX D: Analysis of variance (ANOVA) for chapter 6………………...…..228 APPENDIX E: Nomenclature………………………………..………………...…..230.
(15) xiii. LIST OF TABLES Table 2.1. Comparison of different membrane configurations (Wagner 2001)…..7. Table 2.2. Membrane categories based on permeate size (adapted from Osmonics, 1996)……………………………………………………….8. Table 2.3. Fouling contribution of different activated sludge fractions (Ye 2005)……………………………………………………………..26. Table 3.1. Characteristics of raw municipal wastewater at the Mt St John treatment plant, October - November 2005 (data from Townsville CitiWater)…………………………………………………………….40. Table 4.1. Characteristics of wastewater used in the experiment………………..71. Table 4.2. The operational conditions for testing the effect of step height and step length………………………………………………………..75. Table 5.1. Characteristics of wastewater used in the experiment ……………...102. Table 5.2. Assignment of operational parameters in the 23 factorial designs….103. Table 5.3. Fouling contribution at different sludge composition and filtration mode………………………………………………………………...108. Table 6.1. Characteristics of wastewater used in the experiment……………....130. Table 6.2. Regular aeration and air scouring based on equivalent air volume…132. Table 6.3. Membrane flux consideration (fixed flux operation)……………….132. Table 6.4. Level and factor of orthogonal experiments………………………...133. Table 6.5. The SMBR operating conditions of the orthogonal design………....133. Table 6.6. Summary the SMBR operating results from Fig. 6.3 - Fig. 6.14…...142.
(16) xiv. Table 6.7. Mean fouling response obtained from Taguchi method…………….142. Table 6.8. ANOVA based on the mean response in run no.1-9 (more detail of ANOVA calculation is given in appendix D) ………………………146. Table 6.9. Mean fouling response and level elimination ………………………148. Table 6.10. The MBR operating results in the 2nd round experiments…………148. Table 6.11. Mean fouling response and level elimination ………………………152.
(17) xv. LIST OF FIGURES Fig. 2.1. Modes of operation for membrane filtration (Cheryan 1998; Wicaksana, 2006): (a) Dead-end; (b) Crossflow……..…..……………6. Fig. 2.2. Conventional wastewater treatment and MBR……………………….11. Fig. 2.3. Schematic of submerged membrane filtration display effective force on suspended microorganism particle and fouling phenomena on membrane surface …………………………………...……………….15. Fig. 2.4. Sequential steps in biofilm formation (adapted Gottenbos et al., 1999)………………………………...…...19. Fig. 2.5. Experimental determination of critical flux (Ognier et al. 2004)…….20. Fig. 2.6. The three stages of MBR fouling (Zhang, Chuaa et al. 2006)…...…..21. Fig. 2.7. MBR fouling factor roadmap (Zhang, Chuaa et al. 2006)……......….22. Fig. 2.8. Schematic representations of (a) the strong form critical flux, and (b) the weak form critical flux (Fradin and Field 1999)……………...28. Fig. 3.1. Schematic diagram of submerged MBR pilot plant………………….40. Fig. 3.2. Schematic diagram of fluid flow in the pilot scale MBR……………45. Fig. 3.3. Schematic diagram for TMP evaluation……………………………...46. Fig. 3.4. Schematic diagram for level control in the MBR system……………48. Fig. 3.5. Schematic diagram for air scouring in the membrane unit…………..49. Fig. 3.6. Schematic diagram of each unit construction in the MBR system…..51. Fig. 3.7. Front view and top view of the membrane case in the aerobic unit…52. Fig. 3.8. Pilot scale SMBR……………………………………………………53.
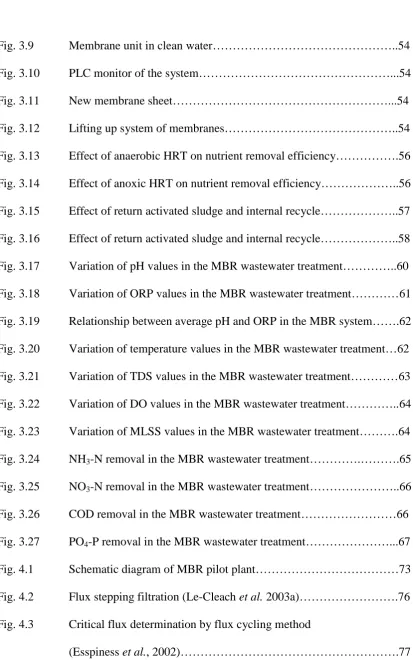
(18) xvi. Fig. 3.9. Membrane unit in clean water………………………………………..54. Fig. 3.10. PLC monitor of the system…………………………………………...54. Fig. 3.11. New membrane sheet………………………………………………...54. Fig. 3.12. Lifting up system of membranes……………………………………..54. Fig. 3.13. Effect of anaerobic HRT on nutrient removal efficiency…………….56. Fig. 3.14. Effect of anoxic HRT on nutrient removal efficiency………………..56. Fig. 3.15. Effect of return activated sludge and internal recycle………………..57. Fig. 3.16. Effect of return activated sludge and internal recycle………………..58. Fig. 3.17. Variation of pH values in the MBR wastewater treatment…………..60. Fig. 3.18. Variation of ORP values in the MBR wastewater treatment…………61. Fig. 3.19. Relationship between average pH and ORP in the MBR system…….62. Fig. 3.20. Variation of temperature values in the MBR wastewater treatment…62. Fig. 3.21. Variation of TDS values in the MBR wastewater treatment…………63. Fig. 3.22. Variation of DO values in the MBR wastewater treatment…………..64. Fig. 3.23. Variation of MLSS values in the MBR wastewater treatment……….64. Fig. 3.24. NH3-N removal in the MBR wastewater treatment………….……….65. Fig. 3.25. NO3-N removal in the MBR wastewater treatment…………………..66. Fig. 3.26. COD removal in the MBR wastewater treatment……………………66. Fig. 3.27. PO4-P removal in the MBR wastewater treatment…………………...67. Fig. 4.1. Schematic diagram of MBR pilot plant………………………………73. Fig. 4.2. Flux stepping filtration (Le-Cleach et al. 2003a)…………………….76. Fig. 4.3. Critical flux determination by flux cycling method (Esspiness et al., 2002)……………………………………………….77.
(19) xvii. Fig. 4.4. Clean water flux test at different aeration intensities………………...78. Fig. 4.5. Strong form critical flux at different step lengths and different step heights…………………………………………………………...79. Fig. 4.6. Critical flux evaluated based on two-third limiting flux at different step lengths and step heights……………………………..81. Fig. 4.7. Flux and TMP profile at step height 4 L / m 2 h and 30 min step length……………………………………………………………83. Fig. 4.8. Comparison of critical flux evaluated based on flux linearity at different step heights and step lengths……………………………….83. Fig. 4.9. Permeability at step heights 4 L / m 2 h and 30 min step. length……...85 Fig. 4.10. Comparison of critical fluxes evaluated based on 90% permeability at different step heights and step lengths………………85. Fig. 4.11. Stepping filtration at step height 4 L / m 2 h and 15 min step length....87. Fig. 4.12. Cyclic filtration at step height 4 L / m 2 h and 15 min step length...…88. Fig. 4.13. Flux reversibility of stepping filtration at step height 4 L / m 2 h and 15 min step length, where a = the last reversible flux and b = the first irreversible flux……………………………………..88. Fig. 4.14. Flux reversibility of cyclic filtration at step height 4 L / m 2 h and 15 min step length, where a = the last reversible flux and b = the first irreversible flux………………………………………………….89. Fig. 4.15. Comparison of critical fluxes evaluated based on fouling reversibility of stepping filtration and cycling filtration…………………………..89.
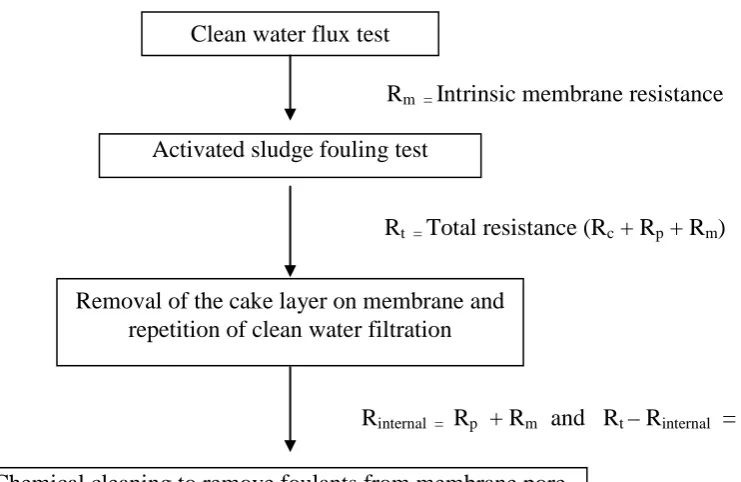
(20) xviii. Fig. 4.16. Fouling rate profile at step height 2 L / m 2 h and 30 min step length, where a = the last-slow fouling flux and b = the first-fast fouling flux…………………………………………………………………...92. Fig. 4.17. Sustainable fluxes at different step heights and step lengths………...92. Fig. 4.18. Comparison of sustainable flux and critical fluxes obtained from different determination methods and different filtration variables…..94. Fig. 4.19. Critical flux at different aeration and MLSS concentration………….98. Fig. 5.1. Steps to measure each filtration resistance………………………….107. Fig. 5.2. EPS and colloidal concentration………………………………….....109. Fig. 5.3. Colloidal concentration and different fouling resistance…………...110. Fig. 5.4. Soluble EPS contents and membrane pore fouling…………………112. Fig. 5.5. Bound EPS contents and membrane pore fouling…………………..113. Fig. 5.6. Ratio of EPS protein to carbohydrate and membrane pore fouling...114. Fig. 5.7. Contents of soluble and bound EPS and cake fouling resistance…...115. Fig. 5.8. Ratio of EPS protein to carbohydrate and membrane cake fouling...116. Fig. 5.9. MLSS and total fouling resistance………………………………….117. Fig. 5.10. MLSS and pore fouling resistance………………………………….117. Fig. 5.11. MLSS and cake fouling resistance………………………………….119. Fig. 5.12. Pore fouling under sub-critical flux operation of sludge 4 g/L and low soluble EPS………………………………………………...121. Fig. 5.13. Pore fouling under sub-critical flux operation of sludge 4 g/L and high soluble EPS……………………………………………..…121. Fig. 5.14. Pore fouling under sub-critical flux operation of sludge 8 g/L and low soluble EPS………………………………………………...121.
(21) xix. Fig. 5.15. Pore fouling under sub-critical flux operation of sludge 8 g/L and high soluble EPS………………………………………………..121. Fig. 5.16. Cake fouling under supra-critical flux operation of sludge 4 g/L and low soluble EPS………………………………………………...122. Fig. 5.17. Cake fouling under supra-critical flux operation of sludge 4 g/L and high soluble EPS………………………………………………..122. Fig. 5.18. Cake fouling under supra-critical flux operation of sludge 8 g/L and low soluble EPS………………………………………………...122. Fig. 5.19. Cake fouling under supra-critical flux operation of sludge 8 g/L and high soluble EPS………………………………………………..122. Fig. 5.20. Cross-section view of cake fouled membrane under sub-critical flux operation of sludge 4 g/L and low soluble EPS…………………….122. Fig. 5.21. Cross-section view of cake fouled membrane under sub-critical flux operation of sludge 4 g/L and high soluble EPS……………………122. Fig. 5.22. Cross-section view of cake fouled membrane under supra-critical flux operation of sludge 8 g/L and low soluble EPS…………………….123. Fig. 5.23. Cross-section view of cake fouled membrane under supra-critical flux operation of sludge 8 g/L and high soluble EPS……………………123. Fig. 6.1. Pie chart shows MBR plant running costs have decreased during 1992-2004. Sizes of the total area are in proportion to the overall revenue cost, while the partitioned areas inside the circle illustrate how the focus of attention has shifted from membrane replacement towards power and sludge disposal (Churchouse and Wildgoose 1999)…….126. Fig. 6.2. The changing TMP in the experiment A……………………………136.
(22) xx. Fig. 6.3. The changing TMP in the experiment B……………………………136. Fig. 6.4. The changing TMP in the experiment C…………………………...137. Fig. 6.5. The changing TMP in the experiment no. 1………………………...137. Fig. 6.6. The changing TMP in the experiment no. 2………………………...138. Fig. 6.7. The changing TMP in the experiment no. 3………………………...138. Fig. 6.8. Changing TMP in the experiment no. 4…………………………….139. Fig. 6.9. Changing TMP in the experiment no. 5…………………………….139. Fig. 6.10. Changing TMP in the experiment no. 6…………………………….140. Fig. 6.11. Changing TMP in the experiment no. 7…………………………….140. Fig. 6.12. Changing TMP in the experiment no. 8…………………………….141. Fig. 6.13. Changing TMP in the experiment no. 9…………………………….141. Fig. 6.14. Total comparison of mean fouling responses ………………………143. Fig. 6.15. Changing TMP over the experiment no. 2………………………….149. Fig. 6.16. Changing TMP over experiment no. 3……………………………...149. Fig. 6.17. Changing TMP over experiment no. 4……………………………...150. Fig. 6.18. Changing TMP over experiment no. 5……………………………...150. Fig. 6.19. Changing TMP over experiment no. 6……………………………...151. Fig. 6.20. Changing TMP over experiment no. 7……………………………...151. Fig. 6.21. Total comparison of mean fouling responses ………………………152. Fig. 6.22. The changing TMP over long term operation ………………………153.
(23) 1. CHAPTER 1 INTRODUCTION. 1.1 BACKGROUND AND THESIS AIM Conventional activated sludge process (CASP), using microorganisms for biological degradation of organic pollutions, can be used to treat both municipal and industrial wastewater.. However, the CASP requires a large operational area for. aeration and sedimentation unit and a big problem of this process is a solid-liquid separation because of excess, bulking and foaming sludge. An advanced technology for wastewater reclamation and reuse that has been widely used to separate pollutants and suspended solids from liquid phase is a membrane bioreactor.. Membrane. bioreactor (MBR) for wastewater treatment is defined as a combined process between membrane filtration for biomass withholding and biological activated sludge treatment. This membrane bioreactor, integrated bio-treatment and clarification step, is employed in order to replace the clarifier and settlement unit in typical conventional treatment. Organic matter from raw wastewater will be removed by microorganisms and converted into simple products of nitrogen, carbon, hydrogen and oxygen compounds depending on aerobic, anoxic or anaerobic biological process. Then, the final effluent will be separated between suspended solids and clear liquid stream by membrane process. Since late 20th century, MBR technologies have mostly been used in wastewater treatment due to a satisfaction of pathogen removal and permeate clarification.. A number of MBR focusing on wastewater research are highly. increased about two times from late 1990s to early 2000s (Yang, 2006). Compared.
(24) 2. with CASP, submerged membrane technology has many advantages over CASP including: less land requirement (by replacement of clarifier unit), capability to deal with high sludge concentration, giving constant and excellent disinfected treatment. However, MBR process still has a major disadvantage of membrane fouling which affects on operational cost and energy cost for membrane replacement, membrane fouling control and membrane cleaning. Therefore, further studies are required to obtain better understanding of membrane fouling and optimization. Since the MBR system includes living microorganisms, their properties and their relative contributions on membrane fouling problem may also vary with experimental conditions from one study to another. Also, in most previous MBR works, the filtrations were carried out with lab scale and sometimes fed with synthetic sewage which, in fact, has substantially different fouling phenomena compared to those of pilot or full scale operating with real sewage. Based on these considerations, this thesis has the following aims: •. to learn and understand design factors involving in MBR process and to construct a pilot scale submerged MBR for the thesis experiments. •. to examine the effect of various parameters such as step heights, step lengths, aerations and sludge concentrations on assessment and variation of critical flux. •. to see an interaction among sludge compositions, flux stages of filtration and membrane fouling mechanisms. •. to investigate the contribution of controllable parameters including aeration modes, imposed fluxes and scouring frequencies on the membrane.
(25) 3. fouling behavior and to evaluate the optimum operational conditions through the these different parameters. 1.2 THESIS STRUCTURE Chapter 2 provides a literature review of various topics related to the submerged membrane bioreactor including background of crossflow filtration, the effect of governing parameters, the filtration behavior, the critical flux concepts as well as measure against membrane fouling.. Chapter 3 describes the details of design and construction of a pilot scale submerged membrane bioreactor as well as details of wastewater treatment performances occurring in the pilot scale submerged MBR.. Chapter 4 presents the determination of membrane critical fluxes using different assessment parameters such as step heights, step lengths and judgment concepts. The effect of aeration and sludge concentration on critical flux is also examined.. Chapter 5 investigates the fouling performances affected by sludge concentration and EPS components in different flux stage operations. The interaction among these parameters and mechanisms of fouling namely pore blocking and cake fouling are also observed.. Chapter 6 studies the possibility of incorporating various aeration modes, flux modes and scouring modes as an alternative approach to improve the filtration performance. The effect of these various operation modes are analyzed and optimized.
(26) 4. using analysis of variance (ANOVA) and Sequential Elimination of Level (SEL) technique, respectively.. Chapter 7 summarizes the main finding and provides general conclusion and recommendation for future work..
(27) 5. CHAPTER 2 LITERATURE REVIEW 2.1 MEMBRANE FILTRATION: AN OVERVIEW There is several membrane systems currently employed. The following sections outline these system details including membrane process, membrane material and categorization, and industrial applications of microfiltration membrane.. 2.1.1 Membrane process Membrane filtration systems have been developed for more than 150 years, starting from preliminary research and development through to modern widespread use (Negaresh 2007). By the 1960s, elements of modern membrane science had been developed and used in laboratories. By the 1980s, the problem of slow permeation rates and the issue of packaging a large membrane surface area into low cost modules had been overcome. One of the principal limitations of membrane processes still remains is selectivity (Baker 2004). In general a membrane can be defined as a selective barrier between two fluid phases. It has a lateral dimensions much greater than the thickness of the structure through which mass transfer occurs. Membrane processes are driven by differences in a driving force, such as the pressure, concentration, or voltage of the separated phases across the membrane (Pinnua 2004). Membrane-based filtration is becoming a mainstream separation process and competes with conventional processes for various operations, such as separation, concentration and purification of chemical species present in many mixtures. In many cases, membrane separation decreases costs and.
(28) 6. offers superior performance, improving a broad range of water quality problems (Stephenson et al. 2000).. Moreover, membrane-based separation processes are. flexible and can be integrated with other techniques. Membrane filtration can be operated in two configuration extremes: dead-end and crossflow modes as shown in Fig. 2.1. In the dead-end filtration process, feed and permeate streams are pumped in the same flow direction perpendicular to the membrane surface. In contrast, for crossflow filtration mode, only the permeate flow is in the normal direction, while the feed and retentate directions are parallel with the membrane. Compared with the dead-end configuration, crossflow operation gives less cake thickness and lowers fouling resistance due to the occurrence of tangential shear on the membrane surface. Hence, crossflow filtration is more favorable in industrial applications.. (a). (b). Fig. 2.1 Modes of operation for membrane filtration (Cheryan 1998): (a) Dead-end; (b) Crossflow.
(29) 7. 2.1.2 Membrane material and categorization Proper selection of membrane material is important and can affect the successful use of membrane processes. Ideally, a membrane should have a high permeate flux, high contaminant rejection, durability, good chemical resistance and low cost (Zhou and Smith 2001). Extensive research has been conducted to develop new membrane materials, according to the review by Wiesner and Chellam (1999). A membrane can be homogenous or heterogeneous, symmetric or asymmetric in its structure, and it can consist of organic or inorganic materials.. Thickness of. membranes can vary between less than 100 nm to more than 10 mm. Membranes can be formed in different physical layouts such as plate and frame, hollow fibre, spiral wound, and tubular modules. A comparison of membrane modules is shown in table 2.1. Two common modules used in MBR are plate and frame, and hollow fibred. Table 2.1 Comparison of different membrane configurations (Wagner 2001). Properties. Spiral wound. Membrane density. high. Plant investment. low. Tendency to fouling. Tubular high price. low price Low. high. low. Plate and frame. Hollow wide fibre system. Hollow fine fibre. Ceramic. average. average. very high. low. high. very high. medium. very high. average. Low. average. Low. very high. medium. Cleanability. good. good. good. Low. non. good. Variable costs. low. high. low. average. average. low. high. Change of membrane only*. no. yes. no. yes. no. no. yes. medium. high. mediu m. medium. High. low. very high. ≤ 100um. ≤ 5um extreme pretreatment. sieve. Flow demand. Pre-filter. ≤ 50 um no fibres. ≤ 100 sieve. um few fibres. few fibres.
(30) 8. Note *: Most tubular and flat sheets are made in such a way that only the membrane is changed, leaving the membrane cartridge unchanged.. One of the most important properties is that of pore size or molecular weight cutoff (MWCO), which specifies the maximum molecular weight of solute to be rejected. Based on membrane pore size, membrane processes can be classified into four categories (see table 2.2): microfiltration (MF), ultrafiltration (UF), nanofiltration (NF) and reverse osmosis (RO).. Table 2.2 Membrane categories based on permeate size (adapted from Osmonics, 1996) Permeate (µm). 0.001. 0.01. 0.1. Microfiltration. Carbon black. Ultrafiltration. Virus. Nanofiltration. Reverse osmosis. Salts Sugars Metal Ions. 10. 100. Yeast cells Human hair. Bacteria Flour. Protein. Gelatin. 1. 1000 Granular activated carbon. Mist. Paint Red blood Pin point pigment cells. Beach sand. Tobacco smoke. Microfiltration has a relatively large pore size (around 0.1-10 µm) and commonly used to separate particles greater than 10 µm from other components in a solution or suspension. Minor driving force or a small pressure difference across the membrane is adequate to sustain high flux, since the hydrodynamic flow of the membrane is low. Ultrafiltration has pores in the range of 5 nm to about 50 nm. This membrane resistance and applied pressure is higher than in microfiltration. Nanofiltration has characteristics between UF and RO with a larger membrane pore size than in RO to retain sugars and divalent salts. Reverse osmosis can be considered.
(31) 9. as a dewatering technology using a very dense membrane without detectable pores. The hydrodynamic resistance increases from MF, UF, NF to RO.. 2.1.3 Industrial applications of microfiltration membranes Microfiltration is a routinely used for a number of applications. The industrial applications. of. microfiltration. can. be. summarized. as. follows:. bacteria. removal/extended shelf life of milk, clarification of fruit juices, wine and beer, enzyme/cell separation and purification in the pharmaceutical industry, ultra-pure water in the semiconductor industry, metal recovery (separation of colloidal oxides and hydroxides), drinking water and wastewater treatment, etc (Wicaksana 2006).. 2.2 DEVELOPMENT OF MBR TECHNOLOGY The following sections outline the development of MBR technology in wastewater treatment including general wastewater treatment, membrane bioreactors and MBR process configuration.. 2.2.1 General wastewater treatment Wastewater treatment is grouped into primary, secondary, and advanced treatment (Psoch 2005). Primary treatment comprises physical operations, such as screening and sedimentation, to remove floatable and settle-able solids from the water. Secondary treatment uses biological and chemical processes to reduce the load of organic matter in the water. Advanced (tertiary) treatment further aims to remove other constituents like nitrogen and phosphorous (Tchobanoglous and Burton 1991). The conventional activated sludge process, commercialized in 1920 as a continuous process, is the most common biological process able to handle secondary and.
(32) 10. advanced treatment (Kraume et al. 2004). Although well understood and extensively modeled, the use of activated sludge process is constrained by several factors. Those constraints are, namely, relatively large areas required for the process, large volumes for the aeration and sedimentation tanks, further treatment of excess sludge, required adaptation to fluctuations in loading rates, and frequent problems associated with sludge separation due to bulking and foaming (Le Clech 2002).. 2.2.2 Membrane bioreactors (MBR) An interest in combining membranes with activated sludge processes for wastewater treatment began over 30 years ago (Judd et al. 2000). The first time a membrane was combined with biological wastewater treatment was reported by Smith et al. (1967).. The combination of these two technologies has since led to the. development of MBR process, which consists of the presence of a membrane replacing the secondary settling tank in a conventional activated sludge process. A comparison between activated sludge and membrane process is shown in Fig. 2.2. By using membrane filtration, problems related to poor biomass settling can be eliminated and higher quality of treated water can be achieved, since the biomass is physically retained by the membrane (Muller et al. 1995). There are numerous advantages of the MBR technology over conventional biological wastewater treatment process: small footprint, low maintenance, complete solids removal from effluent, easy to scale-up and scale-down by modular extension, and high disinfectant production. For space-restricted areas, such as densely populated urban areas and onboard ships, MBRs are a superior alternative due to its small footprint (Ng and Hermanowics 2004). Because of the above mentioned merits, the application of MBR.
(33) 11. has gained vast interest worldwide and over 500 commercial MBR processes in operation worldwide were expected by 200 (Stephenson et al. 2000).. Side-stream Air-lift MBRa. Fig. 2.2 Conventional wastewater treatment and MBR (Lawrence et al. 2002; aHelan et al. 2006).
(34) 12. 2.2.3 MBR process configuration 2.2.3.1 Side-stream configuration For wastewater treatment, the sidestream mode has been applied successfully since the early 1970s. In this configuration (Fig. 2.6), the membrane is placed in a recirculation loop external to the bioreactor. In such a system, the feed is pumped into the membrane module, and part of the feed is withdrawn as permeate, while the other part is forced to flow along the membrane surface. The advantage is a better control of the cake layer build-up resulting in more constant flux. On the other hand, this configuration is a more complex system with high energy consumption. The comparative study performed by Gander et al. (2000) showed that the energy consumption for side-stream systems is generally two orders of magnitude higher than for submerged configurations.. 2.2.3.2 Submerged configuration The submerged configuration was introduced at an industrial scale in the mid1990s. For this configuration, the membrane is directly placed in the aeration tank containing the mixed liquor (Fig. 2.6). The uplifting bubbles generate a scouring effect at the membrane surface and provide oxygen to microorganisms.. The. advantages of a submerged configuration are simple design, lower energy consumption and high hydraulic efficiencies compared to the sidestream configuration.. The submerged configuration membranes are either hollow fibres. aligned vertically or horizontally, or flat plates aligned vertically (Fane 2002). Hollow fibre geometry is commercially produced by Zenon and the flat plate is produced by Kubota..
(35) 13. Low flux operation is essential in submerged systems to reduce fouling on the membrane surface. The lower flux involves a larger membrane area resulting in a higher capital cost which is offset by the lower energy demand (Wicaksana et al. 2006). As a result, strategies to reduce energy further are important for submerged MBR.. For moderate to large scale municipal wastewater treatment, submerged. systems are preferable over side-stream configuration due to small footprint and reactor requirement.. Even though the submerged type is newer than other,. approximately 55% of MBR installations are the submerged type while the remainders are in the side-stream type (Stephenson et al. 2000).. 2.3 MEMBRANE FOULING 2.3.1 Characterization of membrane fouling Particle separation and water permeation involve various mass transport steps in the membrane filtration process.. Mass transfer can lead to the attachment,. accumulation or adsorption of material onto the membrane surface and/or within membrane pores causing an increase in hydraulic resistance over time.. This. phenomenon is called membrane fouling (Zhou and Smith 2001). Fouling can be classified as (Mulder 2000; Duranceau 2001). •. Crystalline fouling (scaling): deposition of mineral due to the excess of the product being dissolved. •. Organic fouling: deposition of dissolved humic acids, oil, grease and lipids. •. Particle and colloidal fouling: deposition of clay, particulate humic substances, debris and silica. •. Biofouling: adhesion and accumulation of microorganism forming biofilms.
(36) 14. Fouling is the key problem in all membrane applications. Fouling changes the pore size and pore size distribution either by deposition of a layer onto the membrane surface or by blockage or partial blockage of the pores (Field et al. 1995). Three fouling phenomena were introduced for membrane filtration in general that can be applied to the MBR (Knyazkova and Maynarovich 1999): •. Pore narrowing: when the diameter of particles is smaller than the diameter of pores, particles could enter the pores.. As a result, some of the entered. particles pass the membrane and some are fouled or adsorbed onto the pore walls and reduce the open cross-section area for flow. •. Pore plugging: for the case when diameters of particles are similar to those of the pores, particles block the pores.. •. Cake formation: when diameters of particles are bigger than diameter of pores, particles deposition on the membrane surface and build a cake layer.. 2.3.2 Mass transfer in crossflow filtration Transport phenomena of crossflow filtration are shown in Fig. 2.3, which shows a particle under a number of influences for a vertical plane membrane surface. Particles flow toward the membrane surface by permeate-suction force, while the crossflow forced particles back transport into the bulk by shear-induced migration and diffusion mechanisms (to a lower concentration). If the suction force is higher than other forces, fouling, either gelatinous form or cake form (layer B in Fig. 2.7), will occur on the membrane surface. In the ideal case, only the clean membrane resistance is involved, while, in the real condition, fouling caused by several factors such as concentration polarization, external fouling on the membrane surface, and fouling.
(37) 15. inside membrane layer by narrowing and plugging of the pores. Bulk phase is a phase of influent and considered to be less influenced from suction force. Concentration Polarization (CP) is a layer of stagnant solution where the suspension concentration remains higher than the bulk stream concentration due to balance between suction forces and migration/diffusion forces back to the bulk solution.. CP. Bulk phase. B. MB+Fin. Axial drag Shear induced migration, diffusion Sedimentation. 6. Suction force. Shear velocity profile Fig. 2.3 Schematic of submerged membrane filtration display effective force on suspended microorganism particle and fouling phenomena on membrane surface, where CP = concentration polarisation, B = membrane biofouling (gel or cake formation), MB + Fin = membrane layer and internal fouling. Fouling of the membrane can occur if concentration polarization progresses too far, leading to irreversible fouling. Cake fouling or biofouling can occur on the membrane surface and extend outward into the feed channel and inward into membrane pores. Generally, the suspended particles in MBR system are small enough to neglect inertial and gravitational forces. Only the shear migration force and suction. Permeate flux.
(38) 16. force can be considered. As seen in Fig. 2.7, membrane filtration resistance can be divided into three categories; (1) The natural membrane resistance for pure water (Rm), which depends on pore size, pore density, pore depth, the material’s wet-ability, and the hydrodynamic resistance of the device holding the membrane (Ahn et al. 1998; Evans and Miller 2002; Zhao et al. 2003). (2) A resistance due to concentration polarization (Rcp) is caused by convection through the membrane. The thickness of the CP layer depends upon the solution velocity created by the difference between suction force and axial shear force on the membrane surface. The higher the shear force compared with suction pressure, the thinner the CP layer. If the fluid flows through the membrane faster than the retained material can transport back into the bulk fluid, a dense particle layer forms in front of the membrane surface and creates a secondary dynamic membrane. (3) Resistance due to membrane fouling (Rf) composed of cake resistance (Rc : shown as layer B in Fig. 2.3) and internal plugging resistance (Ri: shown as layer Fin in Fig. 2.3). Many studies found that the filtration resistance due to the accumulated cake on the membrane is dominant in the membrane process, compared to the resistance due to the micropore plugging or surface adsorption (Ahn et al. 1998; Kimura et al. 1998; Zhao et al. 2003). Most filtration resistance due to the micro pore plugging or irreversible adherence to the membrane was caused by organic substances (Kimura et al. 1998). Masciola et al. (2001) reported that the fouling layer resistance, Rf, was 63% of the total filtration resistance; however, concentration polarization was the predominant factor controlling resistance in the tubular UF system..
(39) 17. 2.3.3 External and internal fouling resistance For simplicity and for practical reasons fouling is often separated into internal and external fouling, or cake fouling and internal fouling. This is because it is almost impossible to distinguish between the different types of fouling in practice (Psoch 2005). If the suspension has particulates with diameters larger than the membrane pores, the surface mechanism of sieving occurs. A cake layer grows on the membrane surface based on the retained particles. The cake provides an additional resistance to filtration. For dead-end filtration the cake continuously grows but in the crossflow operation the tangential shear stress may arrest the cake growth and extended operation is possible (Psoch 2005). Under the assumption of an incompressible cake, its porosity and resistance are independent of pressure. The specific cake resistance per unit thickness can be estimated by a variation of the Carman-Kozeny Equation, if further parameters, such as particle diameters, etc., are known (Belfort et al. 1994). Contrary to cake fouling or cake resistance, internal, or actual, fouling resistance (Rin) is considered more severe. Cake resistance (Rc) can be more easily removed by shear stress and/or chemicals than the internal fouling. The internal fouling resistance normally happens below the surface level of the membrane, including adsorption and partial pore blocking. It is comparably harder to eliminate internal fouling because it is more difficult to reach micro pores with back-flushing or even with a chemical cleaning agent.. If some membrane pore areas cannot be. accessed by the cleaning agent, a loss of total membrane capacity, which is expressed as decreasing initial flux, is the result. Thus, the treatment of internal fouling is essential lengthen membrane life expectancy and should be appropriately carried out..
(40) 18. 2.4 MEMBRANE FOULING AND INFLUENCING FACTORS 2.4.1 Biofouling mechanism Unwanted deposition and growth of biofilm are commonly embedded on a membrane surface in a matrix of microbial origin, consisting of extra-cellular polymeric substances (EPS) and microorganisms (Strathmann et al. 2002).. The. formation of a biofilm in an aqueous environment generally proceeds in the following sequence (Fig. 2.4) (Escher and Characklis 1990; Gottenbos et al. 1999; Ahmed et al. 2000): (1) When organic matter is presented, a conditioning film of adsorbed components is formed on the membrane surface prior to the arrival of the first microorganisms. (2) Microorganisms are transported to the surface through diffusion, convection, sedimentation or active movement.. This step is the initial step of. membrane biofouling. (3) Initial microbial adhesion occurs when EPS is synthesized to protect and stabilize cell attachment from the outside environmental effects. (4) Attachment of adhering microorganisms is strengthened through EPS production and unfolding of cell surface structures. (5) Growth and metabolism of the attached microorganisms and film develop, and continue secretion of exo-polymers..
(41) 19. 2. Transportation. 1. Conditioning film 3. Initial Adhesion. 6. Detachment. Extra-cellular polymeric substance (EPS) is synthesized cover a microbial matrix. 4. Attachment. 5. Growth. Fig. 2.4 Sequential steps in biofilm formation. (adapted Gottenbos et al., 1999) (6) Localized detachment of biofilm organisms caused by occasionally high fluid shear or other detachment forces operative starts after initial adhesion, although adhesion of individual microorganism is frequently considered irreversible (whether justified or not), and increase with time as it is related to the number of microorganisms present in the biofilm (Strathmann et al. 2002). Detachment of parts of a biofilm can occur by cohesive failure inside the bulk of the biofilm involving interfacial rupture.. Furthermore, as the number of biofilm organisms increases,. growth rates will decrease due to nutrient and oxygen limitations and accumulation of.
(42) 20. organic acids, eventually leading to a stationary biofilm thickness, where adhesion and growth counterbalance detachment (Gottenbos et al. 1999). Therefore the biofouling mechanism described above indicates that the thickness of biofouling changes with time. The attachment and accumulation of biofouling introduce to the maximum biofouling thickness which later sloughs off due to the shortage of substrate and oxygen for the layer cells next to the membrane. However, in crossflow membrane filtration, the density of the biofilm thickness increases with time until reaching the steady state owing to the effect of continuous shear migration force.. 2.4.2 Stages of MBR fouling For a better understanding of MBR fouling, leading to enhancement of membrane performance in this challenging application, the MBR fouling profile is provided as shown in Fig. 2.5.. Fig. 2.5 Experimental determination of critical flux (Ognier et al. 2004).
(43) 21. Also, Fig. 2.6 depicts a three stage history for membrane fouling in MBRs (Zhang et al. 2006) with: (1) Stage 1: an initial short term rise in trans-membrane pressure (TMP) due to ‘conditioning’ (2) Stage 2: long-term rise in TMP, either linear or weakly exponential (3) Stage 3: a sudden rise in TMP with a sharp increase in dTMP/dt, also known as the TMP jumps (Cho and Fane 2002).. Fig. 2.6 The three stages of MBR fouling (Zhang et al. 2006).
(44) 22. The stages 2 and 3 behavior are typified in the literature by the results of previous studies (Cho and Fane 2002; Ognier et al. 2002) . When operating at fluxes well below the apparent critical flux of the mixed liquor suspended solids, a slow steady rise in TMP (stage 2) was observed which eventually changed to a rapid rise in TMP (stage 3) (Zhang et al. 2006). For sustainable operation the aim would be to limit the extent of stage 1, prolong stage 2 and avoid stage 3 since it could be difficult to restore.. 2.4.3 Factors affecting performance in submerged MBR Zhang et al. (2006) described that the degree of fouling in an MBR will be determined by three basic factors: (1) the nature of the feed; (2) the membrane properties; (3) the hydrodynamic environment experienced by the membrane.. Fig. 2.7 MBR fouling factor roadmap (Zhang et al. 2006).
(45) 23. The interactions between these parameters are complex and, not surprisingly, there are some contradictions in the literature that need to be resolved by further analysis (Zhang et al. 2006). Fig. 2.7 (at the left-hand side) depicts the ‘fouling factors’ and illustrates the complex nature of the feed and the features of the hydrodynamic environment. On the right of Fig. 2.7 are the ‘operation and design characteristics’ of the MBR that are believed to influence the fouling factors.. 2.5 MBR FOULING AND SLUDGE COMPONENTS Membrane fouling and activated sludge components can be outlined in the following section including fouling caused by mixed liquor suspended solids (MLSS), fouling caused by extra-polymeric substance (EPS), and fouling caused by fractions of activated sludge.. 2.5.1 Fouling caused by mixed liquor suspended solids (MLSS) In the development of MBR technology, many studies have focused on the effects of MLSS concentration on membrane fouling. However, the effects of MLSS on membrane fouling are not yet fully understood and controversial reports about the effects of this parameter have been presented. Magara and Itoh (1991) reported that membrane fouling took place more rapidly at higher MLSS concentration similar to the study of Sato and Ishii (1991). Chang et al. (2002) and Defrance and Jaffrin (1999) also came to the same conclusion. On the other hand, some authors have claimed that sludge concentration is not a main influencing factor or has little impact on membrane fouling (Ross et al. 1990; Hong et al. 2002; Le Clech et al. 2003)..
(46) 24. Besides, Lee et al. (2003) suggested that higher MLSS concentration is beneficial to fouling control. No significant effect of MLSS concentration higher than 30,000 mg/L on irreversible fouling was observed by Lubbecke et al. (1995). Also, an exponential relationship between MLSS concentration and membrane fouling resistance was reported in the study of Meng et al. (2006). Nevertheless, all these experiments were carried out on different scales, different operational conditions and different ranges of MLSS concentration. Cho et al. (2005) suggested that influence and interaction of MLSS on membrane fouling should be simultaneously studied together with the changing of operating condition and changing of EPS.. 2.5.2 Fouling caused by extra-polymeric substance (EPS) Extra-cellular polymeric substances (EPS) are products of active secretion, cell surface material shedding, cell lysis and sorption from the environment (Wingender et al. 1999) and EPS has been identified as the main foulant in MBR processes (Rosenberger and Kraume 2003; Janga et al. 2007). The EPS matrix is very heterogeneous and can be characterized by its relative levels of polysaccharides, proteins, and more rarely lipids and nucleic acids (Frolund et al. 1996; Nuengjamnong et al. 2005). EPS is produced by most bacteria and participate in the formation of microbial aggregates whether the bacteria grow in suspended culture or in biofilms (Flemming and Wingender 2001). EPS is mainly responsible for the structural and functional integrity of biofilms, since it forms a protective layer for the cells against harmful external environment such as biocides and sudden changes in pH; absorbing exogenous nutrients and organic molecules; and aggregating bacterial cells in flocs (Fan 2005)..
(47) 25. Consequently, EPS plays an important role in the flocculation, settling and dewatering of activated sludge (Liao 2000). Therefore, the EPS content of activated sludge was suggested as one of the probable indexes for the membrane fouling in MBR system. An equivalent reduction in the cake hydraulic resistance due to a 40% reduction in EPS was reported in the study of Chang and Lee (1998). Nagaoka et al. (1996; 1998) found that EPS was accumulated both in the mixed liquor and on the membrane, which was observed as the reason for the increases of the viscosity and the filtration resistance. Rosenberger and Kraume (2002) compared the concentration of suspended EPS in the liquid phase of eight MBRs and found that the higher the suspended EPS concentration, the lower the filtration index. On the contrary, some research showed that the higher EPS caused a lower shear sensitivity and lower dispersion degree, which led to the better filterability and lower filtration resistance (Mikkelsen and Keiding 2002). EPS can be classified as extracted EPS which are artificially produced from the biological cell flocs and the soluble EPS which are present in the activated sludge supernatant and are not associated with the cell (soluble microbial products or SMP) (Le Clech et al. 2006). So far no standard method for EPS extraction exists, which causes difficulty in making a comparison between research groups.. 2.5.3 Fouling caused by fractions of activated sludge Activated sludge generally contains a range of metabolites produced during the biological reaction and the biomass itself in the form of flocs.. Organic. compounds from the suspension phase are usually divided into three fractions (Levine et al. 1991)..
Figure

+7


Related documents
In this study, whole otolith ages and broken-burnt otolith ages of 167 mirror carps ( Cyprinus carpio ) that live in Keban Dam Lake were determined and similarities and
Torrentius who challenged conventional ideas about religion and philosophy, was a threat to Haarlem’s municipal authorities because he, indeed, might have been a role model
The Dimensional Data folder contains functions that let you perform calculations using multiple objects, such as all measures on a scorecard.. See “Using Application Data” on
ASDs: Autism spectrum disorders; CRH: Corticotropin-releasing hormone; DPBS: Dulbecco ’ s phosphate-buffered saline; ELISA: Enzyme-linked immunosorbent assay; FBS: Fetal bovine
From these curves we see that, for the same number of signal events selected using ANN or BDT, using the event reweighting technique gives much lower background event
The aim for research issue 3 was to design a framework for the evaluation and optimization of a regional groundwater quality monitoring network, using specific information goals
The theoretical foundations of the AOIE framework for the analysis and shaping of λ -systems evolution include the Industrial Ecology Paradigm, Complex Adaptive Systems
The Gateway Center serves as a gateway to the community continuum of care, and as such, can provide information, referral, and contact – for both men and women – to drug and
