promoting access to White Rose research papers
White Rose Research Online [email protected]
Universities of Leeds, Sheffield and York
http://eprints.whiterose.ac.uk/
This is the author’s post-print version of an article published in Acta Materialia
White Rose Research Online URL for this paper:
http://eprints.whiterose.ac.uk/id/eprint/78207
Published article:
Clopet, CR, Cochrane, RF and Mullis, AM (2013) The origin of anomalous eutectic structures in undercooled Ag-Cu alloy. Acta Materialia, 61 (18). 6894 -6902. ISSN 1359-6454
The Origin of Anomalous Eutectic Structures in Undercooled Ag-Cu Alloy
C.R. Clopet, R.F. Cochrane & A.M. Mullis†
Institute for Materials Research, University of Leeds, Leeds LS2-9JT, UK.
Abstract
A melt encasement (fluxing) method has been used to undercool Ag-Cu alloy at
its eutectic composition. The recalescence of the undercooled alloy has been
filmed at high frame rate. For undercoolings < 60 K a microstructure consisting
of mixed anomalous and lamellar eutectic is observed. Analysis of eutectic
spacing in the lamellar eutectic reveals little dependence upon the undercooling
of the bulk melt and is consistent with growth at an undercooling of 1.5 K.
Depending upon undercooling, the progress of the recalescence front may be
either continuous or spasmodic, wherein periods of rapid growth are separated by
significant interludes in which growth totally arrests. Analysis of spot brightness
profiles reveals that during continuous growth the recalescence is characteristic of
the advancement of a planar, space-filling, front while during spasmodic growth a
double recalescence occurs, the first of which is characteristic of the propagation
of a dendritic, or non-space-filling, front. We conclude that during spasmodic
growth we observe the propagation of two-phase, or eutectic, dendrites which
subsequently remelt to form the anomalous eutectic, while the lamellar eutectic
grows during post-recalescence cooling.
Key Words: Eutectic Solidification; Undercooling; Rapid Solidification; Image Analysis;
In-situ imaging
1. Introduction
The solidification of Ag-Cu alloy has been widely studied under both near-equilibrium and
rapid solidification conditions, it being one of the simplest binary eutectic systems, with both
the Cu-rich and Ag-rich phases having the same fcc crystal structure. The phase diagram is
well established, not only with regard to the equilibrium phase boundaries, but also in respect
of their metastable extensions. A range of metastable structures are possible, including the
possibility of complete miscibility in the solid-state. Consequently Ag-Cu is regularly
selected as a suitable system for undercooling studies. Various processing methods have been
employed to investigate solidification of this alloy from its melt, including splat-quenching
[1], glass slag melting [2], laser-quenching [3,4], electron beam melting [5], mushy-state
quenching [6], melt spinning [7,8], levitation techniques [8], melt fluxing [9-13] and
drop-tube processing [14].
Through these studies a variety of microstructures have been observed in the rapidly
solidified alloy. During rapid quenching of the Ag-Cu alloy metastable states, notably an
extension of the rather limited solid solubilities observed at equilibrium, has been achieved
[e.g. 1,4,5]. Other techniques have produced a range of equilibrium and non-equilibrium
microstructures including eutectic [e.g. 5,8,9-14], dendritic [e.g. 5,6,9,12], banded [e.g. 4,5,7]
and anomalous structures [e.g. 2,9,11-14]. At low undercoolings a mixture of eutectic and
anomalous microstructures have been reported to develop from a radial solidification front,
forming “zones” of microstructure radiating from a single nucleation point [11,12,13]. The
lamellar eutectic can take the form of cells in certain zones with anomalous eutectic occurring
at the cell boundaries.
In a binary eutectic, the growth front should be stable against perturbations that could cause
cellular structures to develop. However, the presence of a third element or impurity could
destabilise the front leading to the formation of cells. In an investigation into the addition of a
third element to the Ag-Cu system, it was found that the addition of small amounts of Sb led
has also been demonstrated that a negative temperature gradient ahead of the eutectic front
can have a similar destabilising effect, even in the absence of a third element [15]. In Ag-Cu
Zhou et al. [11] have suggested that destabilisation of the interface may also arise from the
large thermal diffusivity of the alloy melt and the difference in composition of the two phases.
A further morphological change occurs in Ag-Cu as the undercooling is increased, whereby
the microstructure consists of dendrites surrounded by the lamellar eutectic. The dendritic
region consists of a fine-grained, two-phase mixture, the formation of which is ascribed to the
decomposition of the supersaturated solid solution during cooling to room temperature [10].
This critical undercooling has been reported as occurring at 70 K [11], 75 K [10] or 76 K
[9,12], close to the calculated T0 temperature, at which the Gibbs free energies of the liquid
and solid phases of the same composition are equal [9,10].
Transitions with increasing undercooling are also observed in other eutectic systems. A
number of alloys, including Ni-Sn [16,17,18], Ni-Si [19,20], Co-Sb [19], Co-Sn [21], Co-Al
[20], Co-Mo [22] and Co-Si [23], have been seen to undergo a transformation from regular
lamellar to anomalous eutectic structure. In many cases the transition is progressive with the
volume fraction of anomalous eutectic increasing as the level of undercooling rises. This is
also the case in Ag-Cu alloy prior to reaching the critical undercooling of 70-76 K
[9,11,12,14], wherein Wang et al. [14] have suggested that the anomalous eutectic was
formed as a direct product of rapid solidification with the lamellar eutectic growing slowly
after recalescence. The volume fraction of anomalous structure also changes throughout the
sample, with the greatest fraction of anomalous eutectic forming in the zone nearest to the
nucleation site [11,12,13]. At some distance from the point of nucleation a shift from
anomalous to lamellar eutectic occurs, taking the form of columnar and equiaxed grains, or
just columnar grains depending on the level of undercooling, with anomalous eutectic
The mechanism by which the anomalous eutectic structure forms has been a matter of
considerable debate. Suggested mechanisms have included the decomposition of highly
supersaturated single-phase dendrites [1], uncoupled growth of the two solid phases, during
which one phase grows faster than the other [2,4], fragmentation or remelting and ripening of
primary lamellar eutectics [6], remelting of eutectic dendrites [9,10] and also a dual origin
theory [17,18]. Li et al. [17] observed anomalous eutectic formation in Ni-Sn samples at
undercoolings as low as 20 K, wherein the anomalous structure formed with dendritic
contours, and also at high undercoolings (>130 K), wherein the structure was composed of
equiaxed grains of anomalous eutectic. It was concluded that given the significant difference
between the anomalous structure formed at low and high undercoolings the mechanism
giving rise to their origin must be different. The anomalous eutectic formed at low
undercooling was attributed to the remelting and disintegration of lamellar eutectics in
dendritic form while the anomalous structure at high undercoolings was ascribed to the
remelting of primary dendrites. Similar findings were presented by Yang et al. [18] who
found that at relatively low undercoolings (~ 40 K) a fine-grained anomalous eutectic was
formed, which was attributed to the remelting of eutectic dendrites, while at high
undercooling (~ 202 K) a coarse-grained anomalous eutectic was formed by the partial
remelting of single phase dendrites.
There are relatively few reports of systems in which eutectic growth occurs at such high
undercoolings and it has been suggested that such growth may be restricted to systems in
which at least one of the solidifying phases is an intermetallic [24], as in the case of Ni-Sn
where the eutectic is formed between α-Ni and Ni3Sn intermetallic. The most likely
mechanism, therefore, for the formation of anomalous eutectic structure at low undercoolings,
certainly in alloys where both eutectic phases are solid solutions, would be partial remelting
of eutectic dendrites.
In order to further understand the formation of microstructure in undercooled alloys, the
during undercooling experiments. Often a photodiode or pyrometer has been used to perform
this function, however the development of high speed imaging technologies means that rapid
image capture is possible, resulting in well-resolved videos of the growth front. High speed
imaging has been used to monitor solidification of a number of alloys, including Ni-Al [25],
Ni-Ge [26], Ni-Si [27] and Ni-Zr-Al [28] alloys. The Ni-Sn alloy system has also been
investigated using this methodology, although there has been some debate on whether the
nature of growth mechanism permitted the measurement of growth velocity. It was reported
[16] that the growth velocity of Ni-Sn at low undercoolings could not be measured due to
copious multiple nucleation occurring in the melt, which resulted in the formation of eutectic
colonies. However, Yang et al. [18] observed the recalescence of Ni-Sn samples undercooled
from 40 K to 226 K and found that in every case the propagation of a single solidification
front could be tracked across the sample, permitting the measurement of growth velocity and
discounting the copious nucleation hypothesis. It was therefore possible to determine a
positive trend between the growth velocity and undercooling up to critical undercooling when
a sudden rise in growth velocity occurred. This rise was related to a morphological transition
from eutectic dendrites to single-phase Ni-rich dendrites.
The Ag-Cu system has been selected for this study as it has previously been shown that it is
relatively easy to undercool. However, despite the widespread study of Ag-Cu alloy in
undercooling experiments and the inference from evolved microstructures that non-steady
state solidification occurs at low undercoolings with growth velocity changing across the
solidifying samples [2,11], the authors are unaware of any other study using high speed
imaging to monitor the solidification front of the alloy during such undercooling experiments.
A high purity ingot of Ag-Cu alloy of eutectic composition was produced from 99.9999%
purity (metals basis) silver and copper shot obtained from Alfa Aesar. The ingot was formed
by sealing the metal shot in quartz tubing under a protective argon atmosphere and heating in
a furnace to melt the silver and copper together whilst the tube was agitated to ensure
thorough mixing. This procedure was repeated four times after which the quartz tube and
resulting alloy were quenched in water. The ingot was sectioned and analysed using SEM and
EDX to confirm it was homogenous and at the eutectic composition.
A melt fluxing technique was selected as the most suitable method with which to process
Ag-Cu alloy. Samples of approximately 0.8 g of the Ag-Ag-Cu eutectic were cut from the ingot.
Each sample was placed in a fused silica crucible measuring 10 mm in diameter by 20 mm
long. In order to remove any microcracks from the inner surface of the crucibles, which could
initiate nucleation, the crucibles were etched for 45 minutes in 7.2 vol.% HF solution and
then rinsed thoroughly in distilled water followed by methanol prior to use. The crucible was
packed with ground glass flux consisting of a 50:50 mixture of soda lime glass and boron
oxide, this mixture giving the correct viscosity to fully encapsulate and support the alloy melt
in the desired temperature range (from 300 K above to 100 K below the eutectic temperature).
The molten flux supports the sample, isolating it from the solid surface of the crucible, and
draws impurities and surface oxides away from the alloy melt, so inhibiting heterogeneous
nucleation.
Undercooling experiments were performed within a stainless steel vacuum chamber
evacuated to a pressure of 10-3 Pa using a turbo-molecular pump backed by a two stage, oil
sealed, rotary vane pump. After being evacuated at this pressure for two hours the vacuum
chamber was isolated from the pumping system by means of a gate valve and backfilled to 50
kPa with dry, oxygen free, N2 gas. Samples were melted by induction heating of a graphite
susceptor contained within an alumina shell. Viewing slots were cut into the susceptor and
alumina to allow the sample to be viewed through a window in the chamber. Temperature
which had been thinned at the base so reducing the thermal lag between the sample and
thermocouple A schematic diagram of the apparatus is shown in Fig. 1.
Prior to performing the undercooling experiments the B2O3 flux was dehydrated for one hour
by heating to just below its melting point under high vacuum. The sample was then heated to
250-290 K above the eutectic temperature and held for 12 minutes before being allowed to
cool to below the eutectic temperature at the natural cooling rate of the apparatus, whereupon
solidification would occur. This thermal cycling was repeated eight times for each alloy melt,
allowing impurities to be removed from the sample and hence increasing the potential level
of undercooling attainable [29]. The process also has the desirable side-effect of removing
any remaining bubbles from the flux so that the sample can be viewed clearly. On the final
cycle the cooling and subsequent propagation of the recalescence front across the sample was
recorded using a Photron Fastcam SA5 high speed camera. The camera was fitted with a
Nikon AF Micro Nikkor 70-180 mm f/4.5-5.6D ED lens, allowing a clear view of the whole
sample and a small amount of the surrounding flux to be obtained through a side observation
port on the apparatus, as shown in Fig. 1, with a working distance of 30 cm. The camera
frame rate was set so as to be appropriate to the overall recalescence time. Depending upon
undercooling this ranged from a maximum of ≈ 26 s to a minimum of ≈ 4 s, wherein frame
rates of either 250 or 500 frames per second were judged appropriate. The experiment was
repeated with multiple samples in order that a full range of undercooling could be
investigated. Full details of the experimental apparatus are available elsewhere [30].
After removal from the flux each sample was mounted in Bakelite, sectioned, ground on a
series of progressively finer SiC papers and then polished using 6 μm, 3 μm and 1 μm
diamond compounds. Microstructural analysis of the as-solidified samples was undertaken
3. Results & Discussion
Samples of eutectic Ag-Cu alloy were solidified from their parent melt, with the undercooling
being increased from 0 in approximately 10 K steps. As reported by a number of sources [e.g.
9,12-14] the resulting microstructure for undercoolings below 70 K was found to be a mix of
regular lamellar eutectic and anomalous eutectic, the volume fraction of the anomalous
eutectic tending to increase with undercooling, as shown in Fig. 2a-c. No evidence of single
phase dendrites is observed in the eutectic structures formed at ΔT= 60 K, or below. We note
that, as below the solidus line the coupled zone would be expected to extend outwards from
the eutectic point, this lack of dendrites at undercoolings of 0 ≤ΔT ≤ 60 K confirms the
samples were processed at the eutectic composition. If this were not the case we would
expect to see dendrites at low undercooling, giving way to eutectic structures at intermediate
undercooling, as we enter the coupled zone, with dendritic structures reappearing at high
undercooling due to breakdown of the dendritic front.
In contrast, at 70 K, which is around 5 K above the T0-line at the eutectic composition
[9,11,12,14], extensive evidence of single phase dendrites was observed in the microstructure
(Fig. 2d), broadly in agreement with [9]. As the subject of this investigation is the growth of
eutectic structures in Ag-Cu, no further consideration is given here to the material
undercooled by 70 K or above.
The microstructure is generally cellular, with a typical cell consisting of lamellar eutectic in
the body of the cell with anomalous eutectic occurring at the cell boundaries. Zones of
different microstructure were also observed with an initial radial zone of anomalous eutectic
followed by a cellular region of both lamellar and anomalous eutectic. It appears that the
development of the anomalous structure from the initial zone into the cellular zone was
aligned with the growth direction, as determined by high speed imaging, and took the form of
with the volume fraction of this growth mode gradually reducing in favor of lamellar eutectic
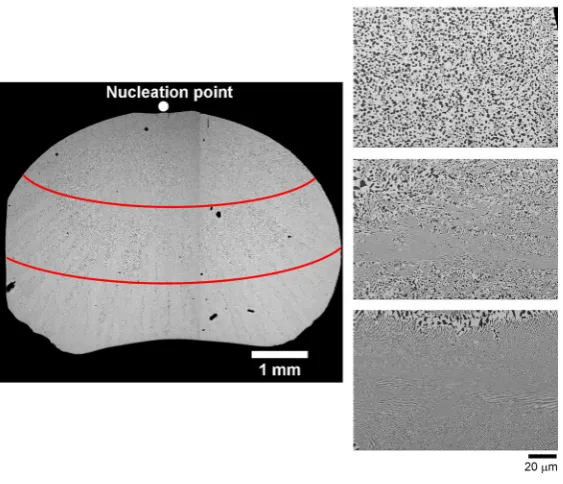
growth. An example of such a structure is shown in Fig. 3, for the sample undercooled by
10 K. The nucleation point for this sample is at the top and the branched fingers of anomalous
eutectic can clearly be seen to start to develop around midway through the droplet and then
propagate towards the surface.
The average eutectic solidification velocity, as determined by the total time taken for
solidification to occur, is shown as a function of undercooling in Fig. 4. We believe that the
indicated drop in recalescence velocity at an undercooling of 60 K is real, this corresponding
to an increase in the total solidification time of 1.67 s. Even so, these average velocities
conceal considerable temporal variations within the instantaneous growth velocity, which can
be explored by plotting the sample brightness as a function of time. In fact it is slightly more
convenient to plot the relative brightness, as this allows samples solidified at a range of
undercoolings to be compared on a single plot. Here we define the relative brightness, ψˆ by
0 0 ) ( ) ( ˆ ψ ψ ψ ψ ψ − − = m t t
where ψ is the mean grey level (0-255 scale) across the image as a function of time and ψ0
and ψm are the corresponding values at the start and end of the recalescence respectively. The
analysis method is described in greater detail elsewhere [13].
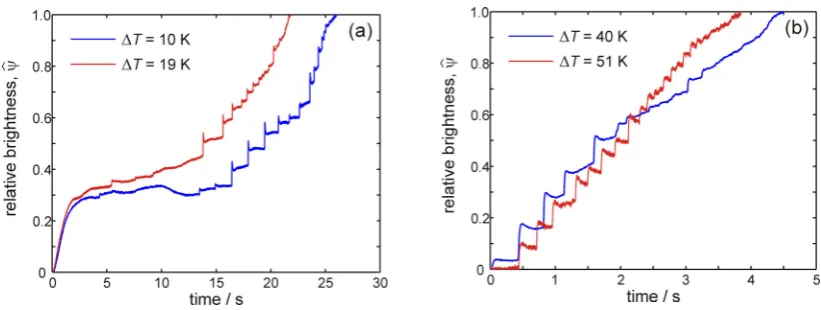
Two undercooling regimes can be identified from these brightness-time plots, ΔT≤ 19 K and
ΔT≥ 27 K. At the lower undercooling (Fig. 5a) growth proceeds initially at an approximately
constant rate before entering an extended period during which time growth arrests and the
front remains essentially static. At ΔT = 10 K this period lasts around 10.2 s. while at
ΔT = 19 K the duration is around 11.5 s. Thereafter the growth enters what we have
previously termed [13] a spasmodic phase, in which the front advances by means of a series
followed by a short arrest period. In Fig. 5a each jump typically spans 20-24 ms, or 5-6
frames. Conversely, at higher undercoolings (Fig. 5b) the sample displays the quasi-periodic,
spasmodic growth phase from the onset of recalescence, eventually tending to continuous
growth, at approximately the same average velocity, towards the end of the recalescence
period. As in Fig. 5a, each of the jumps typically spans 5-6 frames.
In order to further investigate the nature of the solidification process occurring within these
samples it is useful to consider the time evolution of the brightness at fixed points on the
sample. Two such points, located on the sample undercooled by 19 K prior to nucleation, are
shown in Fig. 6a. One lies within the zone in which the initial continuous growth was
observed, the other in the spasmodic growth zone. For the point in the continuous growth
zone there is a continuous increase in the spot brightness. This commences
contemporaneously with nucleation and peaks at a grey level of 100, approximately 2 s
thereafter. Conversely, for the location in the spasmodic growth zone there is a rapid increase
in the brightness 15.6 s after nucleation. The rise time for this increase is 20 ms (5 frames)
with a peak level of 182, after which there is a drop in the spot brightness of the sample.
Broadly similar results are observed for the sample undercooled by 10 K.
It is useful to classify these brightness profiles as being either ‘planar’ or ‘dendritic’ in
character. During dendritic solidification the area behind the solidification front consists of a
mush of dendritic crystals and the remaining interdendritic liquid, this latter acting as a heat
sink for the latent heat released upon solidification. The volume fraction of the solid formed
during the recalescence phase is therefore given, at least approximately, by ΔTcp/L, where cp
is the heat capacity and L the latent heat. Although there is a thermal field ahead of the
solidification front, which will decay with a characteristic length scale of α/V (where α is the
thermal diffusivity of the melt and V the velocity at which the solidification front advances),
the continued propagation of the front does not rely upon the undercooled liquid ahead of the
front acting as a sink for latent heat. Conversely, during the propagation of a planar front, as
fully solid and the continued propagation of the front relies upon either continued heat
extraction through the solid or the undercooled liquid ahead of the front acting as a sink for
the evolved latent heat. The growth of a planar eutectic into an undercooled melt is therefore
normally regarded as being a non-steady-state process, with the continued evolution of latent
heat during growth resulting in continuous warming of the liquid ahead of the growth front
and a consequential slowing of growth with time.
Referring to Fig. 6a, the shape of the brightness-time curves would strongly suggest that in
the continuous growth zone we are observing the propagation of a planar (eutectic) growth
front. The gradual increase in brightness prior to the maximum being observed would then be
ascribed to the approach of the planar eutectic front and its preceding thermal profile. In this
case, the peak in the grey level 2 s after nucleation would represent the planar front crossing
the observation point, and the grey level observed here would correspond to the local
temperature of the eutectic interface. Conversely, the near step change in brightness observed
at the location in the spasmodic growth zone would be much more likely to be indicative of a
dendritic, or non-space filling recalescence, in which a mush was formed behind the
advancing solidification front. However, it is not possible to determine from the video data
whether this is due to the growth of cells or dendrites nor whether these were single or
two-phase (eutectic) cells/dendrites. In relation to the recalescence event at 15.6 s we note that
following the initial rapid increase in brightness there is a rapid drop in brightness, followed
by a second, more gradual recalescence event, detail of which is shown in Fig. 6b. This
second recalescence is similar, both in shape and peak level, to that observed in the
continuous growth zone and may therefore correspond to the planar front growth of a
lamellar eutectic growing into the residual liquid following primary recalescence. However,
noting the very significant difference in peak brightness between the primary and secondary
recalescence events, this would also suggest that the primary recalescence was to a
temperature in excess of the eutectic temperature, which would be consistent with the
anomalous eutectic in the as-solidified samples being formed by partial remelting of primary
solid-solutions will be different, recalescence to a temperature between these two would only melt
one of these phases and coarsen the other. However, as the CCD camera used to record these
images was not temperature calibrated, it is not possible to estimate the recalescence
temperature.
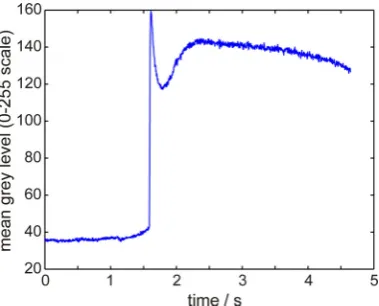
For samples undercooled by 27 K or more, no continuous growth zone is observed and
consequently the spot brightness analysis can only be conducted for spasmodic growth. One
such, obtained for the sample undercooled by 40 K prior to nucleation of solidification, is
shown in Fig. 7 although, as before, broadly similar results are obtained at other
undercoolings. The observation point on the sample was selected whereby solidification
occurred approximately 1.5 s into the recalescence, which in total spans around 4.5 s. As for
spasmodic growth at ΔT = 19 K, a rapid increase in the spot brightness is observed, followed
by a steep decrease which we may associate with rapid local cooling and a subsequent, much
more gentle second recalescence, which, as at lower undercooling, we might associate with
the planar front growth of a regular eutectic growing into the residual liquid remaining after
the primary recalescence. Following this second recalescence event there is a gradual
decrease in brightness which continues until the end of solidification.
If the lamellar eutectic is growing as a result of the observed secondary recalescence event it
will be growing at an undercooling which is small relative to that measured in the bulk
sample prior to nucleation. It is therefore likely that its microstructure will be indicative of
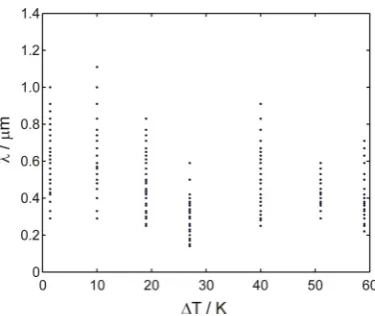
this. Figure 8 shows the measured lamellar spacing, λ, as a function of undercooling, where
each point represents a measurement from a unique location on the sample. In addition to the
undercooled samples discussed above we have also processed, and measured the lamellar
spacing in, a sample solidified with notionally no undercooling. For reasons discussed below,
the measurements for this sample are plotted at an undercooling of 1.5 K. We note from Fig.
8 that the lamellar eutectic spacing is almost constant irrespective of the applied bulk
recalescence and therefore under conditions which are not directly related to the bulk
undercooling.
As would be expected from the theory of eutectic growth [31,32] there is somewhat in excess
of a factor of two difference between the maximum and minimum spacing observed, the
principal mechanism for spacing adjustment being either overgrowth of neighbouring
lamellae, which results in a doubling of the spacing, or bifurcation, which results in the
spacing being halved. We note that, with the exception of a somewhat anomalous point at
ΔT = 27 K, there is little dependence upon bulk undercooling, which is in line with our
supposed origin for the lamellar eutectic fraction, growing post-recalescence.
To better understand the growth conditions pertaining to the formation of the lamellar
eutectic we can apply the scaling laws developed by Jackson & Hunt [31] which relate the
lamellar spacing to the growth rate, V, and the local undercooling at the growth front, ΔTf, via
λ λ 2 1 K V K Tf = + Δ
where K1 and K2 are materials dependent parameters. Moreover, by applying the condition of
growth at minimum undercooling, which will generally be valid in non-faceted/non-faceted
eutectics such as Ag-Cu which can adjust their spacing with relative ease, we also have
1 2 2 K K V e =
λ , 4K1K2
V Te =
Δ
and λeΔTe =2K2
where ΔTe and λe are the extremum undercooling and extremum lamellar spacing
respectively. The value of has been determined experimentally by Cline and Lee [33]
for the Ag-Cu system as 1.4 × 10⁻¹⁷ m3 s-1, while V
e
2 λ
e eΔT
λ for Ag-Cu eutectic is estimated by
Walder and Ryder [9] as 4.3 × 10⁻⁷ K m. From these we obtain K1 = 1.54 × 10¹⁰ K s m-2 and
which we have equated to the minimum observed spacing at a given undercooling. The
results of this calculation are shown in Fig. 9. The average growth velocity corresponding to
the measured λe is estimated as being of the order 2 × 10⁻⁴ m s-1, broadly comparable to the
bulk growth velocity measured at ΔT = 10 K and ΔT = 19 K, but substantially less than that
measured at higher undercooling. The extremum undercooling is typically estimated as being
around 1.5 K, which would be consistent with the lamellar eutectic growing during a second
recalescence event. For this reason the lamellar spacing for the sample with notionally no
undercooling has been plotted at ΔT = 1.5 K. We also note that for the sample at ΔT = 27 K,
in which λe appears anomalous, the growth velocity estimated from is λe is ≈ 7 × 10⁻⁴ m s-1,
comparable to that measured at this undercooling using high speed imaging. It is not clear at
this stage whether this is indicative of some transitional behaviour or whether the measured
λe is unreliable in this case, possibly due to the section plane being misaligned relative to the
growth direction.
4. Summary & Conclusions
A melt encasement (fluxing) technique has been used to undercool Ag-Cu alloy at its eutectic
composition, with the subsequent recalescence of the undercooled melt being filmed at frame
rates of either 250 or 500 fps. For ΔT = 60 K or below, a microstructure consisting of mixed
anomalous and lamellar eutectic is observed, with the volume fraction of the anomalous
eutectic increasing with increasing undercooling. For ΔT≥ 70 K there is extensive evidence
of single phase dendrites within the microstructure and, as the focus of this work is the
formation of eutectic structures, these dendritic structures have not been considered further.
By filming the propagation of the recalescence front across the sample two separate regimes
of behaviour have been identified. At low undercoolings (ΔT≤ 19 K) the front initially
moves across the droplet in a smooth, continuous manner subsequently adopting a spasmodic
growth arrests. At higher undercooling (27 ≤ΔT≤ 60 K) the recalescence is spasmodic from
the outset. Analyses of the brightness-time characteristics of spot regions within the
continuous and spasmodic growth zones reveal significant differences, irrespective of the
undercooling. In the continuous growth zone there is a steady increase in the brightness of the
selected region in advance of the solidification front passing it. Such behaviour is
characteristic of the advance of a planar, space-filling, front, as would be the case with a
lamellar eutectic. Following the passage of the front there is a slow, post-recalescence
cooling of the selected region.
In contrast, during spasmodic growth there is a rapid increase in the spot brightness as the
recalescence front passes. This type of behaviour is characteristic of dendrites and other
non-space filling morphologies in which the solidification front represents the locus of the
dendrite tips and the residual interdendritic liquid acts as a sink for latent heat released by
solidification. Moreover, during spasmodic growth a second recalescence event is observed,
this second recalescence being similar in character to that observed during continuous growth.
We therefore surmise that during spasmodic growth initial recalescence is the result of the
growth of a non space-filling morphology, the most likely of which we consider to be
two-phase (eutectic) cells or dendrites, with the subsequent planar front growth of lamellar
eutectic filling the interdendritic regions. Within such a solidification sequence remelting of
eutectic cells or dendrites is the most likely origin of the anomalous eutectic. This would
appear to be supported by the observation that in the spasmodic region the first recalescence
event is significantly brighter than the second, implying that there may be local heating above
the eutectic temperature to facilitate remelting. Planar front growth does not occur until
considerable post-recalescence cooling has taken place. Measurement of lamellar spacing
within the regular eutectic indicates that growth was independent of the bulk undercooling of
the sample and using the theory of eutectic growth due to Jackson and Hunt we estimate the
extremum undercooling for the lamellar growth at 1.5 K. An origin for the anomalous
eutectic in which it was formed by remelting of eutectic dendrites during the rapid
planar eutectic would also be consistent with the observation of many workers that the
volume fraction of the anomalous structure increases with undercooling.
5. References
1. Linde RK. J. Appl. Phys. 1966;37:934.
2. Powell GLF, Hogan LM. J. Inst. Metals. 1965;93:505.
3. Elliott WA, Gagliano FP, Krauss G. Metall. Trans. 1973;4:2031.
4. Beck DG, Copley SM, Bass M. Metall. Trans. A 1982;13:1879.
5. Boettinger WJ, Shechtman D, Schaefer RJ, Biancaniello FS. Metall. Trans. A
1984;15:55.
6. Prasad YVSS, Ramachandra Rao P, Chattopadhyay K. Acta Metall. 1984;32:1825.
7. Thoma DJ, Glasgow TK, Tewari SN, Perepezko JH, Jayaraman N. Mater. Sci. Eng.
1988;98:89.
8. Fredriksson H, Arai Y, Emi T, Haddad-Sabsevar M, Shibata H. Mater. Trans.
1998;39:587.
9. Walder S, Ryder PL. J. Appl. Phys. 1993;73:1965.
10. Walder S, Ryder PL. J. Appl. Phys. 1993;74:6100.
11. Zhao S, Li JF, Liu L, Zhou YH. Mater. Charact. 2009;60:519.
12. Zhao S, Li JF, Liu L, Zhou YH. J. Alloys and Comp. 2009;478:252.
13. Clopet CR, Cochrane RF and Mullis AM. Appl. Phys. Lett. 2013;102:031906.
14. Wang N, Cao CD and Wei B. Adv. Space Res. 1999;24:1257.
15. Goetzinger R, Barth M, Herlach DM. J. Appl. Phys. 1998;84:1643.
16. Li M, Nagashio K, Kuribayashi K. Acta Mater. 2002;50:3239.
17. Li JF, Jie WQ, Zhao S, Zhou YH. Metall. Mater. Trans. A, 2007;38:1806.
18. Yang C, Gao J, Zhang YK, Kolbe M, Herlach DM, Acta Mater. 2011;59:3915.
19. Goetzinger R, Barth M, Herlach DM, Acta Mater. 1998;46:1647.
21. Liu L, Li J. F, Zhou YH. Acta Mater. 2011;59:5558.
22. Wei B, Herlach DM, Sommer F, Kurz W. Mater. Sci. Eng. A 1994;181-182:1150.
23. Yao WJ, Wang N, Wei B. Mater. Sci. Eng. A 2003;344:10.
24. Li JF, Zhou YH. Acta Mater. 2005;53:2351.
25. Assadi H, Reutzel S, Herlach DM. Acta Mater. 2006;54:2793.
26. Ahmad R, Cochrane RF, Mullis AM. J. Mater. Sci. 2012;47:2411.
27. Ahmad R, Cochrane RF, Mullis AM. Intermetallics. 2012;22:55.
28. Galenko PK, Reutzel S, Herlach DM, Fries SG, Steinbach I, Apel M. Acta Mater.
2009;57:6166.
29. Dragnevski KI, Mullis AM, Cochrane RF. Mater. Sci. Eng. A 2004;375-377:485.
30. Battersby SE, Cochrane RF, Mullis AM. Mater. Sci. Eng. A 1997;226:443.
31. Jackson KA, Hunt JD. Trans. Metall. Soc. AIME 1966;236:1129.
32. Trivedi R, Mangin P, Kurz W. Acta Metall. 1987;35:971.
6. Figures
Fig 1: Schematic view of the apparatus used to undercool Ag-Cu melt via the flux
[image:19.595.170.440.112.249.2]encasement method.
Fig. 2: Series of micrographs showing the progress increase in volume fraction with
undercooling at (a) 10 K, (b) 30 K and (c) 50 K. At 70 K (d) there is extensive evidence of
single phase dendrites indicating breakdown of the eutectic front. Note the (a)-(c) are shown
at the same magnification (d) at lower magnification in order to show the extent of dendrites
[image:19.595.171.422.353.527.2]Fig. 3: Micrograph showing the variation of microstructure across an Ag-Cu alloy
undercooled by 10 K. Nucleation occurred towards the top of the sample, which is shown
here as oriented in the crucible. Outward radiating branched fingers of anomalous eutectic are
clearly visible from midway through the sample. The curved surface at the base of the sample
reflects the geometry of the crucible. To the right are shown typical example microstructures
from the upper, middle and lower area of the sample, with these regions shown on the droplet.
Fig. 4. Velocity-undercooling plot for Ag-Cu eutectic alloy in the undercooling range
10-60 K. Samples undercooled by 70 K or more display partial breakdown of the eutectic
front to single phase dendrites and consequently the velocity is not shown here as this may
not be characteristic of eutectic growth. An interpolating curve is provided as a guide to the
eye only.
Fig. 5. Relative brightness as a function of time showing (a) continuous growth followed by
arrest and then spasmodic growth for solidification at ΔT ≤ 19 K and (b) only spasmodic
[image:21.595.92.503.414.569.2]Fig. 6 (a) Spot brightness at two locations in the sample undercooled by ΔT = 19 K
illustrating the difference between recalescence in the continuous and spasmodic growth
zones and (b) detail of the second recalescence in the spasmodic zone.
[image:22.595.92.510.84.238.2] [image:22.595.206.396.346.499.2]Fig. 8. Lamellar spacing as a function of undercooling for the six undercooled samples
reported and a reference sample that was solidified with notionally zero undercooling.
Fig. 9. Growth velocity and extremum undercooling as calculated from the extremum
[image:23.595.167.410.332.507.2]