This is a repository copy of
A precision study of two eclipsing white dwarf plus M dwarf
binaries
.
White Rose Research Online URL for this paper:
http://eprints.whiterose.ac.uk/108474/
Version: Accepted Version
Article:
Parsons, S. G., Marsh, T. R., Gänsicke, B. T. et al. (16 more authors) (2012) A precision
study of two eclipsing white dwarf plus M dwarf binaries. Monthly Notices of the Royal
Astronomical Society, 420 (4). pp. 3281-3297. ISSN 0035-8711
https://doi.org/10.1111/j.1365-2966.2011.20251.x
[email protected]
https://eprints.whiterose.ac.uk/
Reuse
Unless indicated otherwise, fulltext items are protected by copyright with all rights reserved. The copyright
exception in section 29 of the Copyright, Designs and Patents Act 1988 allows the making of a single copy
solely for the purpose of non-commercial research or private study within the limits of fair dealing. The
publisher or other rights-holder may allow further reproduction and re-use of this version - refer to the White
Rose Research Online record for this item. Where records identify the publisher as the copyright holder,
users can verify any specific terms of use on the publisher’s website.
Takedown
If you consider content in White Rose Research Online to be in breach of UK law, please notify us by
arXiv:1111.5694v1 [astro-ph.SR] 24 Nov 2011
A precision study of two eclipsing white dwarf plus M
dwarf binaries
S. G. Parsons
1⋆, T. R. Marsh
1, B. T. G¨
ansicke
1, A. Rebassa-Mansergas
2,
V. S. Dhillon
3, S. P. Littlefair
3, C. M. Copperwheat
1, R. D. G. Hickman
1,
M. R. Burleigh
4, P. Kerry
3, D. Koester
5, A. Nebot G´
omez-Mor´
an
6, S. Pyrzas
1,
C. D. J. Savoury
3, M. R. Schreiber
2, L. Schmidtobreick
7, A. D. Schwope
6,
P. R. Steele
4and C. Tappert
21Department of Physics, University of Warwick, Coventry, CV4 7AL, UK
2Departmento de F´ısica y Astronom´ıa, Universidad de Valpara´ıso, Avenida Gran Bretana 1111, Valpara´ıso, Chile 3Department of Physics and Astronomy, University of Sheffield, Sheffield S3 7RH, UK
4Department of Physics and Astronomy, University of Leicester, Leicester, LE1 7RH, UK 5Institut f¨ur Theoretische Physik und Astrophysik, Universit¨at Kiel, Germany
6Leibniz-Institut f¨ur Astrophysik Potsdam, An der Sternwarte 16, 14482 Potsdam, Germany 7European Southern Observatory, Alonso de Cordova 3107, Santiago, Chile
Accepted 2011 November 23. Received 2011 November 23; in original form 2011 October 3
ABSTRACT
We use a combination of X-shooter spectroscopy, ULTRACAM high-speed pho-tometry and SOFI near-infrared phopho-tometry to measure the masses and radii of both components of the eclipsing post common envelope binaries SDSS J121258.25-012310.1 and GK Vir. For both systems we measure the gravitational redshift of the white dwarf and combine it with light curve model fits to determine the inclinations, masses and radii. For SDSS J1212-0123 we find an inclination of i = 85.7◦±0.5◦,
masses ofMWD= 0.439±0.002M⊙ andMsec = 0.273±0.002M⊙and radii RWD =
0.0168±0.0003R⊙andRsec= 0.306±0.007R⊙. For GK Vir we find an inclination of i = 89.5◦±0.6◦, masses of MWD = 0.564±0.014M⊙ andMsec = 0.116±0.003M⊙
and radii RWD = 0.0170±0.0004R⊙ and Rsec = 0.155±0.003R⊙. The mass and
radius of the white dwarf in GK Vir are consistent with evolutionary models for a 50,000K carbon-oxygen core white dwarf. Although the mass and radius of the white dwarf in SDSS J1212-0123 are consistent with carbon-oxygen core models, evolution-ary models imply that a white dwarf with such a low mass and in a short period binary must have a helium core. The mass and radius measurements are consistent with helium core models but only if the white dwarf has a very thin hydrogen envelope (MH/MWD610−
6
). Such a thin envelope has not been predicted by any evolutionary models. The mass and radius of the secondary star in GK Vir are consistent with evo-lutionary models after correcting for the effects of irradiation by the white dwarf. The secondary star in SDSS J1212-0123 has a radius ∼9 per cent larger than predicted.
Key words: binaries: eclipsing – stars: fundamental parameters – stars: late-type – white dwarfs
1 INTRODUCTION
Detached eclipsing binaries are a primary source of accu-rate physical properties of stars and stellar remnants. A combination of modelling their light curves and
measur-⋆ [email protected]
ing the radial velocities of both components allows us to measure masses and radii to a precision of better than 1 per cent (e.g. Andersen 1991; Southworth et al. 2005; Southworth et al. 2007; Torres et al. 2010). These measure-ments are crucial for testing theoretical mass-radius rela-tions, which are used in a wide range of astrophysical cir-cumstances such as inferring accurate masses and radii of
2
S. G. Parsons et al.
transiting exoplanets, calibrating stellar evolutionary mod-els and understanding the late evolution of mass transferring binaries such as cataclysmic variables (Littlefair et al. 2008; Savoury et al. 2011). Additionally, the mass-radius relation for white dwarfs has played an important role in estimat-ing the distance to globular clusters (Renzini et al. 1996) and the determination of the age of the galactic disk (Wood 1992).
On the one hand, although ubiquitous in the solar neighbourhood, the fundamental properties of low-mass M dwarfs are not as well understood as those of more mas-sive stars (Kraus et al. 2011). There is disagreement between models and observations, consistently resulting in radii up to 15 per cent larger and effective temperatures 400K or more
below theoretical predictions (Ribas 2006; L´opez-Morales
2007). These inconsistencies are not only seen in M dwarf eclipsing binaries (Bayless & Orosz 2006; Kraus et al. 2011) but also in field stars (Berger et al. 2006; Morales et al. 2008) and the host stars of transiting extra-solar planets (Torres 2007).
On the other hand, the mass-radius relation for white dwarfs is all but untested observationally. Provencal et al.
(1998) used Hipparcos parallaxes to determine the radii
for white dwarfs in visual binaries, common proper-motion (CPM) systems and field white dwarfs. However, the ra-dius measurements for all of these systems still rely to some extent on model atmosphere calculations. For field white dwarfs the mass determinations are also indirect.
Barstow et al. (2005) used Hubble Space Telescope/STIS
spectra to measure the mass of Sirius B to high precision, however, their radius constraint still relied on model at-mosphere calculations and is therefore less direct when it comes to testing white dwarf mass-radius relations. Dou-ble white dwarf eclipsing binaries potentially allow ex-tremely precise measurements of white dwarf masses and radii but have only recently been discovered (Steinfadt et al. 2010; Parsons et al. 2011a; Brown et al. 2011; Vennes et al. 2011b). To date, only a handful of white dwarfs have had their masses and radii model-independently measured, V471 Tau (O’Brien et al. 2001), NN Ser (Parsons et al. 2010a), SDSS J0857+0342 (Parsons et al. 2011b) and SDSS J1210+3347 (Pyrzas et al. 2011). All of these systems are short period post common envelope binaries (PCEBs), demonstrating the potential of these systems for testing mass-radius relations of both low mass stars and white dwarfs.
In this paper we combine X-shooter spectroscopy, UL-TRACAM high-speed photometry and SOFI near-infrared photometry to determine precise system parameters for the eclipsing PCEBs SDSS J121258.25-012310.1 (henceforth
SDSS J1212-0123) (Nebot G´omez-Mor´an et al. 2009) and
GK Vir (Green et al. 1978). We then compare our mass and radius measurements with theoretical mass-radius relations for white dwarfs and low-mass stars.
2 OBSERVATIONS AND THEIR REDUCTION
2.1 ULTRACAM photometry
GK Vir and SDSS J1212-0123 were observed with ULTRA-CAM mounted as a visitor instrument on the 3.5m New
Technology Telescope (NTT) at La Silla in April 2010. ULTRACAM is a high-speed, triple-beam CCD camera (Dhillon et al. 2007) which can acquire simultaneous images in three different bands; for our observations we used the
SDSS u′, g′ and i′ filters. A complete log of these
obser-vations is given in Table 1. The data collected for GK Vir were combined with previous observations of the system taken with ULTRACAM (see Parsons et al. 2010b for de-tails of these observations). We windowed the CCD in order
to achieve exposure times of ∼3 seconds which we varied
to account for the conditions. The dead time between
expo-sures was∼25 ms.
All of these data were reduced using the ULTRACAM pipeline software. Debiassing, flatfielding and sky back-ground subtraction were performed in the standard way. The source flux was determined with aperture photome-try using a variable aperture, whereby the radius of the aperture is scaled according to the full width at half maxi-mum (FWHM). Variations in observing conditions were ac-counted for by determining the flux relative to a comparison star in the field of view. Apparent magnitudes and coor-dinates for each of the comparison stars used are given in Table 2. We flux calibrated our targets by determining atmo-spheric extinction coefficients in each of the bands in which we observed and calculated the absolute flux of our targets using observations of standard stars (from Smith et al. 2002) taken in twilight. Using our absorption coefficients we ex-trapolated all fluxes to an airmass of 0. The systematic error
introduced by our flux calibration is<0.1 mag in all bands.
2.2 SOFIJ-band photometry
We observed both GK Vir and SDSS J1212-0123 with SOFI (Moorwood et al. 1998) mounted at the NTT in April 2010 and April 2011. The observations were made in fast
pho-tometry mode equipped with aJ-band filter. We windowed
the detector to achieve a cycle time of∼10–15 seconds and
offset the telescope every 10 minutes in order to improve sky subtraction. A summary of these observations is given in Table 1.
The dark current removal (which also removes the bias) and flatfielding were performed in the standard way. Sky subtraction was achieved by using observations of the sky when the target had been offset. The average sky level was then added back so that we could determine the source flux and its uncertainty with standard aperture photometry, us-ing a variable aperture, within the ULTRACAM pipeline. A comparison star was used to account for variations in ob-serving conditions, details of these are given in Table 2. Flux
calibration was done using the comparison starJ-band
mag-nitude retrieved from the 2MASS catalogue (Skrutskie et al. 2006).
2.3 X-shooter spectroscopy
GK Vir and SDSS J1212-0123 were both observed with X-shooter (D’Odorico et al. 2006) mounted at the VLT-UT2 telescope on the night of the 4th of April 2010. Due to the
long orbital periods of both systems (∼8 hours) we targeted
the quadrature phases, since these phases are the most sen-sitive to the radial velocity amplitude. Conditions
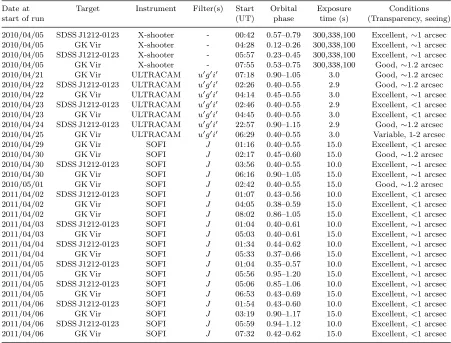
Table 1.Journal of observations. Exposure times for X-shooter observations are for UVB arm, VIS arm and NIR arm respectively. The primary eclipse occurs at phase 1, 2 etc.
Date at Target Instrument Filter(s) Start Orbital Exposure Conditions
start of run (UT) phase time (s) (Transparency, seeing)
2010/04/05 SDSS J1212-0123 X-shooter - 00:42 0.57–0.79 300,338,100 Excellent,∼1 arcsec 2010/04/05 GK Vir X-shooter - 04:28 0.12–0.26 300,338,100 Excellent,∼1 arcsec 2010/04/05 SDSS J1212-0123 X-shooter - 05:57 0.23–0.45 300,338,100 Excellent,∼1 arcsec 2010/04/05 GK Vir X-shooter - 07:55 0.53–0.75 300,338,100 Good,∼1.2 arcsec 2010/04/21 GK Vir ULTRACAM u′g′i′ 07:18 0.90–1.05 3.0 Good,∼1.2 arcsec
2010/04/22 SDSS J1212-0123 ULTRACAM u′g′i′ 02:26 0.40–0.55 2.9 Good,∼1.2 arcsec
2010/04/22 GK Vir ULTRACAM u′g′i′ 04:14 0.45–0.55 3.0 Excellent,∼1 arcsec
2010/04/23 SDSS J1212-0123 ULTRACAM u′g′i′ 02:46 0.40–0.55 2.9 Excellent,<1 arcsec
2010/04/23 GK Vir ULTRACAM u′g′i′ 04:45 0.40–0.55 3.0 Excellent,<1 arcsec
2010/04/24 SDSS J1212-0123 ULTRACAM u′g′i′ 22:57 0.90–1.15 2.9 Good,∼1.2 arcsec
2010/04/25 GK Vir ULTRACAM u′g′i′ 06:29 0.40–0.55 3.0 Variable, 1-2 arcsec
2010/04/29 GK Vir SOFI J 01:16 0.40–0.55 15.0 Excellent,<1 arcsec
2010/04/30 GK Vir SOFI J 02:17 0.45–0.60 15.0 Good,∼1.2 arcsec
2010/04/30 SDSS J1212-0123 SOFI J 03:56 0.40–0.55 10.0 Excellent,∼1 arcsec
2010/04/30 GK Vir SOFI J 06:16 0.90–1.05 15.0 Excellent,∼1 arcsec
2010/05/01 GK Vir SOFI J 02:42 0.40–0.55 15.0 Good,∼1.2 arcsec
2011/04/02 SDSS J1212-0123 SOFI J 01:07 0.43–0.56 10.0 Excellent,<1 arcsec
2011/04/02 GK Vir SOFI J 04:05 0.38–0.59 15.0 Excellent,<1 arcsec
2011/04/02 GK Vir SOFI J 08:02 0.86–1.05 15.0 Excellent,<1 arcsec
2011/04/03 SDSS J1212-0123 SOFI J 01:04 0.40–0.61 10.0 Excellent,∼1 arcsec
2011/04/03 GK Vir SOFI J 05:03 0.40–0.61 15.0 Excellent,∼1 arcsec
2011/04/04 SDSS J1212-0123 SOFI J 01:34 0.44–0.62 10.0 Excellent,∼1 arcsec
2011/04/04 GK Vir SOFI J 05:33 0.37–0.66 15.0 Excellent,∼1 arcsec
2011/04/05 SDSS J1212-0123 SOFI J 01:04 0.35–0.57 10.0 Excellent,∼1 arcsec
2011/04/05 GK Vir SOFI J 05:56 0.95–1.20 15.0 Excellent,∼1 arcsec
2011/04/05 SDSS J1212-0123 SOFI J 05:06 0.85–1.06 10.0 Excellent,∼1 arcsec
2011/04/05 GK Vir SOFI J 06:53 0.43–0.69 15.0 Excellent,∼1 arcsec
2011/04/06 SDSS J1212-0123 SOFI J 01:54 0.43–0.60 10.0 Excellent,<1 arcsec
2011/04/06 GK Vir SOFI J 03:19 0.90–1.17 15.0 Excellent,<1 arcsec
2011/04/06 SDSS J1212-0123 SOFI J 05:59 0.94–1.12 10.0 Excellent,<1 arcsec
2011/04/06 GK Vir SOFI J 07:32 0.42–0.62 15.0 Excellent,<1 arcsec
Table 2.Comparison star apparent magnitudes and coordinates. Magnitudes listed are for those bands for which the comparison star was used.
Target Comp Comp u′ g′ i′ J
star RA Dec
GK Vir 14:15:22.86 +01:19:12.7 14.5 13.5 13.1 -SDSS J1212-0123 12:12:54.97 -01:20:25.0 13.8 12.5 11.9
-GK Vir 14:15:29.31 +01:17:37.9 - - - 13.7
SDSS J1212-0123 12:13:00.51 -01:23:23.3 - - - 13.4
out the night were excellent with seeing consistently below 1 arcsec. Details of these observations are listed in Table 1. X-shooter is a medium resolution spectrograph consist-ing of 3 independent arms that give simultaneous spectra longward of the atmospheric cutoff (0.3 microns) in the UV (the “UVB” arm), optical (the “VIS” arm) and up to 2.5 microns in the near-infrared (the “NIR”arm). We used slit widths of 0.8”, 0.9” and 0.9” in X-shooter’s three arms and binned by a factor of two in the dispersion direction,
result-ing in a resolution ofR∼7,000. We used exposure times of
300 seconds in the UVB arm, 338 seconds in the VIS arm
and 3×100 seconds in the NIR arm. After each exposure
we nodded along the slit to help the sky subtraction in the NIR arm.
The reduction of the raw frames was conducted
us-ing the standard pipeline release of the X-shooter Common Pipeline Library (CPL) recipes (version 1.3.7) within ES-ORex, the ESO Recipe Execution Tool, version 3.9.0. The standard recipes were used to optimally extract and wave-length calibrate each spectrum. For the NIR arm we com-bined frames taken at different nod positions to improve the sky subtraction, however, this does result in a reduc-tion in orbital phase resolureduc-tion. The instrumental response was removed by observing the spectrophotometric standard star GJ 440 and dividing it by a flux table of the same star (Hamuy et al. 1992) to produce the response function, this was also used to apply a telluric correction to the spectra. We then heliocentrically corrected the wavelength scales of
each of the spectra. We achieved a signal-to-noise (S/N) for
GK Vir of∼20 in the UVB arm per exposure,∼15 in the
[image:4.612.150.433.495.568.2]4
S. G. Parsons et al.
Figure 1.Averaged X-shooter spectrum of SDSS J1212-0123. The SDSSu′g′r′i′z′and 2MASSJHKmagnitudes and filter widths are
also shown. A zoom in on the white dwarf features are shown inset with the narrow Caiiand Mgiiabsorption features labelled, although the Caiifeature is somewhat filled in by emission from the secondary star.
VIS arm per exposure and∼5 in the NIR arm per pair of
nodded exposures. For SDSS J1212-0123 we achieved aS/N
of∼20 in the UVB arm per exposure,∼30 in the VIS arm
per exposure and∼20 in the NIR arm per pair of nodded
exposures.
2.4 Flux calibration
The ULTRACAM and SOFI light curves were used to flux calibrate the X-shooter spectra. We fitted a model to each of the light curves (see Section 3.1.8) in order to reproduce the light curve as closely as possible. The model was then used to predict the flux at the times of each of the X-shooter observations (GK Vir shows no stochastic variations or flar-ing, whilst small flares were seen in one ULTRACAM obser-vation and two SOFI obserobser-vations of SDSS J1212-0123 but were removed before fitting).
We then derived synthetic fluxes from the spectra for
the ULTRACAM u′, g′,r′, i′ and z′ filters as well as the
SOFIJ,H and K filters. We extrapolated the light curve
models to those bands not covered by our photometry. We then calculated the difference between the model and syn-thetic fluxes and fitted a second-order polynomial to them. This correction was then applied to each spectrum. This cor-rects for variable extinction across the wavelength range, as well as variations in seeing.
3 RESULTS
3.1 SDSS J1212-0123
SDSS J1212-0123 was initially listed as a quasar candidate from the Sloan Digital Sky Survey (SDSS) by Richards et al. (2004). Silvestri et al. (2006) reclassified it as a white dwarf plus main-sequence binary and eclipses were discovered by
Nebot G´omez-Mor´an et al. (2009) who derived the basic
system parameters. However, their analysis was limited by the fact that they did not resolve the white dwarf ingress
or egress and could not measure the radial velocity ampli-tude of the white dwarf. They found that SDSS J1212-0123
contained a relatively hot (17,700±300K) low mass white
dwarf with an active M4 main-sequence companion in an
8h3m period.
3.1.1 Spectral features
Figure 1 shows an average spectrum of SDSS J1212-0123. The white dwarf dominates the spectrum at wavelengths shorter than 0.55 microns whilst at longer wavelengths the spectral features of the secondary star dominate. There are also numerous emission lines throughout the spectrum
orig-inating from the secondary star. Additionally, both Caii
3934˚A and Mgii4481˚A absorption from the white dwarf are
seen, likely the result of low level accretion from the wind of the secondary star. The fact that absorption features are seen from both stars allows us to measure the radial veloci-ties for both components of the system directly.
3.1.2 Atmospheric parameters of the white dwarf
Nebot G´omez-Mor´an et al. (2009) determined the
temper-ature of the white dwarf in SDSS J1212-0123 by decom-posing the SDSS spectrum. We computed the average X-shooter spectrum of the white dwarf by removing the M-dwarf contribution from the individual spectra using obser-vations of the M4 star GJ 447, and shifting the residual spec-tra to the rest frame of the white dwarf, however this does not remove the emission components. We then fit the av-erage white dwarf spectrum following the method outlined in Rebassa-Mansergas et al. (2007, 2010), using a grid of pure hydrogen model atmospheres calculated with the code described by Koester (2010). We down-weight the cores of the Balmer lines since they are contaminated by emission
from the secondary star, we do not use the Hα line since
the secondary star dominates at this wavelength, all other
lines were used. We find a temperature of 17,707±35K,
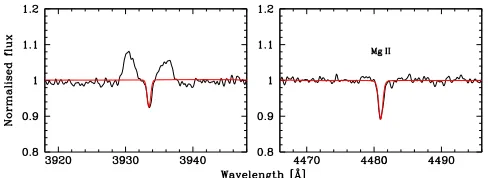
Figure 2.The X-shooter spectra of SDSS J1212-0123, averaged in the white dwarf rest-frame and normalised (black) along with the best-fit white dwarf model (Teff = 17707, logg= 7.51) and
log[Mg/H] =−5.8. The Ca K line is contaminated by the emission from the secondary star (which appears shifted/smeared in the rest frame of the white dwarf), however, adopting the same abun-dance for Ca provides a reasonable match to the photospheric absorption line.
a surface gravity of logg = 7.51±0.01 and a distance of
228±5pc, all of which is consistent with the results from
Nebot G´omez-Mor´an et al. (2009) (and from our light curve
fit, see Section 4). Note that these are purely statistical un-certainties.
Next, we fitted the equivalent width of the observed
Mgii4481˚A absorption line (90±20 m˚A) by varying the Mg
abundance in the synthetic spectrum, keepingTeff and logg
fixed to the values determined above. The best-fit
abun-dance by number is log[Mg/H] = −5.8±0.1,
correspond-ing to ≃ 4% of the solar value. Figure 2 shows the fit to
the Mgii4481˚A line. The Ca K line is significantly
contam-inated by the emission line of the companion star, however, Figure 2 illustrates that adopting the Mg abundance also for Ca matches the observed Ca K line reasonably well.
Since there is no convection zone acting as a reservoir for the accreted elements, the settling times vary throughout
the atmosphere. At optical depth∼2/3, representative for
the visible spectrum, the timescale for Mg is a few tens of days. The diffusion time scale for the temperature and
sur-face gravity derived above is∼2 months (Koester & Wilken
2006), it is hence plausible to assume accretion-diffusion
equilibrium. Hence, XMgρvMg = constant, with XMg and
vMg the mass fraction and the diffusion velocity (relative
to hydrogen) of Mg, and ρ the mass density. We
com-pute at τRoss ≈ 2/3 ρ = 5.23 ×10⁻⁸g cm−3, XMg =
3.76×10⁻⁵, andv
Mg= 8.48×10⁻²cm s−1, i.e. a mass flux of
1.67×10⁻¹³g cm−2s−1. Multiplying by the white dwarf
sur-face area, withRWDfrom Table 9, the total mass flux of Mg
is 2.9×10⁶g s−1 – which is equal to the mass accretion rate
of Mg at the surface of the white dwarf. Assuming that the donor star transfers material of solar composition, the total accretion rate is then obtained by dividing the Mg rate by
the mass fraction of Mg in the Sun, i.e. ˙M≃4.0×10⁹g s−1
or 6.4×10⁻¹⁷M
⊙yr−1. This value is right in the middle
of the accretion rates calculated for the pre-CVs RR Cae, UZ Sex, EG UMa, LTT 560 and SDSS J121010.1+334722.9 by Debes (2006), Tappert et al. (2011), and Pyrzas et al.
(2011), 9×10⁻¹⁹M
⊙yr−1 to 5×10⁻¹⁵M⊙yr−1.
Table 3.White dwarf absorption features in SDSS J1212-0123.
Line KWD γWD
(km s−1) (km s−1)
Caii3933.663 102.71±1.32 37.36±1.12 Hδ4101.735 106.22±2.21 35.14±1.85 Hγ4340.465 104.28±1.24 37.43±1.08 Mgii4481.126 104.53±0.78 35.75±0.67 Hβ4861.327 105.49±0.93 35.25±0.42 Hα6562.760 103.32±1.13 38.66±0.97
3.1.3 White dwarf radial velocity
The orbital phases of the X-shooter spectra of SDSS J1212-0123 were determined using the ephemeris derived in
Sec-tion 3.1.6. As previously menSec-tioned both Caii and Mgii
absorption from the white dwarf are present. Additionally, the cores of the longer wavelength hydrogen absorption lines
(Hδto Hα) are narrow and suitable for radial velocity
mea-surements.
We measured the radial velocities of the absorption lines by simultaneously fitting all of the spectra. We used a com-bination of a straight line and Gaussians for each spectrum (including a broad Gaussian component to account for the wings of the absorption in the case of the Balmer lines) and allowed the position of the Gaussians to change velocity ac-cording to
V =γ+Ksin(2πφ),
for each star, whereγis the velocity offset of the line from its
rest wavelength andφis the orbital phase of the spectrum.
The parameters determined from the fits to the white dwarf absorption features are listed in Table 3. The fits to several of the absorption features are also shown in
Fig-ure 3, the fit to the Hα line is also shown in Figure 4.
Taking a weighted average of the radial velocities gives a
radial velocity amplitude of the white dwarf of KWD =
104.4±0.5 km s−1.
3.1.4 Secondary star radial velocity
There are both absorption and emission features originating from the secondary star seen in the X-shooter spectra. How-ever, the emission features are due to irradiation from the white dwarf hence they do not track the true radial velocity of the secondary star but the centre of light of the emission region, which will be offset towards the white dwarf. There-fore we can only directly measure the velocity amplitude for the secondary star via the absorption lines.
Sodium and Potassium absorption lines are present in the spectra which we fitted in the same way as the white dwarf absorption features. The result of these fits are given in Table 4. There were also a number of molecular absorp-tion features which we do not fit due to the uncertainty in their rest wavelengths and their broad, non-Gaussian pro-files. Other atomic absorption features are seen at longer
wavelengths (for example: the Nai doublet at 2.2 microns)
but the S/N of these features are too low to reliably fit
them. A weighted average of the radial velocities of the lines in Table 4 gives a radial velocity amplitude of the
secondary star of Ksec = 168.3±0.3 km s−1. This is
[image:6.612.339.513.95.189.2]6
S. G. Parsons et al.
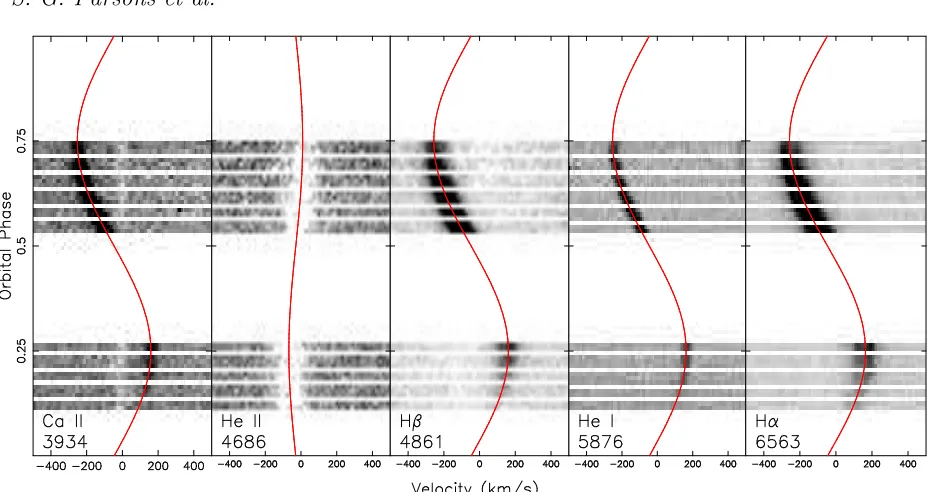
Figure 3.Trailed spectra of several lines in SDSS J1212-0123. The grey-scale runs from white (75 per cent of the continuum level) to black (125 per cent of the continuum level). The Caii3934˚A line shows an absorption component from the white dwarf and an emission component from the M star. The Mgii 4481˚A line is from the white dwarf, a weak Feiemission line is also visible. Hα shows both absorption from the white dwarf and emission from the M dwarf. The Kiabsorption line and the Naiabsorption doublet originate from the M star, a telluric correction was applied but artifacts still remain in the Naitrail. The red lines (online version only) show the best fits to the lines.
Figure 4. Radial velocity fits to the Hα absorption from the white dwarf and Nai8183˚A absorption from the secondary star in SDSS J1212-0123 with residuals plotted below.
what lower than the value of Ksec = 181±3 km s−1 found
by Nebot G´omez-Mor´an et al. (2009). To try and resolve
this difference we re-fitted the radial velocity data from
Nebot G´omez-Mor´an et al. (2009) and found aχ2= 25 for
10 points with 2 variables, implying that they slightly un-derestimated their error. Accounting for this, their value is
consistent with ours to within 2.5σbut, based on our higher
resolution and additional clean features (not affected by
tel-luric absorption), we favour our value for Ksec. We find no
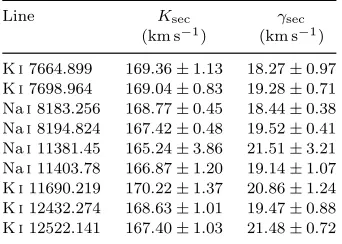
Table 4. Secondary star atomic absorption features in SDSS J1212-0123. There are several additional atomic absorption features in the NIR arm spectra but theS/N of these lines are too low to reliably fit them.
Line Ksec γsec
(km s−1) (km s−1)
Ki7664.899 169.36±1.13 18.27±0.97 Ki7698.964 169.04±0.83 19.28±0.71 Nai8183.256 168.77±0.45 18.44±0.38 Nai8194.824 167.42±0.48 19.52±0.41 Nai11381.45 165.24±3.86 21.51±3.21 Nai11403.78 166.87±1.20 19.14±1.07 Ki11690.219 170.22±1.37 20.86±1.24 Ki12432.274 168.63±1.01 19.47±0.88 Ki12522.141 167.40±1.03 21.48±0.72
evidence that the absorption lines are affected by irradia-tion from the white dwarf. The equivalent widths of these lines do not vary with phase and no effects are visible in the radial velocity curves.
We also measured the radial velocity amplitudes of all of the identified emission lines. However, for these lines we allow the height of the emission line to vary with orbital phase according to
H=H0−H1cos(2πφ),
which allows the height to peak at phase 0.5, where the irradiation effect is largest. This approach gives better fits than keeping the height at a fixed value.
The results of these fits are given in Table A1, in the appendix. We find that the emission lines give a range of
[image:7.612.340.511.444.566.2]Table 5. Eclipse times for SDSS J1212-0123. (1) Nebot G´omez-Mor´an et al. (2009), (2) This paper.
Cycle MJD(BTDB) Reference No. (mid-eclipse)
0 54104.2092(21) (1)
122 54145.1854(8) (1)
125 54146.1929(8) (1)
205 54173.0628(10) (1)
410 54241.9170(21) (1)
1455 54592.9008(14) (1) 3593 55310.9934268(59) (2)
radial velocities, likely due to the different optical depths of the lines (Parsons et al. 2010a). Figure 3 shows the fits to
the Naidoublet as well as several emission lines. The fit to
the Nai8183˚A line is shown in Figure 4.
3.1.5 White dwarf ’s gravitational redshift
General relativity tells us that the gravitational redshift of a white dwarf is given by
Vz = 0.635(M/M⊙)(R⊙/R) km s−1 (1)
whereMandRare the mass and radius of the white dwarf.
Furthermore, if we know the radial velocity amplitudes of the two stars then Kepler’s third law tells us
MWD=
P Ksec(KWD+Ksec)2
2πGsin3i (2)
wherePis the orbital period, andiis the orbital inclination.
Therefore for a given inclination we can calculate the mass of the white dwarf via Eq (2) and the radius of the white dwarf via a model fitted to the primary eclipse, and thus predict a redshift. Hence we can use the measurement of the gravita-tional redshift to constrain the inclination by rejecting light curve models which do not satisfy this constraint.
The gravitational redshift can be measured from the
difference in the velocities of the two components (γWD−
γsec).γsec is tightly constrained due to the large number of
emission lines as well as many absorption features. Taking an inverse variance weighted mean of the secondary star line
velocities (from Tables 4 and A1) we found γsec = 19.93±
0.06 km s−1. We calculatedγ
WD in the same way using the
values in Table 3 which gaveγWD= 36.0±0.3 km s−1. We
found no evidence of pressure shifts in these lines, although these are expected to be small for calcium and magnesium (Vennes et al. 2011a).
Using these measurements we determined the
gravi-tational redshift of the white dwarf to be Vz = 16.1±
0.3 km s−1. The true gravitational redshift of the white dwarf
will actually be slightly higher than this value since the mea-sured value includes the effects of the secondary star (see Section 3.1.8 for details of these corrections).
3.1.6 Eclipse time
We recorded one eclipse of SDSS J1212-0123 with ULTRA-CAM. This provides the first high-precision eclipse time for this system. The SOFI eclipses are not suitable for long term period studies as they are not precisely timed. The eclipse
time, as well as all previous eclipse times, are listed in Ta-ble 5. The new time is consistent with the ephemeris of
Nebot G´omez-Mor´an et al. (2009) but since it is of higher
precision we use it to update the ephemeris to
MJD(BTDB) = 54104.209 17(48) + 0.335 870 93(13)E,
where we have used barycentric dynamical time (TDB) cor-rected for the light travel time to the barycentre of the solar system (BTDB). Since this is the first precise eclipse time, no long-term period trend is yet visible in the data.
3.1.7 Spectral type of the secondary star
From their spectral decomposition
Nebot G´omez-Mor´an et al. (2009) determined the spectral
type of the secondary star in SDSS J1212-0123 to be
M4±1. We detect the secondary star during the eclipse in
all bands except theu′ band giving us multi-colour
infor-mation. We measure magnitudes for the secondary star of
g′= 19.73±0.04,i′= 17.384±0.004 andJ= 14.949±0.001.
Thei′−J = 2.435±0.004 colour implies a spectral type
of M4 for the secondary star (Hawley et al. 2002, Table 3),
consistent with the result from Nebot G´omez-Mor´an et al.
(2009). The distance determined from the spectroscopic fit
(228±5 pc) means that the absoluteJ band magnitude of
the secondary star isMJ = 8.2. Using theMJ-spectral type
relation from Hawley et al. (2002), also gives a spectral type of M4.
3.1.8 Modelling the light curves
The light curves of SDSS J1212-0123 are characterised by a deep eclipse of the white dwarf (which gets shallower in the longer wavelength bands). There is little variation out of eclipse and we found no evidence of a secondary eclipse in any of the light curves.
We fitted all of our photometry (for both SDSS J1212-0123 and GK Vir) using a code written to produce models for the general case of binaries containing a white dwarf (see Copperwheat et al. 2010 for details). It has been used in the study of other white dwarf-main sequence binaries (Pyrzas et al. 2009; Parsons et al. 2010a). The program sub-divides each star into small elements with a geometry fixed by its radius as measured along the direction of centres to-wards the other star. Roche geometry distortion and irra-diation of the secondary star are included, the irrairra-diation
is approximated byσT′4
sec = σTsec4 +AFirr where T′sec is
the modified temperature andTsecis the temperature of the
unirradiated main-sequence star,σis the Stefan-Boltzmann
constant,A is the fraction of the irradiating flux from the
white dwarf absorbed by the secondary star andFirris the
irradiating flux, accounting for the angle of incidence and distance from the white dwarf.
The parameters needed to define the model were: the
mass ratio,q=Msec/MWD, the inclination,i, the sum of the
unprojected stellar orbital speedsVs= (KWD+Ksec)/sin(i),
the stellar radii scaled by the orbital separationRsec/aand
RWD/a, the unirradiated temperatures,Teff,WDandTeff,sec,
quadratic limb darkening coefficients for the both stars, the
time of mid eclipse, T0 and the period, P. Note that the
temperatures are really just flux scaling parameters and only approximately correspond to the actual temperatures.
8
S. G. Parsons et al.
[image:9.612.131.453.391.504.2]Figure 5.ULTRACAMu′,g′andi′ and SOFIJ band primary eclipses of SDSS J1212-0123 with model fits and residuals.
Table 6.Parameters from Markov chain Monte Carlo minimisation for SDSS J1212-0123, some fitted, some fixed a priori (those without quoted uncertainties).aandbare the quadratic limb darkening coefficients.Ais the fraction of the irradiating flux from the white dwarf absorbed by the secondary star.
Parameter u′ g′ i′ J
i(deg) 86.1±2.2 85.7±0.6 85.8±0.8 85.5±0.8
rWD/a 0.0092±0.0002 0.0092±0.0002 0.0093±0.0002 0.0092±0.0002
rsec/a 0.171±0.016 0.171±0.005 0.170±0.006 0.172±0.006
Teff,sec(K) 2618±112 2947±26 3009±41 3342±42
aWD 0.2444 0.1340 0.1071 0.0639
bWD 0.2256 0.2899 0.1891 0.1342
asec 0.5866 0.6720 0.4193 0.0254
bsec 0.2959 0.2660 0.4109 0.4826
A 1.60±0.50 0.81±0.09 0.45±0.03 0.39±0.02
The light curves are only weakly dependent uponqand
Vs. However, we can use them, as well as our measurements
of the radial velocity amplitudes and the gravitational red-shift of the white dwarf, to help constrain the orbital incli-nation. This is done by computing the radial velocity am-plitudes via
KWD = (q/(1 +q))Vssini (3)
Ksec = (1/(1 +q))Vssini, (4)
we can also compute the masses using
M =P Vs3/2πG, (5)
where M is the total system mass. The individual masses
are then
MWD = M/(1 +q) (6)
Msec = qMWD. (7)
The orbital separationais then calculated from
a=Vs/2πP, (8)
allowing us to calculate the radii of the two stars. Combining
all these calculations yields the masses and radii of both stars. We can then use these to calculate the gravitational redshifts using
Vz,WD = 0.635
MWD RWD
+Msec
a
+(KWD/sini)
2
2c (9)
Vz,sec = 0.635
Msec Rsec
+MWD
a
+(Ksec/sini)
2
2c , (10)
then the valueVz =Vz,WD−Vz,secis equivalent to the
mea-sured redshift from the X-shooter spectra, which takes into account the effects of the secondary star on the measurement of the white dwarf’s gravitational redshift. Therefore after
we have generated a model we can computeKWD,Ksecand
Vz from the fitted parameters and either reject or accept
that model based on how close they are to the measured values.
We used the Markov Chain Monte Carlo (MCMC) method to determine the distributions of our model pa-rameters (Press et al. 2007). The MCMC method involves making random jumps in the model parameters, with new models being accepted or rejected according to their
Figure 6.Averaged X-shooter spectrum of GK Vir. The SDSSu′g′r′i′z′and UKIDSSJHmagnitudes and filter widths are also shown,
the UKIDSSJ band observations were made during the primary eclipse. A zoom in on the white dwarf features are shown inset with the narrow Heiiabsorption feature labelled.
bility computed as a Bayesian posterior probability. In this
instance this probability is driven by a combination of χ2
and the prior probability from our spectroscopic constraints (see Parsons et al. 2011b and Pyrzas et al. 2011 for more details of the MCMC fitting process).
For fitting the light curves of SDSS J1212-0123, we phase folded the data and kept the period fixed as one. We also kept the temperature of the white dwarf fixed at 17,900K (see Section 3.1.2). For the secondary star we used quadratic limb darkening coefficients from
Claret & Bloemen (2011) for aTeff = 3000,logg= 5 main
sequence star. For the white dwarf we calculated quadratic limb darkening coefficients from a white dwarf model with
TWD= 17,900 and logg= 7.53 based on our spectroscopic
fits, folded through the ULTRACAMu′,g′,i′ and SOFIJ
filter profiles. For both stars we quote the coefficientsaand
bwhereI(µ)/I(1) = 1−a(1−µ)−b(1−µ)2, whereµis the
cosine of the angle between the line of sight and the surface normal. We kept all limb darkening parameters fixed.
Table 6 lists the best fit parameters from the light curves
and their 1σ uncertainties, we also list the limb darkening
coefficients used for each band. The results from all four bands are consistent. Figure 5 shows the fits to the primary eclipses in each band and the residuals to the fits.
3.2 GK Vir
GK Vir (PG 1413 + 015) was discovered by Green et al. (1978) from the Palomar-Green survey for ultraviolet-excess objects (Green et al. 1986). An eclipse was recorded dur-ing a subsequent spectroscopic observation. Fulbright et al. (1993) combined the photometry from Green et al. (1978) and high resolution spectroscopy to constrain the system parameters. They found that GK Vir contains a hot DAO white dwarf with a low-mass M3-5 main sequence
compan-ion in an 8h16mperiod. However, their lack of radial velocity
information limited their analysis.
3.2.1 Spectral features
Figure 6 shows an average X-shooter spectrum of GK Vir. The hot white dwarf dominates the spectrum at wavelengths
shorter than 1 micron. In the J band the secondary star
contributes roughly 50 per cent of the overall flux. Hy-drogen Balmer absorption lines from the white dwarf are
visible as well as narrow Heii4686˚A absorption from the
white dwarf, making it a DAO white dwarf, as mentioned by Fulbright et al. (1993). Numerous emission lines origi-nating from the heated face of the secondary star are seen
throughout the spectrum. Nai (8183˚A, 8195˚A) absorption
originating from the secondary star is seen before phase 0.25 but decreases in strength towards phase 0.5 due to the in-creased ionisation and therefore cannot be used to measure the radial velocity amplitude of the secondary star. No other absorption features for the secondary star are visible.
3.2.2 Atmospheric parameters of the white dwarf
We fitted the X-Shooter spectrum, averaged in the white dwarf rest-frame, to obtain an estimate of the effective tem-perature. As for SDSS J1212-0123 (see Section 3.1.2), we
fitted the normalised Balmer lines, including Hβto Hζ and
down-weighting the regions that are noticeably contami-nated by emission lines. The best-fit gives a temperature
of 55995±673K, a surface gravity of logg= 7.68±0.04 and
a distance of 550±20 pc. We note that the quoted errors
are purely statistical, and that systematic effects are very likely affecting these results. The X-Shooter data were
ob-tained near the quadrature phases (φ ≃ 0.25 and 0.75, in
order to measureKWD andKsec), which results in a
signifi-cant contamination by emission from the strongly irradiated inner hemisphere of the secondary star. Varying the wave-length range around the lines that is down-weighted affects the resulting temperature by several 1000 K. For compari-son, we also fitted the lower-resolution SDSS spectrum of GK Vir, obtained near superior conjunction of the
10
S. G. Parsons et al.
Figure 7.Trailed spectra of several lines in GK Vir. The grey-scale runs from white (75 per cent of the continuum level) to black (125 per cent of the continuum level). The Caii 3934˚A line shows emission from the M star as well as weak interstellar absorption which shows no radial velocity variations. The Heii 4686˚A line originates from the white dwarf. The Hβ and Hαemission from the M star shows inverted cores and asymmetric profiles similar to those seen in NN Ser (Parsons et al. 2010a). The red lines (online version only) show the best fits to the lines.
ion, and findTeff = 52258±3131 K, logg= 7.66±0.18, and
d= 509±61 pc.
Fulbright et al. (1993) analysed a blue spectrum of
GK Vir obtained near the eclipse (φ≃0.02), i.e. when the
heated inner hemisphere of the companion contributes least
to the observed flux. By fitting the Hβ-HζBalmer lines and
the Heii4686˚A line they determinedTeff= 48800±1200 K
and logg = 7.70±0.11. They also modelled the single
available far-ultraviolet spectrum of GK Vir, and obtained
T=50000 K. A major limitation of this spectrum obtained
with IUE was that the photospheric Lyα line was nearly
completely filled in by geocoronal emission.
We conclude that the effective temperature and dis-tance of the white dwarf GK Vir remains somewhat
uncer-tain, Teff ≃ 50000 K and d ≃ 500±50 pc. However, it is
reassuring that all the spectroscopic measurements of the surface gravity are consistent with the value that is deter-mined from the light curve fit (see Section 4).
Fitting the Heii4686˚A absorption line from the white
dwarf in GK Vir gives a helium abundance of log[He/H] =
−2.8±0.3 by numbers. Assuming that the secondary star
transfers material of solar composition, the total accretion
rate is ˙M ≃ 1.4×10⁹g s−1 or 2.2×10⁻¹⁷M
⊙yr−1, once
again consistent with other pre-CVs.
3.2.3 White dwarf radial velocity
Due to the high temperature of the white dwarf, the Balmer lines lack narrow cores and are therefore unsuitable for ra-dial velocity work. We measured the rara-dial velocity of the
white dwarf in GK Vir from the Heii 4686˚A absorption
line using the same technique as we used for SDSS
J1212-0123. Figure 7 shows a trail of the Heii line and
Fig-Figure 8.Radial velocity fits to the Heii4686˚A absorption from the white dwarf and Hβ emission from the secondary star in GK Vir with residuals plotted below. The emission component does not track the centre of mass of the secondary star (see Sec-tion 3.2.5).
ure 8 shows the fitted radial velocity curve, which gives a
value ofKWD = 38.6±0.8 km s−1 and a velocity offset of
γWD=−27.2±0.7 km s−1.
3.2.4 Emission lines
A large number of emission lines are seen in the spectrum of GK Vir caused by the heating of the secondary star by the
[image:11.612.305.546.379.560.2]Figure 9.Left:radial velocities of the emission lines from the secondary star in SDSS J1212-0123. The measured value of centre of mass radial velocity (Ksec) is also shown. The two dashed lines denote the radial velocity that an optically thick and optically thin line would
have. The solid line at 133 km s−1 is a weighted average of the radial velocity amplitudes of the Fe
ilines, these appear to be optically thin. The radial velocity amplitudes of the hydrogen Balmer lines and the calcium H and K lines are far above the optically thick limit implying that these lines originate, at least in part, from stellar activity.Right:a similar plot but for GK Vir. However, in this case we were unable to directly measureKsecfrom the spectroscopy, but by assuming that the Feilines are optically thin we get a consistent solution. The much tighter limits and smaller correction in GK Vir imply that the secondary star is quite small.
white dwarf. However, the secondary star in GK Vir receives a much larger irradiating flux to that in SDSS J1212-0123 due to the higher temperature of the white dwarf, therefore a larger number of lines are present and from higher ionised
states. Unfortunately the strength of the Nai absorption
doublet is too low after phase 0.25 and, combined with the lack of any other absorption features from the secondary star, means that we are unable to get a direct measurement of the radial velocity amplitude of the centre of mass of the secondary star. We determine the radial velocities and off-sets of all of the emission lines identified using the same method used for SDSS J1212-0123, these are listed in Ta-ble A2 in the Appendix. We use these results to determine a
velocity offset ofγsec=−47.35±0.05 km s−1, giving a
mea-sured redshift for the white dwarf ofVz= 20.2±0.7 km s−1.
3.2.5 Kseccorrection
As previously noted the emission lines in the X-shooter
spec-tra of GK Vir cannot be used to directly measure Ksec,
needed for accurate mass determinations. We need to de-termine the deviation between the reprocessed light centre and the centre of mass for the secondary star. The radial
velocity of the centre of mass (Ksec) is related to that of the
emission lines (Kemis) by
Ksec=
Kemis
1−f(1 +q)Rsec/a
(11)
(Parsons et al. 2011b), wheref is a constant between 0 and
1 which depends upon the location of the centre of light.
Forf= 0 the emission is spread uniformly across the entire
surface of the secondary star and therefore the centre of light
is the same as the centre of mass. Forf = 1 all of the flux
is assumed to come from the point on the secondary star’s surface closest to the white dwarf (the substellar point).
The centre of light for an emission line is related to the optical depth of the emission (Parsons et al. 2010a;
Parsons et al. 2011b). Optically thick emission tends to be preferentially radiated perpendicular to the stellar surface, therefore at the quadrature phases, we will see the limb of the irradiated region more prominently (compared to the re-gion of maximum irradiation) than we would otherwise. This will lead to a higher observed semi-amplitude and hence a smaller correction factor is needed. The reverse is true for op-tically thin lines where the emission is radiated equally in all directions, hence emission from the substellar point becomes enhanced at quadrature, leading to a low semi-amplitude and a larger correction factor. The correction factor for an optically thin line (assuming emissivity proportional to the
incident flux) is f = 0.77 and f = 0.5 for optically thick
emission (Parsons et al. 2010a).
We can estimate the optical depths of the emission lines in GK Vir using our observation of SDSS J1212-0123 and as-suming a similar behaviour in the lines. We can determine the optical depth of the lines in SDSS J1212-0123 because
in this case we have a direct measurement of Ksec.
There-fore, we can reverse Eq (11) to determine the optical depths. The left hand panel of Figure 9 shows where the emission lines lie with respect to the optically thin lower limit and the optically thick upper limit. We find that the measured
radial velocities of the Fei lines are consistent with them
being optically thin. The majority of the emission lines in SDSS J1212-0123 appear to lie somewhere between optically thick and optically thin with the exception of the hydrogen Balmer lines and the calcium H and K lines. For these lines the measured radial velocity is far higher than the optically thick limit, implying that the emission is more uniformly spread over the surface of the secondary star, this is most likely caused by stellar activity. This is consistent with the observations of several small flares during our photometry and implies that the secondary star in SDSS J1212-0123 is an active star.
From our analysis of the emission lines in SDSS
J1212-0123 we make the assumption that the Feilines in GK Vir
12
S. G. Parsons et al.
Table 7. Eclipse times for GK Vir. (1) Green et al. (1978), (2) Parsons et al. (2010b), (3) this paper.
Cycle MJD(BTDB) Reference No. (mid-eclipse)
-67 42520.26747(1) (1)
-32 42532.31905(2) (1)
-29 42533.35204(9) (1)
0 42543.33769(1) (1)
3 42544.37068(1) (1)
851 42836.36314(6) (1)
1966 43220.29202(12) (1) 2132 43277.45101(6) (1) 2896 43540.51972(12) (1) 28666 52413.9255716(9) (2) 29735 52782.0152272(9) (2) 29738 52783.0482185(7) (2) 30746 53130.1336878(27) (2) 32706 53805.0221154(23) (2) 32709 53806.0551129(12) (2) 34054 54269.1800868(3) (2) 37069 55307.3375852(11) (3)
are also optically thin. We can then use their radial velocities
to predict Ksec using Eq (11). We adopt a value for the
radial velocity amplitude of an optically thin line ofKThin=
204±2 km s−1. We use this result as a prior constraint in
our light curve fitting. The right hand panel of Figure 9 shows the radial velocity amplitudes of the emission lines in GK Vir, the dashed lines are based on the results of our light curve fitting (see section 3.2.8). The spread in the emission line radial velocities in GK Vir is relatively small compared to SDSS J1212-0123 because of the small relative size of the
secondary star (Rsec/a).
3.2.6 Eclipse times
We recorded one new high precision eclipse time for GK Vir which is listed in Table 7 along with all previous eclipse times. We update the ephemeris to
MJD(BTDB) = 42543.337 9121(33)
+ 0.344 330 832 742(99)E,
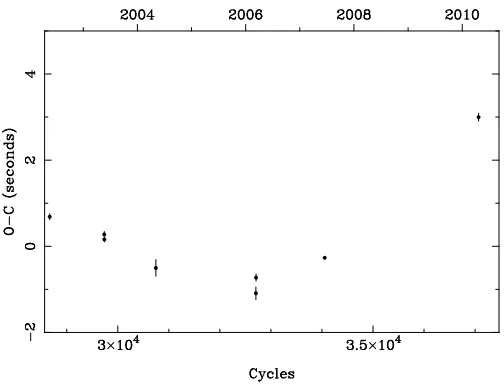
which is consistent with previous studies. Figure 10 shows the difference between the observed eclipse time and the calculated eclipse time based on our new ephemeris. Our new eclipse time shows a clear deviation from linearity, al-though the magnitude of the period change is small com-pared to other systems (see Parsons et al. 2010b). The sec-ondary star in GK Vir is able to drive this small period
change (0.00124 seconds in∼8 years) via Applegate’s
[image:13.612.87.237.109.309.2]mech-anism (Applegate 1992), although this is only just the case if we used the modified version of Applegate’s mechanism presented by Brinkworth et al. (2006) which takes account of the role of the inner part of the star in counterbalancing the outer shell. A third body in orbit around the system may also be the cause of the period change, as has recently been proposed for NN Ser (Beuermann et al. 2010), however, longer term monitoring is required in order to discover the true cause of this period change.
Figure 10.Observed-Calculated (O-C) plot for the eclipse times of GK Vir. Our new point shows a departure from linearity in the eclipse times. The secondary star is just able to supply the energy required to drive this period change via Applegate’s mechanism however, a third body in orbit around the system is also a possible explanation.
3.2.7 Spectral type of the secondary star
We detect the secondary star in GK Vir in ther′,i′ andJ
band eclipses. We measure magnitudes ofr′= 21.72±0.03,
i′ = 19.98±0.01 and J = 17.59±0.05. The r′ −i′ =
1.74±0.03 colour is consistent with a spectral type of M4.5
whilst thei′−J= 2.39±0.05 is closer to a spectral type of
M4 (Hawley et al. 2002). Using the distance from our
spec-troscopic fit (550±20pc) the secondary star has an absolute
J band magnitude of MJ = 8.9, giving it a spectral type
of M4.5 (Hawley et al. 2002), therefore we adopt a spectral
type of M4.5±0.5.
3.2.8 Modelling the light curves
The light curves of GK Vir show a deep eclipse of the white
dwarf even in theJband. GK Vir shows a small reflection
ef-fect out of eclipse, however no secondary eclipse is detected. We fit the light curves of GK Vir in the same way as those of SDSS J1212-0123 (see Section 3.1.8). However, since we
lack a direct measurement ofKsec, we use our constraint on
KThin and Eq (11) as well as our KWD and gravitational
redshift measurements to constrain the inclination.
We phase binned the data, using smaller bins on the ingress and egress, and kept the period fixed as one when fitting the light curves. We also kept the temperature of the white dwarf fixed at 55,995K. For the secondary star we used quadratic limb darkening coefficients from
Claret & Bloemen (2011) for aTeff = 3000K,logg= 5 main
sequence star. For the white dwarf we calculated quadratic limb darkening coefficients from a white dwarf model with
TWD= 55,995 and logg= 7.68 based on our spectroscopic
fits, folded through the ULTRACAMu′, g′,r′ and i′ and
SOFIJfilter profiles. For both stars we quote the coefficients
aandbwhereI(µ)/I(1) = 1−a(1−µ)−b(1−µ)2, where
µ is the cosine of the angle between the line of sight and
the surface normal, we kept all limb darkening parameters
Figure 11.ULTRACAMu′,g′,r′ andi′and SOFIJband primary eclipses of GK Vir with model fits and residuals. The light curves
[image:14.612.99.490.408.531.2]have been binned up by a factor of 5 although smaller bins were used on the ingress and egress features, which leads to the small spikes seen in the residuals at the ingress and egress.
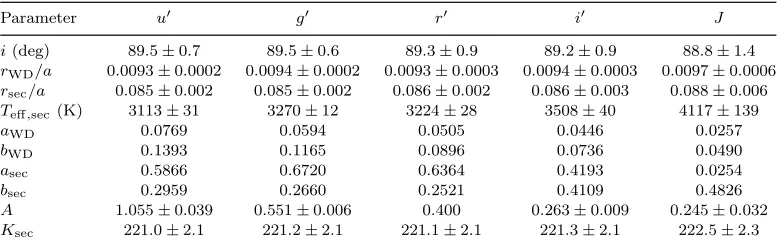
Table 8.Parameters from Markov chain Monte Carlo minimisation for GK Vir, some fitted, some fixed a priori (those without quoted uncertainties).aandbare the quadratic limb darkening coefficients.Ais the fraction of the irradiating flux from the white dwarf absorbed by the secondary star, this was kept fixed for ther′band since there is little coverage out-of-eclipse in this band.
Parameter u′ g′ r′ i′ J
i(deg) 89.5±0.7 89.5±0.6 89.3±0.9 89.2±0.9 88.8±1.4
rWD/a 0.0093±0.0002 0.0094±0.0002 0.0093±0.0003 0.0094±0.0003 0.0097±0.0006
rsec/a 0.085±0.002 0.085±0.002 0.086±0.002 0.086±0.003 0.088±0.006
Teff,sec(K) 3113±31 3270±12 3224±28 3508±40 4117±139
aWD 0.0769 0.0594 0.0505 0.0446 0.0257
bWD 0.1393 0.1165 0.0896 0.0736 0.0490
asec 0.5866 0.6720 0.6364 0.4193 0.0254
bsec 0.2959 0.2660 0.2521 0.4109 0.4826
A 1.055±0.039 0.551±0.006 0.400 0.263±0.009 0.245±0.032
Ksec 221.0±2.1 221.2±2.1 221.1±2.1 221.3±2.1 222.5±2.3
fixed. For ourr′ band light curve we lack any out of eclipse
information (barring that immediately before and after the
eclipse) hence A, the fraction of irradiating flux absorbed
by the secondary star, is unconstrained. Therefore, we fix
this value at 0.4; this parameter has no effect on the radii
or inclination.
Figure 11 shows the fits to the light curves and the residuals and our final fitted parameters are listed in Table 8. We also list the limb darkening coefficients used for each band.
4 DISCUSSION
Our light curve fits combined with Eqs (5)-(8) yield direct measurements for the masses and radii of both components in SDSS J1212-0123 and GK Vir. For our final values and uncertainties we combine the results of all our light curves,
however, since they are all constrained by the same spec-troscopic information the uncertainties in each light curve fit are not independent. Therefore we combine the results from each light curve in an optimal way by calculating the minimum possible error on each parameter purely from the spectroscopic constraints and then combining parameters al-lowing for the correlated and random noise components. Our final parameters for both systems are listed in Table 9. The secondary star’s shape in both systems is slightly distorted due to the presence of the nearby white dwarf, therefore Table 9 lists the radius of the secondary star in various di-rections. This is a very minor effect in GK Vir whilst the effect is somewhat larger for SDSS J1212-0123, though in both cases the variations are smaller than the uncertainty on the radius from the light curve fits. For our final discus-sions we adopt the volume-averaged radii.
Figure 12 shows the mass-radius plot for white dwarfs. The position of the white dwarfs in SDSS J1212-0123 and
14
S. G. Parsons et al.
Table 9.System parameters. The surface gravities quoted are from the spectroscopic fit. They are consistent with the measured masses and radii. The accretion rate is that of the material from the wind of the secondary star onto the white dwarf
Parameter SDSS J1212-0123 GK Vir
Period (days) 0.335 871 14(13) 0.344 330 832 742(99) Inclination 85.7◦±0.5◦ 89.5◦±0.6◦
Binary separation 1.815±0.003 R⊙ 1.82±0.01 R⊙
Mass ratio 0.620±0.001 0.174±0.004 WD mass 0.439±0.002 M⊙ 0.564±0.014 M⊙
Sec mass 0.273±0.002 M⊙ 0.116±0.003 M⊙ WD radius 0.0168±0.0003 R⊙ 0.0170±0.0004 R⊙ Sec radius polar 0.304±0.007 R⊙ 0.154±0.003 R⊙ Sec radius sub-stellar 0.310±0.007 R⊙ 0.156±0.003 R⊙ Sec radius backside 0.309±0.007 R⊙ 0.156±0.003 R⊙ Sec radius side 0.306±0.007 R⊙ 0.155±0.003 R⊙ Sec radius volume-averaged 0.306±0.007 R⊙ 0.155±0.003 R⊙
WD logg 7.51±0.01 7.68±0.04
WD temperature 17,707±35K 55,995±673K
KWD 104.4±0.5 km s−1 38.6±0.8 km s−1
Ksec 168.3±0.3 km s−1 221.6±2.0 km s−1
Vz,WD 16.1±0.3 km s−1 20.2±0.7 km s−1
Sec spectral type M4 M4.5±0.5
Distance 228±5 pc 550±20 pc
Accretion rate 6.4×10⁻¹⁷M
[image:15.612.42.300.135.529.2]⊙yr−1 2.2×10⁻¹⁷M⊙yr−1
Figure 12. Mass-radius plot for white dwarfs. Black points are from Provencal et al. (1998), Provencal et al. (2002) and Casewell et al. (2009). The square points are common proper-motion systems, the triangular points are visual binaries. White dwarfs measurements from PCEBs are shown in red (online version only) from (O’Brien et al. 2001), Parsons et al. (2010a), Pyrzas et al. (2011) and this work. The grey lines are CO core models with the temperatures labelled in units of 103K and
with hydrogen layer thicknesses of MH/MWD = 10−4 from
Benvenuto & Althaus (1999). The mass and radius of the white dwarf in GK Vir agree well with the 50,000K model. The blue lines (online version only) are He core models with a temperature of 18,000K and varying hydrogen layer thicknesses labelled by the exponent of the hydrogen layer fraction, from Panei et al. (2007). The mass and radius of the white dwarf in SDSS J1212-0123 is consistent with the CO core models for its temperature but we can rule out a CO core on evolutionary grounds. Therefore the white dwarf in SDSS J1212-0123 is consistent with the He core models only if it has a very thin hydrogen envelope (MH/MWD610−6).
GK Vir are shown as well as other accurate white dwarf mass-radius measurements. The measured mass and ra-dius of the white dwarf in GK Vir are consistent with a carbon-oxygen (CO) core white dwarf of the same
tem-perature, with a thick hydrogen envelope (MH/MWD =
10−4). The measured mass and radius of the white dwarf
in SDSS J1212-0123 are also consistent with a CO core white dwarf with the same temperature and a thick
hy-drogen envelope (MH/MWD = 10−4). However, although
it is possible to create CO core white dwarfs with masses
< 0.5 M⊙ via considerable mass loss along the red giant
phase (Prada Moroni & Straniero 2009; Willems & Kolb 2004; Han et al. 2000), doing so in a binary system requires a large initial mass ratio and results in a widening of the orbital separation, hence we would not expect a CO core
white dwarf with a mass <0.5 M⊙ in a close binary
sys-tem. Therefore the white dwarf in SDSS J1212-0123 must have a He core, as noted by Shen et al. (2009).
Several He core mass-radius relations are shown in
Fig-ure 12 for a white dwarf with a temperatFig-ure of 18,000K
and varying hydrogen layer thicknesses. The white dwarf in SDSS J1212-0123 is consistent with these relations only if
it has a very thin hydrogen envelope (MH/MWD 6 10−6).
Figure 13 shows a zoomed in version of the mass radius plot for the white dwarf in SDSS J1212-0123 as well as the same He core models as Figure 12. The black line shows the range of possible masses and radii that the white dwarf in SDSS J1212-0123 could have based on the radial veloci-ties and the primary eclipse shape (i.e. no inclination con-straints). The numbers plotted along this line are what the measured gravitational redshift of the white dwarf would need to be in order to give that mass and radius. Previ-ous studies have found that the spectroscopic gravitational redshift measurements are usually slightly inconsistent with mass-radius measurements via other methods (Pyrzas et al. 2011; Parsons et al. 2010a; Maxted et al. 2007) meaning that our inclination constraints may be slightly incorrect.
[image:15.612.44.297.340.531.2]Figure 13.Mass-radius plot for the white dwarf in SDSS J1212-0123. The blue lines (online version only) are He core models with a temperature of 18,000K and varying hydrogen layer thick-nesses labelled by the exponent of the hydrogen layer fraction, from Panei et al. (2007). The black line shows the possible mass and radius range without any constraint on the inclination with 90◦ at the top. The numbers along this line correspond to the
gravitational redshift that the white dwarf would have at that in-clination (in km s−1). Our measured redshift (16.1±0.3 km s−1)
means that the white dwarf is consistent with models which have a thin hydrogen layer. However, even without any inclination con-straints it is not possible for the white dwarf to have a thick (MH/MWD>2×10−4) hydrogen layer.
However, Figure 13 shows that it is not possible for the
white dwarf to have a thick hydrogen envelope (MH/MWD>
2×10⁻⁴) even if the inclination is 90◦. Current
evolution-ary models are unable to create He core white dwarfs with such thin hydrogen envelopes, the thinnest envelopes are
of the order of MH/MWD ∼3×10⁻⁴ (Althaus et al. 2009;
Sarna et al. 2000; Driebe et al. 1998) meaning that,
assum-ing our measured Vz value is accurate, either SDSS
J1212-0123 has had a very unusual evolutionary history or that current evolutionary models of He core white dwarfs are in-complete and overestimate their size. Additional He core white dwarf mass-radius measurements should show if this is the case.
Figure 14 show the mass-radius plot for low mass stars. The masses and radii of the secondary stars in SDSS J1212-0123 and GK Vir are marked as well as other precise mea-surements. The mass and radius of the secondary star in SDSS J1212-0123 show that it is over-inflated for its mass
compared with evolutionary models by∼12 per cent. This
discrepancy can be reduced to ∼ 9 per cent if the
[image:16.612.47.546.69.255.2]sec-ondary star is active. In this case the radius may be overes-timated due to the effects of polar spots, it also increases to compensate for loss of radiative efficiency due to starspots and due to a strong magnetic field caused by rapid rota-tion (Morales et al. 2010; Chabrier et al. 2007). We have ev-idence from the emission lines and light curves that the sec-ondary star in SDSS J1212-0123 is indeed active, therefore
Figure 14. Mass-radius plot for low-mass stars. Black points are high-precision measurements taken from Knigge et al. (2011), Carter et al. (2011) and Ofir et al. (2011). The solid line is the 4.0-Gyr isochrone from Baraffe et al. (1998) whilst the dashed line is a 4.0-Gyr model from Morales et al. (2010) which includes the effects of magnetic activity. Low-mass stars from PCEBs are shown in red (online version only) from Parsons et al. (2010a), Pyrzas et al. (2011) and this work. The blue points (online ver-sion only) show the radii of these stars after correcting for irra-diation (negligible for SDSS J1210+3347 and SDSS J1212-0123). The secondary star in GK Vir is consistent with model predic-tions after correcting for irradiation, however the secondary star in SDSS J1212-0123 is still oversized.
these effects can explain some of the discrepancy however, the star remains oversized. The secondary star in GK Vir is
also oversized by∼9 per cent, this drops to ∼6 per cent
if it is active, though we have no evidence of activity from this star.
Taking the effects of rotational and tidal perturbations fully into account only causes an increase in the radii of 0.1 per cent for GK Vir and 0.4 per cent for SDSS J1212-0123 (Sirotkin & Kim 2009) which is not enough to explain the discrepancy.
Irradiation by the white dwarf can cause the sec-ondary star to become inflated by effectively blocking the energy outflow through the surface layers (Ritter et al. 2000). For NN Ser correcting this effect brought the mass and radius measurements into agreement with evolution-ary models (Parsons et al. 2010a). For the secondevolution-ary star in GK Vir we find that irradiation increases its radius by 5.6% (Ritter et al. 2000; Hameury & Ritter 1997), enough to bring it into agreement with evolutionary models. How-ever, for the far less irradiated secondary star in SDSS J1212-0123 we find an increase of only 0.4% meaning that it is still overinflated. The corrected radii are shown in Figure 14
5 CONCLUSIONS
We have used a combination of ULTRACAM and SOFI photometry and X-shooter spectroscopy to measure pre-cise masses and radii for both components of the eclips-ing PCEBs SDSS J1212-0123 and GK Vir. In both cases we use measurements of the gravitational redshift of the white