Int. J. Electrochem. Sci., 9 (2014) 2934 - 2943
International Journal of
ELECTROCHEMICAL
SCIENCE
www.electrochemsci.orgAnalysis and Modeling of Electro Discharge Machining Input
Parameters of Nitinol Shape Memory Alloy by De-ionized
Water and Copper Tools
Esmail Abedi1,*, Saeed Daneshmand1, Ali Akbar Lotfi Neyestanak2, Vahid Monfared3
1
Department of Mechanical Engineering, Majlesi Branch, Islamic Azad University, Isfahan, Iran 2
Department of Mechanical Engineering, Shahre Rey Branch,, Islamic Azad University, Tehran, Iran 3
Department of Mechanical Engineering, Zanjan Branch, Islamic Azad University, Zanjan, Iran *
E-mail: [email protected]
Received: 31 December 2013 / Accepted: 7 February 2014 / Published: 23 March 2014
Nowadays, NiTi alloy is one of the shape memory alloys that its applications have grown in all industries. Its unique properties compared with some mechanical and thermo dynamical parameters lead in being applicable in industries such as aerospace, medicine and automobile. In the present study, EDM was modeled on NiTi alloy be means of de-ionized water and copper tools. EDM technique has different input parameters which influence on the outputs. Machining duration and process instability increase by experimental setting of input parameters. A mathematical modeling is required to make a precise relation between input and output parameters. The experiments were chosen by Design of Experiments (DOE)’s technique. Material removal rate and surface roughness were modeled with machining parameters and regression equations. The results were studied by variance analysis (AVOVA) and the most precise model was chosen as final model. Suggested model helps to find the parameters which have the most effects on material removal rate and surface roughness of NiTi alloy using de-ionized water and copper tools. Thus, material removal rate and surface roughness can be predicted.
Keywords: Electro discharge machining; Shape memory alloys; Modeling; Material removal rate; Tool wear rate; Surface roughness; Nitinol; Cu electrode
1. INTRODUCTION
[image:2.596.154.448.403.568.2]
strength temperature resistant alloys [1]. EDM can be used to machine difficult geometries in small batches or even on job-shop basis. Work material to be machined by EDM has to be electrically conductive. In EDM, a potential difference is applied between the tool and workpiece. Both the tool and the work material are to be conductors of electricity [2]. The tool and the work material are immersed in a dielectric medium. Generally kerosene or deionised water is used as the dielectric medium. A gap is maintained between the tool and the workpiece. Depending upon the applied potential difference and the gap between the tool and workpiece, an electric field would be established [3]. EDM machines can be also know as vertical, ram, solid or die sinking machines. These types of machines have an electrode mounted in mainly in the Z axis. They are used to remove broken taps, spark cavities into components, produce complex internal spines and gears etc. The electrode and workpiece are connected to a suitable power supply. The power supply generates an electrical potential between the two parts. As the electrode approaches the workpiece, dielectric breakdown occurs in the fluid forming an ionization channel, and a small spark jumps [4]. The resulting heat and cavitation vaporize the base material, and to some extent, the electrode. These sparks strike one at a time in huge numbers at seemingly random locations between the electrode and the workpiece. As the base metal is eroded, and the spark gap subsequently increased, the electrode is lowered automatically by the machine so that the process can continue uninterrupted. Several hundred thousand sparks occur per second in this process, with the actual duty cycle being carefully controlled by the setup parameters.
Figure 1. Schematic diagram of EDM [5]
[image:3.596.172.417.152.297.2]
temperature and stress dependent shift in the material’s crystalline structure between two different phases, martensite (low temperature phase) and austenite (high temperature phase). The temperature, where the phase transformation occurs, is called the transformation temperature. Figure 2 is a simplified representation of material’s crystalline arrangement during different phases.
Figure 2. The Shape Memory Effect Process [7]
Niranjan applied MLP networks to monitor tool corrosion [12, 13]. Li and Tarng used adaptive resonance theory based neural networks to study tool fracture [14, 15]. The present research focuses on introducing a mathematical model to make a relation between EDM’s input and output parameters. An appropriate model for NiTi machining will be available by identifying and controlling the parameters that influence on surface roughness and material removal rate.
2. EQUIPMENTS AND METHODOLOGY
NiTi60 shape memory alloy was chosen for machining due to its capability and application. This alloy was cut and ground by wire cut machine in dimensions of mm3. A copper tool electrode of mm2 was prepared. Spark machine model M204H manufactured by Tehran Ekram Engineering Co. was applied to do the tests. De-ionized water was utilized as the dielectric considering NiTi’s intelligence. AND GR-300 laboratory balance with 0.0001 resolutions was used to measure the material removal volume and tool corrosion. Mahr M300-RD18 roughness measurement device was applied to measure the surface roughness of the work piece. The mechanical and physical properties of NiTi60 alloy and copper electrode are given in tables 1 and 2 [16, 17]. Design of experiments was used to do the tests. L9 orthogonal array with voltage repetition level of 30 and 200 was applied to design the experiment. In the present research the numbers of experiments and factors are 9 and 4, respectively.
Table 1. Mechanical and physical properties of NiTi60 [17]
6.45 G/cc Density
754 - 960 Mpa Tensile strength, ultimate
560 Mpa Tensile strength, yield
15.5 % Elongation at break
75.0 Gpa Modulus of elasticity
28.8 Gpa Shear modulus
10.0 W/m-k Thermal conductivity
1240 - 1310 °C Melting point
60.0 % Nickel, Ni
40.0 % Titanium, Ti
Table 2. Physical properties of copper electrode [16]
Copper Physical properties
380.7 Thermal conductivity [W/m·K]
1083 Melting point [°C]
2595 Boiling temperature [°C]
0.092 Specific heat [cal/g·°C]
8.9 Specific gravity at 20°C [g/cm3
]
17 Coefficient of thermal expansion [×10-6
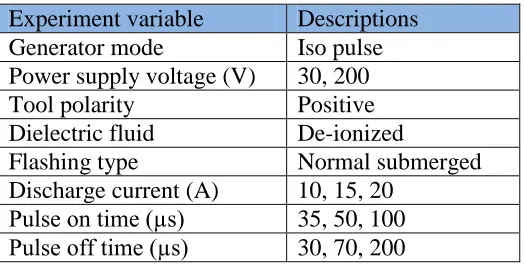
Input parameters are voltage, current, pulse on time and pulse off time. Output parameters include material removal rate, tool corrosion and surface roughness. Specifications and input parameters applied in the experiment are presented in table 3. Input parameter of the experiments shown in table 4.
Table 3. Process parameters and their levels
Descriptions Experiment variable
Iso pulse Generator mode
30, 200 Power supply voltage (V)
Positive Tool polarity
De-ionized Dielectric fluid
Normal submerged Flashing type
10, 15, 20 Discharge current (A)
35, 50, 100 Pulse on time (µs)
30, 70, 200 Pulse off time (µs)
Equations 1 and 2 were applied to calculate material removal rate and relative tool erosion [18].
(1)
100 (2)
ρT and ρw : Density of tool and workpiece t: Machining duration
MRR: Material removal rate TWR: Tool wear rate
Mw1 and Mw2: work piece weight before and after machining MT1 and MT2: tool weight before and after machining
[image:5.596.169.431.192.324.2]L9 orthogonal Taguchi array leads in 9 tests was chosen considering degrees of freedom of the system. Input parameter of the experiment is shown in table 3. Material removal rate and surface roughness values are given in table 5 for 9 tests according to different control levels.
Table 4. Levels for various control factors
Pulse off time Current
Pulse on time Voltage
Control factors
30 10
25 80
Level 1
70 15
10 250
Level 2
100 20
100 80
Table 5. L9 Orthogonal array
Material removal rate (MRR) Surface Roughness (Ra) Pulse off time Discharge current Pulse on time Voltage Sl. No 0.74935 3.22800 1 1 1 1 1 1.11111 2.64767 1 2 2 2 2 3.38501 4.98133 1 3 3 3 3 1.52455 3.00967 2 1 2 3 4 4.78036 5.53500 2 2 3 1 5 2.48062 3.80967 2 3 1 2 6 2.63566 2.37800 3 1 3 2 7 0.54264 2.95900 3 2 1 3 8 2.29974 3.67300 3 3 2 1 9
3. MATERIAL REMOVAL RATE MODELING
[image:6.596.55.544.467.554.2]Regression functions, experimental data, determination of main factors and noticeable effects on material removal rate were used to model material removal rate of NiTi alloy by copper electrode and de-ionized water. Variance analysis of material removal rate for NiTi is given in table 6. The effects of spark current intensity, pulse on time and pulse off time are respectively main and critical effects of the process to achieve 95% confidence level with P < 0.050.
Table 6. Analysis of variance for material removal rate
P-value F-ratio Mean square (MS) Sum of squares (SS) Degrees of freedom (DF) Source 0.261 1.49 2.60 2.6 1 Voltage 0.683 0.41 0.88 1.77 2 On Time 0.047 5.29 4.731 9.462 2 Current 0.815 0.21 0.49 0.98 2 Off Time
MRR = 2.56028 + 0.00628578 V + 0.0718098 Ton - 0.670435 I - 0.0236168 Tof - 3.43647E-4 Ton2 +
0.0313523 I2 + 8.32827E-5 Tof2 - 5.81395E-4 Ton I (3)
[image:6.596.111.488.613.731.2]
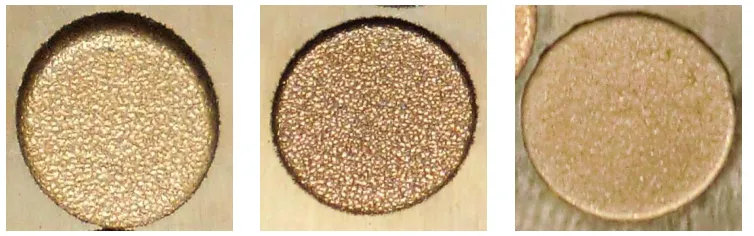
Equation 3 indicates material removal rate model for NiTi shape memory alloy with copper electrode according to input parameters of electro discharge machining. This model makes a proper relationship between input parameters of electro discharge machining and material removal rate. According to this equation, there is no need for different tests to gain material removal rate. EDM machined samples are illustrated in figure 3.
[image:7.596.100.494.262.424.2]Relative error of equation 3 compared with scientific results is given in table 7. According to the results shown in this table, maximum and average errors are 17.951E-4 and %5.0006867 respectively which can be ignored because of their small amounts.
Table 7. Scrutiny regression equation calculation error (Equation 3) with experimental result
Experimental number
MRR
experimental result
MRR regression equation
Error %
1 0.74935 0.749360 8.007E-4
2 1.11111 1.11112 8.342E-4
3 3.38501 3.38503 5.164E-4
4 1.52455 1.52456 7.049E-4
5 4.78036 4.78037 2.337E-4
6 2.48062 2.48063 3.658E-4
7 2.63566 2.63567 4.416E-4
8 0.54264 0.542645 17.951E-4
9 2.29974 2.29975 4.882E-4
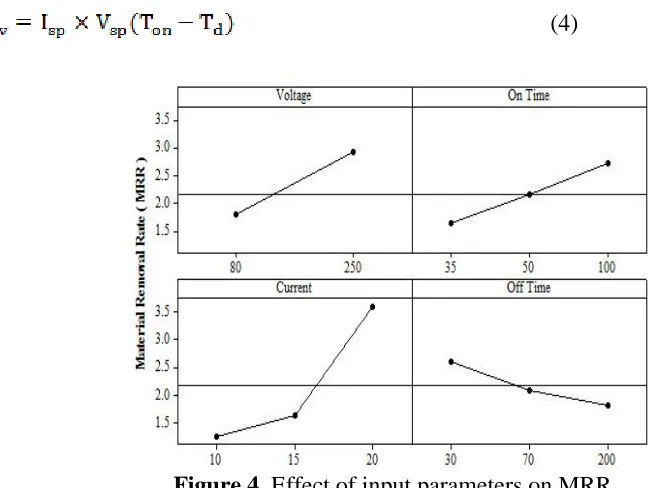
The effects of voltage, pulse on time and pulse off time on material removal rate are illustrated in figure 4. According to equation 4, increase in pulse on time and particularly in pulse current causes increase in spark energy and higher material removal rate [18].
(4)
[image:7.596.102.427.515.759.2]
4. SURFACE ROUGHNESS MODELING
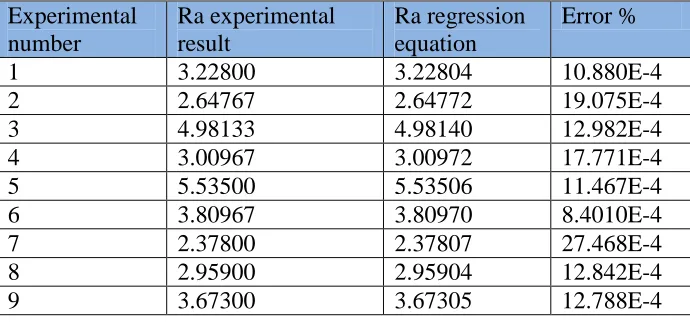
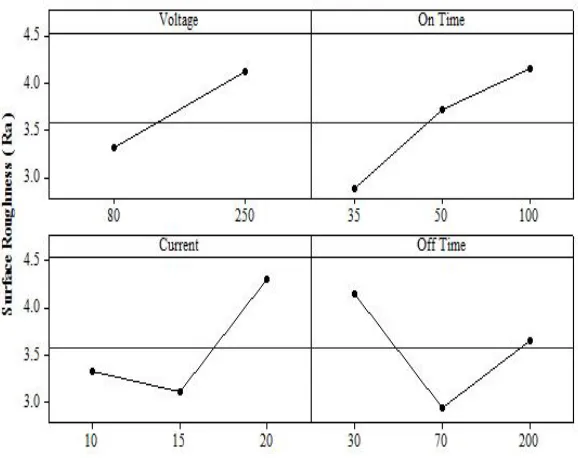
Analysis of second order variance for surface roughness with 95% confidence level and P < 0.050 is given in table 8. Considering the results obtained from NiTi machining by copper electrode and de-ionized water pulse on time is considered the most important parameter and pulse off time, current intensity and voltage are respectively the main and critical effects of the process. Equation 5 is surface roughness model for machining NiTi60 with copper tool in which Ra, I, Ton and Toff are surface roughness, current intensity pulse on time and pulse off time respectively. Comparison between experimental results and the error caused by equation 5 is given in table 9. According to this table, the maximum and average errors of the model are %27.468E-4 and %0.0014853 respectively which are ignorable due to their small amounts. Therefore, equation 5 presents suitable results for surface roughness of shape memory alloy with copper electrode and de-ionized water. The effects of EDM’s input parameters on surface roughness are illustrated in figure 5. By increasing in pulse current spark energy will be increased which leads in deeper melting hole and subsequently rise in surface roughness.
Ra = 8.26994 + 0.00814195 V + 0.0487479 Ton - 1.03422 I - 0.0223952 Tof - 7.27966E-04 Ton2 +
[image:8.596.56.544.418.506.2]0.0282022 I2 + 7.78133E-05 Tof2 + 0.00461750 Ton I (5)
Table 8. Analysis of variance for surface roughness
P-value F-ratio
Mean square (MS)
Sum of squares (SS) Degrees of
freedom (DF) Source of
variation
0.312 1.18
1.30 1.30
1 Voltage
0.368 1.19
1.27 2.55
2 On Time
0.395 1.09
1.20 2.39
2 Current
0.434 0.96
1.09 2.18
[image:8.596.126.471.563.724.2]2 Off Time
Table 9. Calculation error of regression equation (equation 5) and experimental result
Experimental number
Ra experimental result
Ra regression equation
Error %
1 3.22800 3.22804 10.880E-4
2 2.64767 2.64772 19.075E-4
3 4.98133 4.98140 12.982E-4
4 3.00967 3.00972 17.771E-4
5 5.53500 5.53506 11.467E-4
6 3.80967 3.80970 8.4010E-4
7 2.37800 2.37807 27.468E-4
8 2.95900 2.95904 12.842E-4
Figure 5. Effect of input parameters on surface roughness
5. CONCLUSION
In this study, a mathematical model based on practical experiments was introduced to evaluate material removal rate and surface roughness of NiTi60 shape memory alloy by means of copper electrode and de-ionized water. This mathematical model was achieved with Analysis of variance for 95% confidence level. Moreover, a meaningful relationship between EDM’s input parameters including voltage, current pulse on time and pulse off time and output parameters including material removal rate and surface roughness was available by use of this model. The model showed that some of these parameters have less effect on material removal rate. Increase in current intensity has the most significant effect on surface roughness. Generally, the effect of each EDM’s input parameter on output parameters can be studied using two suggested model for material removal rate and surface roughness. Furthermore, it’s possible to achieve the desired surface roughness and material removal rate in addition to reduction in the number of experiments by changing the parameters in the suggested mathematical model.
References
1. V. Kumar, N. Beri, A. Kumar, Journal of Advanced Engineering Technology. 1 (2010) 16.
2. D. Bhaduri, A. S. Kuar, S. Sarkar, S. K. Biswas, S. Mitra, Journal of Materials and Manufacturing Processes. 24 (2009) 1312.
3. S. Daneshmand, E. Farahmand Kahrizi, E. Abedi, M. Mir Abdolhosseini, International Journal of Electrochemical Science. 8 (2013) 3095.
4. S. Saedodin, M. Torabi, H. Eskandar, Journal of Advanced Design and Manufacturing Technology. 3 (2010) 17.
6. A. A. Lotfi, S. Daneshmand, Journal of Advances in Materials Science and Engineering. 2013 (2013) 6.
7. D.E. Hodgson, Using Shape Memory Alloys, Shape memory Applications, Inc., 1988 8. S. Daneshmand, E. Farahmand Kahrizi, A. A. Lotfi Neyestanak, M. Mortazavi Ghahi,
International Journal of Electrochemical Science. 8 (2013) 7484.
9. H. Wu. Ming, and L. McD. Schetky, Proceedings of the Conference on Shape Memory and Superelastic Technologies, Pacific Grove, California, P.171-182 (2000).
10. J. Y. Kao, C. C. Tsao, S. S. Wang, C. Y. Hsu, Journal of Advanced Manufacturing Technology. 47 (2010) 395.
11. G. Indurkhya, K.P. Rajurkar, Proceedings of Artificial Neural Networks in Engineering Conference, St. Louis, Missouri, U.S.A., 15-18 November. (1992) 845.
12. K. Niranjan Prasad, B. Ramamoorthy, Journal of Materials Processing Technology. 112 (2001) 43. 13. A. Z. Tomkiewicz, Journal of Materials Processing Technology. 109 (2001) 300.
14. X. Q. Li, Y. S. Wong and A. Y. C. Nee, Journal of Manufacturing Science Engineering. 120 (1998) 433.
15. Y.S. Tarng, T.C. Li, M.C. Chen, Journal of Machine Tools and Manufacture. 34 (1994) 949. 16. U. Fischer, M. Heinzle, F. Näher, H. Paetzold, R. Kilgus, R. Gomeringer, Oesterle, A.S. Stephan,
Tabellenbuch Metall. Verlag Europa-Lehrmittel, Nourney, VollmerGmbH and Co. KG. (2008). 17. http://www.Matweb.com.
18. A. A. Lotfi, S. Daneshmand, S. Adib Nazari, Journal of Advanced Design and Manufacturing Technology. 2 (2009) 51.
![Figure 1. Schematic diagram of EDM [5]](https://thumb-us.123doks.com/thumbv2/123dok_us/1897689.147683/2.596.154.448.403.568/figure-schematic-diagram-edm.webp)
![Figure 2. The Shape Memory Effect Process [7]](https://thumb-us.123doks.com/thumbv2/123dok_us/1897689.147683/3.596.172.417.152.297/figure-shape-memory-effect-process.webp)