Int. J. Electrochem. Sci., 11 (2016) 5180 – 5196, doi: 10.20964/2016.06.27
International Journal of
ELECTROCHEMICAL
SCIENCE
www.electrochemsci.org
Failure Analysis of Oil Tubes Containing Corrosion Defects
Based on Finite Element Method
Xiaoben Liu1,*, Hong Zhang1,2,*, Meng Li1, Qinquan Duan1,Yanfei Chen1
1
College of Mechanical and Transportation Engineering, China University of Petroleum, Beijing, 102249, China
2
China University of Petroleum(Beijing) Karamay Campus, Karamay, 834000, China
*
E-mail: [email protected]; [email protected]
Received: 31 October 2015 / Accepted: 30 March 2016 / Published: 4 May 2016
Oil tubes containing corrosion defects are vulnerable under complicated service load. In the oil field, corrosion of oil tubes is mainly electrochemical corrosion. In this study, failure analysis of the oil tube with two typical electrochemical corrosion defects, the grooving defect and the ellipsoidal pit, was conducted by finite element method. The complicated service load conditions were considered, and the effects of the defect dimensions on the strength of the tube were discussed in detail. Results show that, with the increase of the depth of the defect position in the tube for both defect types, the peak Mises stress decreases first and then increases. If the defect is in the shallow position of the tube, it is the axial tension that leads to the tensile fracture. But if the defect is in the deep position of the tube, it is the internal pressure that leads to the rupture. The depth of the defect has great influence on the tube strength, while the width and length of the defect have small influence on the tube strength, especially when the defect is in the shallow position of the tube. This study can be referenced for the failure analysis and strength evaluation of oil tubes with corrosion defects.
Keywords: N80 oil tube, electrochemical corrosion defects, complicated service load, finite element method, failure analysis
1. INTRODUCTION
water as solvent, which is also highly mineralized solution with various ions, so the corrosion of oil tubes is mainly electrochemical corrosion with high rate. At the anode area, iron is resolved into iron ion, then into electrolyte. Then the corrosion cell is formed, and REDOX reaction is performed. Lots of investigation have been conducted for electrochemical corrosion behavior of tubing steels in recent years. Li [1] studied the joint effect of temperature, stress states and sulfur ions on the electrochemical corrosion behavior of N80 tubing steel. Xue [2] employed potentiodynamic polarization measurement and electrochemical impendence spectroscopy to investigate the corrosion behavior of CT80 coiled tubing steel in artificial high salinity brine corresponding to the oil well water at Changqing oil field. The same methods were also adopted by Ren [3] to study the effects of temperature of electrochemical corrosion behavior of the CT80 steel. Liu [4] studied the effect of solution pH value and H2S partial pressure on the
electrochemical corrosion of P110 tubing steel in solutions containing dissolved H2S/CO2 in an
autoclave.
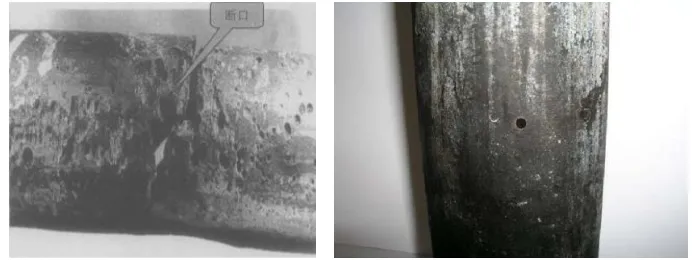
When electrochemical corrosion occurs in the oil tube, induced corrosion defects will reduce the strength of the tube seriously. Large concentrated stress will be induced in the corrosion areas, when corroded oil tubes are subjected to combined working loads, leading to rupture failure as shown in Fig. 1. Hence the failure analysis on the oil tube containing corrosion defects under complicated working loads is of practical value for ensuring the safety of oil tubes.
[image:2.596.124.471.386.516.2]
a) Tube fracture induced by corrosion b) Corrosion perforation in the tube Figure 1. Oil tubes containing corrosion defects
narrow and long corrosion defects under combined load. Xia [11] derived the influence of the corrosion defect dimensions on the oil tube by parametric analysis using finite element models. Shi [12] conducted numerical and experimental study on the effects of the corrosion defect volume on the resistance of the tube to internal pressure. And similar numerical analysis studies were also conducted on corroded pipelines. Fu [13] studied the failure pressure of internally corroded line pipe by finite element method. Batte [14] proposed a method for determining the residual strength of corroded pipelines. Based on damage theory, Choi [15] developed a limit pressure prediction model for corroded X65 steel. Zhu [16] first considered the influence of the hardening behavior of the pipe steel on the pipe limit pressure. Cronin [17] investigated the failure pressure of low strength corroded pipeline numerically and experimentally. Chen [18] predicted the failure pressure for pipeline with two corrosion defects using nonlinear finite element analysis. Ma [19] proposed a regression formula for high strength pipeline limit pressure, and Chen [20] improved this work by studying the effects of the multi corrosion defects on the failure analysis of high strength pipelines. Zhang [21] investigated the failure pressures of corrosion pipeline with signal and multi point ellipsoidal corrosion defects, considering effects of various factors.
Although their contributions made are significant, less attention is paid on the effects of the complicated load conditions on the strength and failure modes of corroded oil tubes in service, which is very important in the engineering practice. To fill this gap, failure analysis of oil tubes with corrosion defects under different combined service loads was conducted systematically in this study. The common defect types were considered, including the ellipsoidal pit and grooving defect. The influence of the loading conditions and defect dimensions on the tube strength was discussed in detail, and the failure mode of the tube was also investigated for all conditions. This study can be referenced for the safety evaluation of oil tubes with corrosion defects.
2. BASIC THEORY ANALYSIS
[image:3.596.213.376.557.722.2]2.1. Stress analysis of the oil tube under working conditions
The working condition of the oil tube is complicated. Normally, it is under axial tension due to gravity and other loads, along with hoop tension due to internal presure. And in some special cases, such as the case where the tubing is in a curved well, it can also be under bending, which makes the stress state more complicated. In this study, the aixal stress and the interal pressure were considered in detial, while the bending stress was ingored. Fig. 2 illustrates the stress state of the oil tube in working conidtions. The axial stress and internal pressure vary with the depth of position in the oil tube.
2.2. Axial Stress
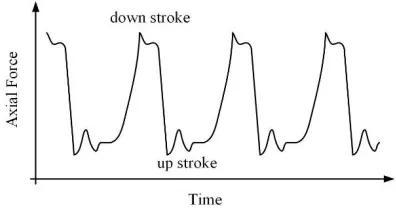
The axial force F in the oil tube is complicated. It comprises the gravity force of the tube F1, the buoyancy of the liquid in the well F2, the liquid force F3, the friction force between the piston and bushing F4, the friction force between the pumping rod and the oil tube F5 and so on [8]. Fig. 3 plots the load spectrum of the axial force in the oil tube [22]. It can be shown that the axial force peaks in the down stroke, and at this moment the axial force can be calculated as follows:
1 2 3 4 5
F F F F F F (1)
And the axial stress axial can be easily obtained as: /
axial F A
(2)
[image:4.596.200.398.416.521.2]Where, A is the section area of the oil tube, mm . 2
Figure 3. Load spectrum of the axial force in the oil tube
2.3. Internal Pressure
The internal pressure can be derived by the following formula:
0 0
P gh (3)
Where, 0 is the density of the oil in the tube, kg/m3. g is the acceleration of gravity, m/s2. h is the depth of the position in the oil tube, m.0 is the oil pressure in the well head, MPa.
2.4. Failure criteria of the oil tube
with corrosion defects is local plastic failure. According to ISO/TR 10400:2007 [23], it can be considered that the failure occurs in the tube, when peak Von Mises stress in the corrosion area e reaches the flow stress f, which can be calculated by the following equations.
/ 2f s b
(4)
Where, s is the yield strength, MPa. b is the tensile strength, MPa.
2
2
21 2 1 3 2 3
1 2
e
(5)
Where, 1 , 2, 3 are the three principal stresses, MPa.
3. NUMERICAL MODELING
3.1. Basic assumptions
a) The oil tube is assumed to be with no initial defect. b) The tube steel is elastic-plastic and isotopic.
c) Fracture failure occurs in the tube, when the equivalent stress reaches the flow stress.
3.2. Material properties
The N80 steel widely used in the oil field in China was selected in this study. The multi linear isotropic hardening model was used to simulate the steel material in the nunerical model. The stress-strain curve of the N80 steel is shown in Fig. 4. The elastic modulus E is 207GPa, the yield strength
s
is 550MPa, the tensile strength b is 690MPa, the flow stress f is 620 MPa, and the Poisson
[image:5.596.191.383.528.673.2]ratio is 0.3 [24].
3.3. Finite element model
[image:6.596.201.391.213.315.2]The corrosion defect in the tube can be defined by three parameters, the depth of the defect d, mm, the length of the defect L, mm, the width of the defect W, mm, as shown in Fig. 5. As the corrosion defect is small compared with the whole tube, when establishing the finite element model, only a small part is needed to be considered. Therefore, the axial stress in the model can be considered as a constant. According to the Saint-Venant's Principle, in order to avoid the influence of the boundary conditions, the axial length of the oil tube is set to be four times of the tube’s diameter.
Figure 5. The defect parameters schemes of the oil tube
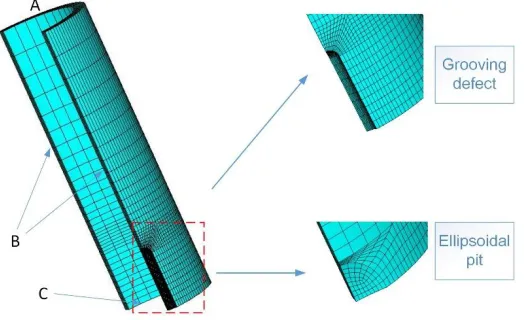
Based on the symmetry of the load condition and the geometric model, only 1/4 of the oil tube part was built in the finite element modeling. Two typical corrosion defect types were consiedered in this study, the grooving defect and the ellipsoidal pit, as shown in Fig. 6. The general finite elment software ANSYS was adopted in this study to conduct the finite elment analysis [25]. The 8-node hexahedral element SOLID186 was used to simulate the oil tube. A fine mesh was employed for the defect area, where the maximum stress and strain are expected, while a coaser mesh was chosen for the other parts. As the wall of oil tube is generally thick, it was discretized into 4 equal sized 8-node hexahedral elements in the radial direction, which makes the result more accurate. Fig.6 depicts the meshed model. In this figure, the meshing details of the two kinds of defects were given respectively.
[image:6.596.176.438.553.713.2]
As shown in Fig.6, the left side of the tube (plane B in Fig. 6) and the downside of the tube (plane C in Fig. 6) are the symmetrical planes in the quarter model, where the symmetric boundary conditions were applied. To simulate the effect of the axial load, tensile axial stress was applied to the top side of the tube (plane A in Fig. 6). And the internal pressure was applied to the inside surface of the tube to simulate the effect of the liquid pressure on the tube.
4. RESULTS AND DISCUSSION
4.1. Load conditions
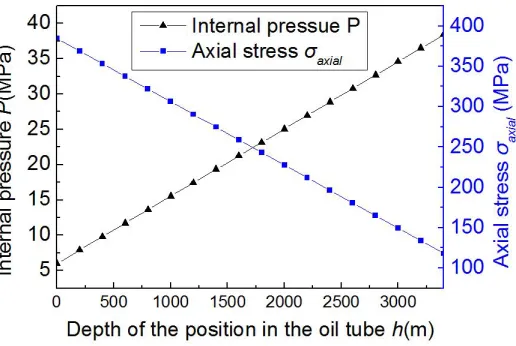
In this study, parameters of a 4000-meter-deep oil well were selected for the analysis. The size of the N80 steel oil tube is as follows, the diameter D=88.9mm, and the wall thickness t=7.34mm. The other parameters of the oil well are listed in Table 1.
[image:7.596.182.416.406.516.2]Based on the values above and Eqs. 1-3, the distribution of the axial stress and the internal pressure in the tube can be obtained, as shown in Fig. 7. It is obvious that, with the increase of the depth h, the internal pressure increases linearly, while the axial stress decreases linearly.
Table 1. Basic parameters for the oil well
Item Value
Pump depth (m) 4000
Liquid level depth (m) 3500 oil density (kg/m3) 973 fluid viscosity (Pa.s) 0.025 Wellhead pressure (MPa) 6
[image:7.596.179.437.563.736.2]
4.2. Effects of the load conditions
The corrosion defects at various depth position in the tube was discussed here to study the failure mode of the tube under different load conditions. Two sizes of the corrosion defect were considered here. The size of the grooving defect is d=4mm, W=18mm, L=60mm. The size of the ellipsoidal pit is d=4mm, W=18mm, L=26mm.
Fig. 8 illustrates the change law of the peak Von Mises stress in the corrosion area e with the depth of the defect in the tube h. It can be obtained that for both kinds of defect, with the increase of h,
e
decreases first and then increases. When the depth of the defect position in the tube h is less than 1600m, the peak Von Mises stress e of the ellipsoidal pit is larger than that of the grooving defect. When h is larger than 1600m, e of the ellipsoidal pit is smaller than that of the grooving defect. So it can be derived that, with the same other dimensions of the defect, the tube containing the ellipsoidal pit is more vulnerable when the defect is in the shallow position of the tube, while the tube containing the grooving defect is more vulnerable when the defect is in the deep position of the tube.
[image:8.596.169.407.511.689.2]If the peak Von Mises stress in the corrosion area e reaches the flow stress f of the N80 steel, the failure will occur in the tube. Point A and B refer to the failure positions of the ellipsoidal pit and the grooving defect, respectively. For the cases considered here, the failure will appear in the ellipsoidal pit when h<600m. In this case, the large Mises stress mainly induced by the axial stress in the tube is concentrated in the center line of the pit in the axial direction of the tube, as shown in the left stress contour in Fig.8, which may lead to tensile fracture failure. The failure will appear in the grooving defect when h>2200m. In this case, the large Mises stress mainly induced by the internal pressure is concentrated in the center line of the defect in the circumferential direction leading to rupture failure, as shown in the right stress contour in Fig.8, which is a typical failure mode of corroded pipelines.
The Von Mises stress contours of both defects at various depth positions are listed in Fig. 9 in detail. Fig. 9(a) shows that, when h is small, the peak stress of the grooving defect concentrates at the top end of the defect. And with the increase of h, the stress concentration position moves to the center line of the defect in circumferential direction. Fig. 9(b) shows that, when h is small, the peak stress of the ellipsoidal pit concentrates in the center area of the pit in the axial direction. And with the increase of h, the concentration position moves to the center point of the pit.
a) h=600m b) h=1400m c) h=2200m d) h=3000m
a) The grooving defect
h=600m h=1400m h=2200m h=3000m
[image:9.596.74.501.195.407.2]b) The ellipsoidal pit
Figure 9. The Von Mises stress contours of the corrosion defect with various depth positions
4.3. Effects of the defect dimensions 4.3.1. Effect of the depth of the defect
The ratio of the depth of the defect to the tube wall thickness d/t was used here to study the effect of the depth of the defect on the tube strength. As derived above, the oil tube has various failure modes with different depths of the defect in the tube. Two typical load conditions were considered here for both corrosion types to study the influence of the depth of the defect on the tube strength.
Under condition I, the depth of the defect in the tube h=400m, which means the axial stress is 353.1 MPa, and the internal pressure is 9.8 MPa. Under condition II, the depth of the defect in the tube h=3000m, which means the axial stress is 196.3 MPa, and the internal pressure is 28.9 MPa. The length of the grooving defect is 60mm, and the length of the ellipsoidal pit is 26mm.
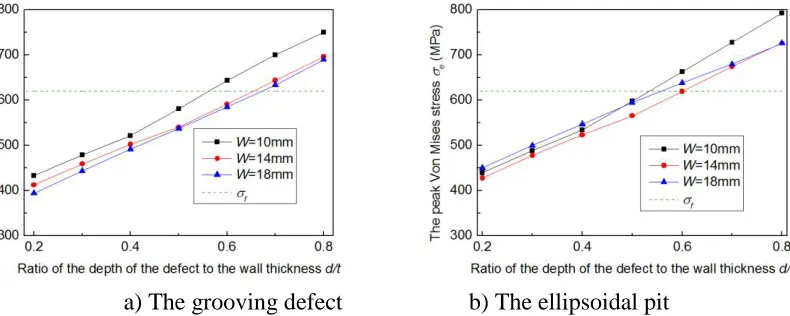
Fig. 10 illustrates the trends of the peak Von Mises stress e with d/t under condition I, for the grooving defect and ellipsoidal pit, respectively. It can be shown that the depth of the defect has great influence on the tube strength, e increases almost linearly with the increase of d/t for both defect
types. And e varies in a small range for different widths of the defect. For the grooving defect, if the
[image:10.596.306.491.79.243.2]
a) The grooving defect b) The ellipsoidal pit
Figure 10. The trends of the peak Von Mises stress with the depth of the corrosion defect under load condition I
Fig.11 shows the Mises stress contours in the corrosion areas with W=14mm for a series of defect depths under load condition I. For the grooving defect, the Mises stress concentrates at the top area of the defect, and with the increase of the depth of the defect, the stress concentration becomes more severe. For the ellipsoidal pit, when d/t=0.2, the Mises stress in the whole corrosion area is large, but with the increase of d/t, the peak Mises stress concentrates at the top end of the pit in axial direction.
d/t=0.2 d/t=0.4 d/t=0.6 d/t=0.8
a) The grooving defect
d/t=0.2 d/t=0.4 d/t=0.6 d/t=0.8
b) The ellipsoidal pit
Figure 11. The Von Mises stress contours of the corrosion area with various d/t under load condition I
The stress behavior of the tube under load condition II differs from that under load condition I. Fig. 12 illustrates the trends of e with d/t under condition II. e increases with the increase of d/t for
both defect types, and e increases faster with a larger d/t, especially for the grooving defect. e also
[image:10.596.100.495.84.242.2] [image:10.596.74.502.414.625.2]
agreement with the results derived from corroded pipelines [19]. For the grooving defect, the failure occurs when d/t is larger than 0.45. And for the ellipsoidal pit, the failure occurs when d/t is larger than 0.6.
[image:11.596.308.495.148.304.2]a) The grooving defect b) The ellipsoidal pit
Figure 12. The trends of the peak Von Mises stress with the depth of the corrosion defect under load condition II
Fig.13 shows the Mises stress contours in the corrosion areas with W=14mm for a series of defect depth under load condition II. It is obvious that the stress distribution for both defects are different with the one under condition I, as shown in Fig. 11. For both the grooving defect and the ellipsoidal pit, when d/t=0.2, the Mises stress in the whole center area is large. With increase of d/t, the Mises stress concentrates on the center line in the circumferential direction gradually.
d/t=0.2 d/t=0.4 d/t=0.6 d/t=0.8
a) The grooving defect
d/t=0.2 d/t=0.4 d/t=0.6 d/t=0.8
b) The ellipsoidal pit
[image:11.596.148.486.149.308.2] [image:11.596.78.499.473.681.2]
4.3.2. Effects of the width of the defect
The influence of the width of the defect on the tube strength was investigated in detail. Six widths i.e. 10mm, 12mm, 14mm, 16mm, 18mm, 20mm, were taken into consideration for both types of defect.
[image:12.596.224.483.161.320.2]a) The grooving defect b) The ellipsoidal pit
Figure 14. The trends of the peak Von Mises stress with the width of the corrosion defect under load condition I
Fig. 14 illustrates the trends of the peak Von Mises stress e with the defect width W under condition I, for the grooving defect and ellipsoidal pit, respectively. It is obvious that, W has little influence on e for both defect types. e will only change about 40MPa, when W changes from10mm
to 20mm. Compared with the influence induced by the depth of the defect, the one induced by the width of the defect is quite small.
W=12mm W=14mm W=16mm W=18mm
a) The grooving defect
W=12mm W=14mm W=16mm W=18mm
a) The ellipsoidal pit
[image:12.596.100.387.161.319.2] [image:12.596.85.501.488.700.2]
Fig.15 shows the Mises stress contours in the corrosion areas with d/t=0.6 for a series of defect depth under load condition I. For the grooving defect, the Mises stress concentrates at the top end of the defect, and with the decrease of the width of the defect, the stress concentration becomes more severe. For the ellipsoidal pit, if the width of the defect W=18mm, the Mises stress in the whole corrosion area is large. And with the decrease of W, the Mises stress concentrates at the top of the pit.
a) The grooving defect b) The ellipsoidal pit
Figure 16. The trends of the peak Von Mises stress with the width of the corrosion defect under load condition II
[image:13.596.78.501.542.736.2]Fig. 16 illustrates the trends of the peak Von Mises stress e with the defect width W under condition II. In this condition, e decreases with the increase of W for all the cases. When e<f, the value of e varies in a small range with the change of W.
Fig. 17 shows the Mises stress contours in the corrosion areas with d/t=0.6 for a series of defect depths under load condition II. For the grooving defect, the Mises stress concentrates on the center line of the defect in the circumferential direction. No obvious change occurs when W varies. For the ellipsoidal pit, the Mises stress concentrates on the center line of the pit in the circumferential direction when W=12mm. And with the increase of W, the Mises stress concentrates at the center point of the pit gradually.
W=12mm W=14mm W=16mm W=18mm
a) The grooving defect
W=12mm W=14mm W=16mm W=18mm
a) The ellipsoidal pit
4.3.3. Effects of the length of the defect
Fig. 18 illustrates the relationship between the peak Von Mises stress e and the length of the defect L, with different depths of the defect under load condition I. The width of the defect W=16mm was selected for all cases in this section. Both defect types were considered by changing L in a large range. The defect is ellipsoidal pit if L<35mm, and is grooving defect if L>35mm. It can be obtained that, under load condition I, L has negligible influence on the tube strength, e only decreases in a very small range when L increases from 26mm to 30mm, and e is almost the same when L is larger than 40mm.
The Mises stress contours in the corrosion areas with d/t=0.6 for a series of the defect lengths under load condition I are shown in Fig. 19. It can be derived that, the length has no influence on the Mises stress distribution of the defect, the peak Mises stress concentrates at the end of the defect in the axial direction in all cases.
Figure 18. The trends of the peak Von Mises stress with the length of the corrosion defect under load condition I
[image:14.596.177.405.322.492.2]L=26mm L=30mm L=50mm L=80mm
Figure 19. The Von Mises stress contours of the corrosion area with various L under load condition I
[image:14.596.105.499.553.654.2]
agreement with the results derived from corroded pipelines [19]. If d/t=0.6, e increases obviously with the increase of L. Under this circumstance, e is larger than t, if L is larger than 30mm.
[image:15.596.173.405.140.310.2]Figure 20. The trends of the peak Von Mises stress with the length of the corrosion defect under load condition II
Fig.21 shows the Mises stress contours in the corrosion areas with d/t=0.6 for a series of defect depths under load condition II. The Mises stress concentrates on the center line of the defect in the circumferential direction. With the increase of the length, the concentration area becomes larger.
L=26mm L=30mm L=50mm L=80mm
Figure 21. The Von Mises stress contours of the corrosion area with various L under load condition II
5. CONCLUSIONS
In this paper, a finite element model for failure analysis of N80 oil tube with corrosion defects was established by general finite element software ANSYS. The complicated working load conditions of the oil tube were taken into consideration. The influences of the defect dimensions on the tube strength and the failure mode of the tube were discussed in detail. Conclusions can be drawn as follows:
(1) With the increase of the depth position of the defect in the tube, the peak Mises stress decreases first and then increases for both defect types.
[image:15.596.102.500.429.527.2]
tension. The tube containing ellipsoidal pit will fracture in axial direction in the center of the pit, and the tube containing grooving defect will fracture in the axial direction at the end of defect. If the defect is in the deep position of the tube, the tube will rupture in the center line of the defect in the circumferential direction for both types of defects due to the internal pressure.
(3) The depth of the defect has great influence on the tube strength in all conditions. With the increase of the depth of the defect, the peak Mises stress increases in a large range, and the stress concentration becomes more severe.
(4) If the defect is in the shallow position of the tube, the width and length of the defect have negligible influence on the tube strength. If the defect is in the deep position of the tube, the peak Mises stress decreases a little with the increase of the width of the defect, and increases a little with the increase of the length of the defect. But for all cases, the stress concentration becomes severe with the decrease of the width of the defect.
ACKNOWLEDGEMENTS
The financial supports provided by China National Science Foundation under Grant No. 51309236 is gratefully acknowledged. And we are grateful to Mr Kui Xu for his suggestion during this research.
References
1. J. B. Li, X. Hou, M.S Zheng, J. W. Zhu, International Journal of Electrochemical Science, 2 (2007) 607 – 617.
2. Y. N. Xue, S. J. Luo, M. Liu, R.Wang, Corrosion Science and Protection Technology, 25(2013) 24-29.
3. G. Q. Ren, Y. Shen, R. Wang, J. Wei, Corrosion and Protection, 36(2015) 245-250.
4. R. K. Liu, G. J. Yin, C. Y. Wei, Corrosion Science and Protection Technology, 25(2013) 451-455. 5. ASME B31G, America Society of Mechanic Engineering, USA (2009).
6. API-579-1/ASME FFS-1, American Petroleum Institute, USA (2009). 7. DNV-RP-F101, Det Norske Veritas, Norway (2004).
8. S.Z. Zhou, D. He and Z.P. Lu, Oil Field Equipment, 35 (2006) 19-22.
9. Y. Zhang, X. Peng and T. Huang, Journal of Shenyang University of Technology, 36 (2014) 526-531.
10. X.W. Hu, C.F. Zhou and M.L. Duan, Petroleum Science, 11 (2014) 139-146.
11. M. Y. Xia, Q. Q. Duan, X. B. Liu, H. Zhang, Materials Science Forum, 850(2016) 950-956. 12. J. Q. Shi, L. Jia, L. Deng, J. L. Hu, L. Wang, Oil Field Equipment, 45(2016) 10-16.
13. B. Fu, M.G. Kirkwood, Proceedings of the International Conference on Offshore Mechanics and Arctic Engineering, Copenhagen, Denmark, (1995) 165-184.
14. A.D. Batte, B. Fu and M.G. Kirkwood, Proceedings of International Conference on Offshore Mechanics and Arctic Engineering, Yokohama, Japan, (1997) 221-228.
15. J. B. Choi, B. K. Goo and J. C. Kim, International Journal of Pressure Vessels and Piping, 80 (2003) 121-128.
16. X.K. Zhu, B.N. Lei, International Journal of Pressure Vessels and Piping, 89 (2012) 85-97. 17. D.S. Cronin, Assessment of corrosion damage in pipeline, Department of Mechanic Engineering,
University of Waterloo, Canada (2000).
20. Y.F. Chen, X. Li and J. Zhou, Journal of Ship Mechanics, 13 (2009) 748-756.
21. J. Zhang, Z. Liang and C.J. Han, International Journal of Electrochemical Science, 10 (2015) 5036-5047.
22. M. X. Cui, F. J. He and M. Luo, Acta Petrolei Sinica, 01 (2003) 108-112.
23. ISO 10400, TR-2007. The International Organization for Standardization (2007). 24. API Specification 5CT, American Petroleum Institute, USA (2005).
25. ANSYS Release 12.1 Documentation, Ansys Inc, USA (2009).