This is a repository copy of
Analysis of the uncertainty in the monetary valuation of
ecosystem services - a case study at the river basin scale
.
White Rose Research Online URL for this paper:
http://eprints.whiterose.ac.uk/92877/
Version: Accepted Version
Article:
Boithias, L, Terrado, M, Corominas, L et al. (5 more authors) (2016) Analysis of the
uncertainty in the monetary valuation of ecosystem services - a case study at the river
basin scale. Science of the Total Environment, 543 (Part A). 683 - 690. ISSN 0048-9697
https://doi.org/10.1016/j.scitotenv.2015.11.066
© 2015, Elsevier. Licensed under the Creative Commons
Attribution-NonCommercial-NoDerivatives 4.0 International
http://creativecommons.org/licenses/by-nc-nd/4.0/
[email protected] https://eprints.whiterose.ac.uk/
Reuse
Unless indicated otherwise, fulltext items are protected by copyright with all rights reserved. The copyright exception in section 29 of the Copyright, Designs and Patents Act 1988 allows the making of a single copy solely for the purpose of non-commercial research or private study within the limits of fair dealing. The publisher or other rights-holder may allow further reproduction and re-use of this version - refer to the White Rose Research Online record for this item. Where records identify the publisher as the copyright holder, users can verify any specific terms of use on the publisher’s website.
Takedown
If you consider content in White Rose Research Online to be in breach of UK law, please notify us by
1
Analysis of the uncertainty in the monetary valuation of
1
ecosystem services a case study at the river basin scale
2
Author names: Laurie Boithias1,2,3, Marta Terrado1, Lluís Corominas1, Guy Ziv4, Vikas Kumar5, Montse
3
Marqués5, Marta Schuhmacher5, Vicenç Acuña1*
4
Author affiliations: 5
1 Catalan Institute for Water Research, Carrer Emili Grahit 101, 17003 Girona, Spain.
6
2 University of Toulouse; INPT, UPS; Laboratoire Ecologie Fonctionnelle et Environnement (EcoLab), Avenue de
7
A C T losan Cedex, France.
8
3 CNRS, EcoLab, 31326 Castanet Tolosan Cedex, France.
9
4 School of Geography, University of Leeds, Leeds LS2 9JT, United Kingdom.
10
5 E A M G D E Q U R Virgili, Av. Països
11
Catalans 26, 43007 Tarragona, Spain.
12
Corresponding author (*): 13
Vicenç Acuña, Catalan Institute for Water Research (ICRA), Carrer Emili Grahit 101, 17003 Girona. 14
Tel +34972183380, Fax +34972183248, [email protected]
15
2
Abstract
17
Ecosystem services provide multiple benefits to human wellbeing and are increasingly considered by 18
policy-makers in environmental management. However, the uncertainty related with the monetary 19
valuation of these benefits is not yet adequately defined or integrated by policy-makers. Given this 20
background, our aim was to quantify different sources of uncertainty when performing monetary 21
valuation of ecosystem services, in order to provide a series of guidelines to reduce them. With an 22
example of 4 ecosystem services (i.e., water provisioning, waste treatment, erosion protection, and 23
habitat for species) provided at the river basin scale, we quantified the uncertainty associated with 24
the following sources: (1) the number of services considered, (2) the number of benefits considered 25
for each service, (3) the valuation metrics (i.e. valuation methods) used to value benefits, and (4) the 26
uncertainty of the parameters included in the valuation metrics. Results indicate that the highest 27
uncertainty was caused by the number of services considered, as well as by the number of benefits 28
considered for each service, whereas the parametric uncertainty was similar to the one related to the 29
selection of valuation metric, thus suggesting that the parametric uncertainty, which is the only 30
uncertainty type commonly considered, was less critical than the structural uncertainty, which is in 31
turn mainly dependent on the decision-making context. Given the uncertainty associated to the 32
valuation structure, special attention should be given to the selection of services, benefits and 33
metrics according to a given context. 34
Keywords: ecosystem management, freshwater ecosystems, ecosystem services, sensitivity analysis, 35
3
1. Introduction
37
Ecosystem services are the benefits we obtain from ecosystems, such as waste treatment by river 38
ecosystems. These services are generated by ecosystem functions, and provide multiple benefits to 39
human wellbeing (e.g. reduced water treatment costs, more opportunities for recreation due to a 40
higher water quality), which in turn can be valued in either monetary or non-monetary units (de 41
Groot et al. 2010). Specifically, the valuation of ecosystem services involves the quantification of the 42
value of multiple benefits using the appropriate market and non-market valuation techniques, so that 43
a value is assigned to each one of the benefits. Because of the lack of homogeneity in the non-44
monetary units, the values cannot be easily aggregated or compared. Thus, expressing the value of an 45
ecosystem in monetary units appears to be useful, since this metric is meaningful to stakeholders 46
(Costanza et al. 1997; Naidoo and Ricketts 2006; Jordan et al. 2010). Furthermore, the lack of 47
monetary valuations has been identified as one of the underlying causes for the observed 48
degradation of ecosystems and the loss of biodiversity (TEEB 2010). 49
Monetary valuations of the benefits associated with a given management action are often compared 50
with the management action costs, thus performing cost-benefit analyses. In this context, small 51
differences in the value of the quantified benefits might influence the decision on whether or not to 52
perform a conservation management action (BenDor et al. 2011). Therefore, it is crucial to precisely 53
quantify benefits of ecosystem services, and to assess and minimize uncertainty to avoid bias or even 54
fault in decision making (Chavas 2000; National Research Council 2005; Naeem et al. 2015). The 55
assessment of uncertainty in monetary valuations of ecosystem services is therefore crucial, but not a 56
straightforward issue according to the literature (Turner et al. 2004; Carpenter et al. 2006; Nicholson 57
et al. 2009; Johnson et al. 2012). According to these studies, there is a need to improve identification, 58
quantification and communication of uncertainties in the monetary valuation of ecosystem services. 59
The uncertainty in ecosystem services monetary values rises from the uncertainty in the 60
4 quantification of the monetary values (TEEB 2010). Because of these two large sources of 62
uncertainty, the monetary values might contain outstanding degrees of uncertainty (Scolozzi et al. 63
2012). However, the uncertainty in ecosystem services valuation is commonly ignored, or only partly 64
considered (Seppelt et al. 2011). Seppelt et al. (2011) reviewed 153 ecosystem service studies from 65
current scientific publications, and found that 45 % of them did not provide sufficient information 66
regarding uncertainty in their results. Among those assessing uncertainty, most of them focused 67
exclusively on the uncertainty in the quantification of ecosystem services in biophysical units 68
(Johnson et al. 2012; Sánchez-Canales et al. 2012, 2015; Hou et al. 2013), despite the fact that socio-69
economic parameters used in the valuation process have been identified in some studies to be more 70
relevant when quantifying the monetary values than biophysical parameters (Acuña et al. 2013). 71
Furthermore, no clear guidelines exist on which aspects to consider when assessing uncertainty in the 72
monetary valuation of ecosystem services (TEEB 2010; Johnson et al. 2012; Hou et al. 2013). Some 73
attempts have been made to define guidelines, and a recent study even assembled a template to 74
identify where uncertainty might be greatest and suggested conducting sensitivity analyses to 75
explore the effects of uncertainty on valuation estimates all along the pathway from action to change 76
in the value of ecosystem services related to water quality (Keeler et al. 2012). Overall, there are two 77
types of uncertainty in the monetary valuation of ecosystem services: the structural uncertainty and 78
the parametric uncertainty. 79
Structural uncertainty arises from the structure of the valuation process (i.e., selection of services, 80
benefits, and valuation metrics), whereas the parametric uncertainty arises from the uncertainty in 81
the parameters used in each one of the valuation metrics (i.e. valuation methods). In regards to the 82
structural uncertainty, the decisions on the number of services and benefits to consider, as well as on 83
which valuation metric to use are commonly, but not always, driven by the study goal and are 84
therefore dependent on the decision-making context. Regardless of the rationale behind the 85
selection of services and benefits, several authors pointed out the complexity of aggregating all the 86
5 through different benefits with a certain overlap (Arrow et al. 2000; de Groot et al. 2002; Wallace 88
2007; Mendelsohn and Olmstead 2009; Spangenberg and Settele 2010; Hou et al. 2013). Thus, the 89
careful selection of ecosystem services and benefits is crucial if aiming to capture the different values 90
an ecosystem can provide. 91
However, studies on ecosystem services commonly focus on too few ecosystem services, or on too 92
few benefits per service (Acuña et al. 2013; Honey-Rosés et al. 2013). For instance, among coupled 93
biophysical and economic models, the valuation section in the InVEST model is restricted to one or 94
two benefit(s) per service (Tallis et al. 2011), thereby neglecting part of the monetary value of a given 95
service, restricting the applicability of the model to certain contexts, and introducing uncertainty in 96
the valuation. For example, the model on the ecosystem service water provisioning only considers 97
the value of water provisioning for reservoir hydropower production (Terrado et al. 2014). Another 98
component of the structural uncertainty relates to the choice of the valuation metric for a given 99
benefit, as multiple valuation metrics could be applied. The choice of valuation metric has been 100
reported to be relevant for the valuation, as different valuation metrics might be based on the same 101
set of economic assumptions but approach the ecosystem services from different perspectives, with 102
results varying widely depending on the choice of valuation metric rather than on the object under 103
analysis (Spangenberg and Settele 2010; Hou et al. 2013). For example, the application of two 104
alternative valuation metrics to the same object of measurement (willingness to pay and willingness 105
to accept) might result in different values (TEEB 2010). Similarly, previous studies showed that 106
different valuation metrics result in different rankings of nature-conservation value (Rouquette et al. 107
2009). Overall, structural uncertainty consists of decisions partly related with the context of the 108
study, partly with data availability, and partly on practitioners subjective decisions, all of them 109
involving that the quantification of the monetary value of ecosystem services does not deliver a 110
6 Parametric uncertainty relates to the uncertainty in the parameters included in the valuation metrics 112
such as the market prices of agricultural products, which are subjected to wide swings in value due to 113
shifts in preferences or environmental conditions (Johnson et al. 2012). Another key parameter 114
subject to high uncertainty is the discount rate, which is used to weigh the sequence of costs and 115
benefits over time (TEEB 2010) and often leads to diverging long term valuation results (Ludwig et al. 116
2005; Carpenter et al. 2006). It is because of the uncertainty in these key parameters that parametric 117
uncertainty has also been appointed to be critical for the valuation of ecosystem services (Woodward 118
and Wui 2001; Spangenberg and Settele 2010; Keeler et al. 2012). Actually, most of the studies to 119
date that have considered uncertainty in ecosystem services valuation focused exclusively on the 120
parametric uncertainty, therefore neglecting the structural uncertainty related to the selection of 121
services, benefits, and valuation metrics. 122
Given this background, our aim is to identify and quantify the different sources of uncertainty when 123
performing the monetary valuation of ecosystem services, in order to provide a series of guidelines or 124
potential strategies to reduce uncertainty. The considered sources of uncertainty were: (1) the 125
number of services considered, (2) the number of benefits considered for each service, (3) the 126
valuation metrics used to value benefits, and (4) the uncertainty in the parameters of the valuation 127
metrics. In order to assess the relevance of these sources of structural and parametric uncertainty, 128
we have used data from 4 ecosystem services stemming from previous modeling works in the 129
Llobregat River basin (Sánchez-Canales et al. 2012, 2015; Bangash et al. 2013; Terrado et al. 2014, 130
2015). The 4 ecosystem services were: water provisioning (WP), waste treatment (WT), erosion 131
protection (EP), and provision of habitat for species (HS)). 132
7
2. Material and methods
134
135
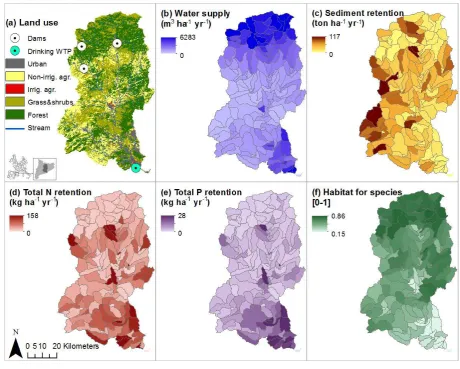
Fig. 1. Llobregat River basin: location and distribution of (a) the 5 land use classes; (b) the water 136
provisioning ecosystem service; (c) the sediments retention ecosystem service; (d) the nitrogen 137
retention ecosystem service; (e) the phosphorous retention ecosystem service; and (f) the habitat for 138
species ecosystem service. 139
2.1. Description of the study site
140
The Llobregat River basin (NE Iberian Peninsula) covers an area of 4950 km2 (Fig. 1). It is one of the
141
main water sources for Barcelona and its metropolitan area, which have a total population of more 142
than 3 million people. Annual rainfall varies substantially within the basin from > 1000 mm in the 143
mountains to < 600 mm near the coast, with strong seasonal fluctuations in both rainfall and 144
[image:8.595.65.526.110.479.2]8 treatment plants are located near the outlet (Fig. 1). The Llobregat River basin is an example of a 146
highly populated, severely exploited and highly impacted area in the Mediterranean region. The basin 147
has been long studied for several aspects, including the assessment of ecosystem services in a climate 148
change context (Sánchez-Canales et al. 2012; Bangash et al. 2013; Terrado et al. 2014): hydrological 149
ecosystem services in basins such as the Llobregat were shown to be very sensitive to extreme 150
climate conditions. For instance by 2100, climate change is expected to decrease water provisioning 151
service between 3 and 49 % and decrease erosion protection service between 5 and 43 % in this 152
particular basin. 153
2.2. Ecosystem services assessment
154
Biophysical values of WP, WT, EP and HS ecosystem services are given in Fig. 1. The WP, WT, and EP 155
biophysical values were calculated with the InVEST model (Tallis et al. 2011), which is a spatially 156
explicit model consisting of a suite of models that use patterns of land use and land cover to estimate 157
levels and economic values of ecosystem services (Nelson et al. 2009). The WP service is the amount 158
of water drained in an area, as the difference between water from rainfall and evapotranspiration 159
across the basin. The WT service is the amount of total nitrogen and total phosphorus removed from 160
water across the basin.The EP service is the amount of sediments retained depending on soil erosion 161
rates across the basin. Full details for WP, WT and EP biophysical values assessment are found in 162
published literature (Sánchez-Canales et al. 2012, 2015; Bangash et al. 2013; Terrado et al. 2014). HS 163
biophysical values were calculated as a function of the maximum suitability for each type of land use 164
and land cover to provide habitat for biodiversity and different anthropogenic threats likely impairing 165
habitat quality (Terrado et al. 2015). 166
For each one of these services assessed from a biophysical point of view, we considered a series of 167
benefits, and for each one of those a series of valuation metrics in order to estimate the monetary 168
value from each benefit (Table 1). The methods on the monetary valuation methods are extensively 169
9 for the monetary valuation of the 4 ecosystem services) and Table A2 (list of the equations used for 171
the monetary valuation of the 4 ecosystem services). All values were calculated as Net Present Values 172
(NPV) at the annual scale (2013), thus expressed in 2013 based on the Spanish inflation rate and 173
using the consumer price index. The uncertainty ranges for each parameter included in the valuation 174
metrics are reported in Table A1, and were based on literature data when possible. Otherwise, ranges 175
were based on knowledge and expressed as a percentage from the parameter value, or 176
considering an estimate error integrating the possible measurement errors, or the possible spatial 177
and temporal variability, or the variability in possible measurement techniques. 178
2.3. Structural uncertainty
179
The structural uncertainty arises from the structure of the valuation process, that is, from the 180
selection of the services to be quantified, the selection of the benefits considered for each service, 181
and the selection of the valuation metric used for each benefit. Thus, to assess the structural 182
uncertainty, we quantified the total monetary value of the considered ecosystems by as many 183
combinations as possible of service - benefit - valuation metric (Table 1). Specifically, the uncertainty 184
related to the number of considered services was assessed calculating a total monetary value using 185
all possible combinations of 1, 2, or 3 services. Thus, using the combinations of 1 (n = 4), 2 (n = 6), and 186
3 (n = 4) services, we calculated a total monetary mean and coefficients of variation. Similarly, the 187
uncertainty related to the number of considered benefits per service was assessed calculating a total 188
monetary value with 1, 2, or 3 benefits for each one of the 4 considered ecosystem services. This 189
allowed the calculation of 3 total monetary value means and respective coefficients of variation 190
based on 30 combinations for 1 benefit per service, 30 combinations for 2 benefits per service, and 191
10 combinations for 3 benefits per service. Finally, the uncertainty related to the choice of the 192
valuation metric was assessed calculating a total monetary value with as many different valuation 193
metrics as possible for each one of the considered benefits, namely 128 combinations of metrics, and 194
10
2.4. Parametric uncertainty
196
The effects of the uncertainty of the parameters used in the valuation metrics on the total monetary 197
value was assessed by running Monte Carlo simulations (a total of 3000 simulations were sufficient to 198
obtain stable estimates of the coefficients). The space of parameter ranges was explored by random 199
sampling from the Probability Density Functions (uniform distributions) of the parameters with upper 200
and lower bounds defined according to literature and expert knowledge in a few cases. The 201
uncertainty ranges (Table S2) reflected the potential variation of the parameters along the studied 202
year (e.g. CO2 market price) or the spatial variability within the catchment, region or country (e.g.
203
price of drinking water). For parameters estimated from complex calculations reported without an 204
uncertainty range (e.g. treatment cost per unit of nitrogen) we assumed a 40 % uncertainty. For land-205
cover related parameters a 5 % error was assumed. Thus, a Monte Carlo run (of 3000 simulations) 206
was performed for each of the 128 possible model structure combinations, and the median and 207
coefficient of variation of the obtained total monetary values of the 128 runs were used to quantify 208
the parametric uncertainty. 209
A sensitivity analysis was conducted to evaluate the influence of the parameters of the valuation 210
metrics on the total monetary value. We used the 3000 simulation runs to fit a multivariate linear 211
model relating the total monetary value (Y) to the parameters of the model (Xi) (equation 1). The
212
standardized regression coefficients i2 are obtained by normalizing the slopes bi (equation 2) (Saltelli
213
et al. 2005) after running Monte Carlo Simulations (Corominas and Neumann 2014): 214
(1)
(2)
The standardized regression coefficients i are a valid measure of sensitivity if the coefficient of
215
determination R2 is higher than 0.7 (Saltelli et al. 2004). The
i2 approximates the first-order variance
216
contribution of the operational variable Xi to the Y. The analysis was repeated for each one of the 128
11 combinations of valuation metrics and the median of the i2 was calculated for each parameter (the
218
median of each parameter was calculated only for the i2 values of the model structures in which the
219
parameter was involved). We quantified the i2 and classified parameters with i2> 0.05. Additionally,
220
a statistical hypothesis test was performed for each regression coefficient bi T “ t-test is
221
intended to reject the null hypothesis H0 that the coefficient bi is not statistically different from zero;
222
if the null hypothesis H0: bi = 0 is not rejected, then bi could be excluded from the regression model
223
(Montgomery 2009), and hence the associated model parameter could be excluded from the 224
12
3. Results
226
3.1. Monetary valuation of ecosystem services in the Llobregat River basin
227
Estimates of the monetary values of ecosystem services in the Llobregat River basin are given in Table 228
A3. The values of the benefits related to WP range from 0.6 to 279 M -1. Within WP, the benefit
229
W 6 M -1 depending on the valuation
230
metric. The values of the benefits related to WT range from 3 to 182 M -1. Within WT, the benefit
231
H is valued between 3 to 69 M -1. The values of the
232
benefits related to EP range from 0 M -1. T A
233
M -1 regardless of which valuation metric is used. The same is observed for the benefit
234
E , which is about M -1 regardless of the
235
used valuation metric. The values of the benefit related to HS range from 0.001 M -1
236
depending on the valuation metric, and the willingness to pay (WTP) for the existence and 237
conservation of genetic and species diversity (351 M -1) is much higher than actual public
238
investments (15 M -1).
13 240
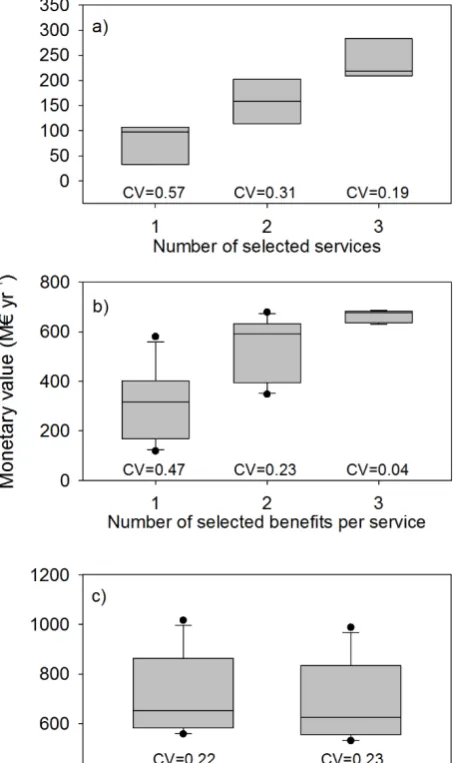
Fig. 2. Box-plots of the uncertainty of the economic value of the case-study basin given (a) the effect 241
of the number of services selected; (b) the effect of the number of benefits selected per service; and 242
(c) the effect of the choice of the valuation metric and of the value of the parameters included in 243
each valuation metric. A coefficient of variation (CV) is given for each box-plot. 244
3.2. Structural uncertainty
245
The effects of the selection of services, benefits, and valuation metrics are shown in Fig. 2. Regarding 246
14 services. The average value for 1 service is 79 M yr-1 (CV = 0.57), the average value for 2 services is
248
158 M -1 (CV = 0.31), and the average value for 3 services is 237 M yr-1 (CV = 0.19). Thus, the more
249
services included in the monetary valuation, the higher the total monetary value and the lower the 250
coefficient of variation. 251
Regarding the selection of benefits, Fig. 2b shows the possible total monetary value range depending 252
on the number of benefits considered for each service (here between 1 and 3 benefits) (Fig. 1). The 253
average value for 1 benefit is 316 M -1 (CV = 0.47), the average value for 2 benefits is 541 M -1
254
(CV = 0.23), and the average value of 3 benefits is 662 M -1 (CV = 0.04). As for the selection of
255
services, the more benefits per service included in the monetary valuation, the higher the average 256
monetary value and the lower the coefficient of variation. The number of benefits included in the 257
valuation of each service varies from one service to another (e.g., from 1 for HS to 5 for EP), mainly 258
because of the availability of data to calculate the related benefits according to at least one valuation 259
technique. It highlights that for each service, the greater the number of services and benefits per 260
service that are considered when quantifying the monetary value, the higher the monetary value and 261
the lower the uncertainty. 262
Regarding the choice of valuation metric, Fig. 2c shows the monetary value range depending on 128 263
combinations of valuation metrics (see also Fig. 1 and Table S4). The mean total monetary value 264
considering the 128 combinations is 714 M -1 (CV = 0.22). The number of valuation metrics that
265
could be applied to each benefit was constrained by both data availability and valuation metrics in 266
C H and
267
E 4 different valuation
268
metrics, whereas other benefits could be valued with only 1 or 2 valuation metric(s). 269
3.3. Parametric uncertainty
270
Fig. 2c shows the uncertainty range of monetary values depending on the uncertainty of the 271
15 considering the parameter uncertainty is 687 M -1 (CV = 0.23), almost the same as when
273
comparing to the valuation metric selection. Actually, the interquartile range (Q3-Q1) is reduced 274
when combining structural and parametric uncertainties. 275
276
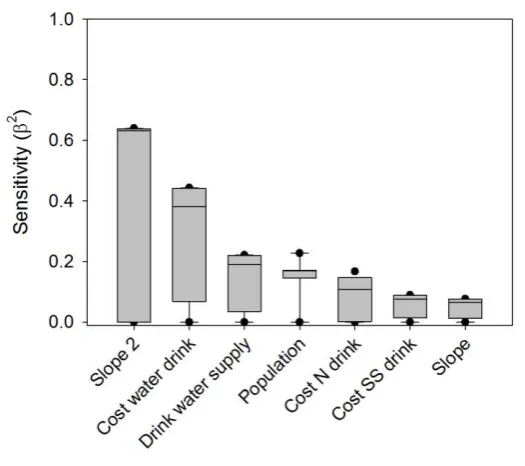
Fig. 3 “ 2 2 > 0.05) used to calculate the total
277
monetary value with the 128 combinations of valuation metrics. 278
For the 128 possible combinations of valuation metrics, the R2 of the multivariate linear model
279
between the total monetary value and the parameters of each model was higher than 0.99, thus the 280
128 multivariate linear models were valid. Hence, the variability of each parameter depends on the 281
parameter variation range within the sensitivity analysis and on the occurrence of the valuation 282
metric within the combination tested. According to the median of the i2 calculated for each
283
parameter, the 7 most sensitive parameters (with i2> 0.05) were, in order of most to least sensitive
284
(Fig. 3): (1) the slope of the willingness to pay-species richness relationship (Slope_2) from the benefit 285
HS1.1; (2) the price of drinking water (Cost_Water_Drink) from WP1.1; (3) the amount of water 286
diverted for human consumption (DrinkWater_Supply) from WP1.1; (4) the population in Llobregat 287
[image:16.595.68.331.179.412.2]16
(Cost_N_Drink) from WT1.1; (6) the treatment cost per unit of suspended solids (Cost_SS_Drink) from
289
EP1.1; and (7) the slope of the water quality index - willingness to pay relationship (Slope) from 290
WT EP T “ -test allowed identifying parameters which were not statistically 291
different from zero and hence, could be excluded from the linear model. This is the case for 292
parameters with P values > 0.05, which were mainly the ones related with WP2.1, WP2.2, WP3.1, 293
WT1.2, WT1.3, WT1.4, EP2.1, EP2.2, EP3.1, EP4.1, EP3.2, HS1.3 and HS1.4 benefits. The dispersion of 294
the sensitivity shows that the sensitivity can change depending on the chosen combination of 295
valuation metrics. The highest dispersion is observed for WP related parameters. These results show 296
the wide range of sensitivity arising from the parameters used in each valuation metric between the 297
most and the least sensitive parameters in our study case) despite the conservative range of values 298
17
4. Discussion
300
In this study, we quantified both the structural and the parametric uncertainties in a practical 301
exercise of ecosystem services monetary valuation. We performed the analysis using biophysical 302
values of 4 freshwater related ecosystem services (WT, EP, HS, and WP) in the Llobregat River basin, 303
and specifically quantified the uncertainty stemming from the number of considered services, the 304
number of considered benefits per service, the chosen valuation metric, and the valuation metric 305
Altogether, the total monetary value of the considered ecosystem 306
services of the Llobregat basin ranged between 13 and 1061 M -1. The quantified total monetary
307
value in the Llobregat River basin is within the range of total monetary values one can calculate based 308
on the biome-specific values per hectare (39 - 446 M -1) (Costanza et al. 1997, 2014), and on the
309
Iberian Foix River basin values for total emergy-based water cost including the financial, 310
environmental, and resource costs M -1) (Brown et al. 2010).
311
Regarding uncertainty, depending on the number of ecosystem services included in the valuation 312
exercise, the average monetary value in the Llobregat River basin varied from 13 to 303 M -1 (CV =
313
0.48). Similarly, considering the 4 ecosystem services, and depending on the number of benefits per 314
service, the average monetary value varied from 118 to 687 M -1 (CV = 0.40). In the case of the
315
valuation metric choice, the monetary value varied between 557 and 1061 M -1 (CV =0.22),
316
whereas the parametric uncertainty involved a range between 530 and 1034 M -1 (CV = 0.23).
317
Therefore, looking into the uncertainty sources encompassing the entire ecosystem services 318
valuation, we found that the highest uncertainty appears to be related to the number of services 319
considered in the study, such that the higher the number the closer to the total monetary value of 320
the particular ecosystem and the lower the uncertainty. The easiest advice here would be to consider 321
as many services as possible when valuing ecosystem services, but we are fully aware that usually the 322
number of services considered is constrained by data availability and socio-economic context, and 323
18 important source of uncertainty was the number of benefits considered for each ecosystem service, 325
and lastly the choice of the valuation metric and the parametric uncertainty. Thus, our results 326
highlight that the structural uncertainty is much higher (+8061 %; considering the total monetary 327
value increase between its minimal value with one service and its maximal value combining services, 328
benefits and valuation metrics), than the parametric uncertainty (+94 %; considering the total 329
monetary value increase between its minimal and maximal values from the parametric uncertainty 330
analysis). Accordingly, it is advisable to consider at least 2 benefits per service, as uncertainty was 331
considerably reduced when including at least 2 benefits per service (i.e., reduction of 49 % of the 332
coefficient of variation). Similarly, it is advisable to consider at least 2 valuation metrics for each 333
benefit, as has also been suggested by others (Hou et al. 2013). In this sense, we are aware that 334
different valuation metrics will often measure different things, often in different decision contexts, 335
and thus these results vary by design. Overall, the decision to use a certain valuation metric is very 336
context specific and relies on info about the robustness of the approach, whose values are under 337
consideration, who the decision maker is, and obviously the services and benefits being considered. 338
Regarding the parametric uncertainty, the uncertainty associated with the parameter values used in 339
the valuation metrics was not negligible, as some parameters played an important role. Therefore, 340
the sensitivity analysis to identify the relative weight of each parameter on the total monetary value 341
with a given structure of valuation therefore seems advisable, as more effort should be placed to 342
accurately estimate those parameters identified to be more sensitive and thus critical for the 343
valuation of ecosystem services. For example, in our case study, a change of 10 % of the parameter 344
Slope2 caused a change of 1.15 % in the total monetary value.
345
19
5. Guidelines for ecosystem services valuation
347
Recognizing that there are different sources of uncertainty in ecosystem service valuation, and 348
accepting that no guideline can avoid the uncertainty in the determination of the monetary value of 349
ecosystem services, we recommend considering the following steps when performing a monetary 350
valuation of ecosystem services in a particular decision-making context: 351
(i) Define the ecosystem services of interest and the linkages with the ecosystem functions that 352
sustain them (e.g.., the water provisioning service is linked with the ecological function water 353
balance). 354
(ii) Identify all benefits related with the ecosystem services of interest, benefits understood as the 355
gains in human wellbeing. 356
(iii) Select as many benefits as possible among the identified benefits, as probably not enough 357
information will be available to value all the identified benefits. If possible, consider at least 2 358
benefits per service, as we have found that this can significantly reduce the uncertainty in the 359
monetary value of a given service. 360
(iv) Identify all potential valuation metrics related to the chosen benefits, valuation metrics 361
understood as the functions applied to quantify the monetary value of benefits (e.g., the benefit 362
water provisioning for irrigation can be valued through a production-based approach or through a 363
market price metric). 364
(v) Select, if possible, 2 valuation metrics for each of the selected benefits. Note here that different 365
valuation metrics will often measure different things in different decision-making contexts, so it is 366
important that the selected ones are relevant for the given decision-making context. 367
(vi) Perform a sensitivity analysis to identify the most relevant parameters of the selected valuation 368
20 valuation metric using different values within this range (e.g., the price of water for irrigation can vary 370
between different regions, different years or even within the year according to dry and wet periods). 371
Overall, the selection of services, benefits and valuation metric might be defined by a study 372
decision-making context, but the uncertainty of the parameters is independent from the context and, 373
therefore, it is advisable to pay special attention to them given the relevance they have in terms of 374
uncertainty. When defining the valuation structure, practitioners should be aware of the uncertainty 375
inherent to the process of ecosystem services monetary valuation, and of the relevance of following 376
each one of the recommended steps. Although the recommended guideline can reduce the 377
uncertainty in ecosystem services monetary valuation, a measure of uncertainty should always 378
21
6. Acknowledgements
380
We are very grateful to Ayla Kiser for useful comments on earlier versions of the manuscript. This 381
research was supported by the Spanish Ministry of Economy and Competitiveness through the 382
project SCARCE (Consolider-Ingenio 2010 CSD2009- J C 383
(JC2011-09116, to MT), and the Ramón y Cajal grant (RYC-2013-14595, to LC), as well as by a Marie 384
Curie European Reintegration Grant (PERG07-GA-2010-259219, to VA), and a Marie Curie Career 385
Integration Grant (PCIG9-GA-2011-293535, to LC). Authors acknowledge the support from the 386
Economy and Knowledge Department of the Catalan Government through Consolidated Research 387
Group (2014 SG R 291 - Catalan Institute for Water Research). 388
22
7. References
390
Acuña V, Díez JR, Flores L, Meleason M, Elosegi A. Does it make economic sense to restore rivers for 391
their ecosystem services? Jones J, editor. J Appl Ecol. 2013 Aug 7;50(4):988 97. 392
Arrow K, Daily G, Dasgupta P, Levin S, Mäler K-G, Maskin E, et al. Managing ecosystem resources. 393
Environ Sci Technol. 2000;34(8):1401 6. 394
Bangash RF, Passuello A, Sánchez-Canales M, Terrado M, López A, Elorza FJ, et al. Ecosystem services 395
in Mediterranean river basin: Climate change impact on water provisioning and erosion control. 396
Sci Total Environ. Elsevier B.V.; 2013 May 6;458-460:246 55. 397
BenDor TK, Riggsbee JA, Doyle M. Risk and markets for ecosystem services. Environ Sci Technol. 2011 398
Dec 15;45(24):10322 30. 399
Brown MT, Martínez A, Uche J. Emergy analysis applied to the estimation of the recovery of costs for 400
water services under the European Water Framework Directive. Ecol Modell. Elsevier B.V.; 2010 401
Aug;221(17):2123 32. 402
Carpenter SR, De Fries R, Dietz T, Mooney HA, Polasky S, Reid W V., et al. Millennium ecosystem 403
assessment: research needs. Science (80- ). 2006;314:257 8. 404
Chavas J. Ecosystem valuation under uncertainty and irreversibility. Ecosystems. 2000;3:11 5. 405
Corominas L, Neumann MB. Ecosystem-based management of a Mediterranean urban wastewater 406
system: A sensitivity analysis of the operational degrees of freedom. J Environ Manage. Elsevier 407
Ltd; 2014;143:80 7. 408
C R D A R G R“ F “ G M H B T
409
ecosystem services and natural capital. Nature. 1997;387(15 May):253 60. 410
Costanza R, de Groot R, Sutton P, van der Ploeg S, Anderson SJ, Kubiszewski I, et al. Changes in the 411
global value of ecosystem services. Glob Environ Chang. Elsevier Ltd; 2014;26(1):152 8. 412
de Groot RS, Alkemade R, Braat L, Hein L, Willemen L. Challenges in integrating the concept of 413
ecosystem services and values in landscape planning, management and decision making. Ecol 414
Complex. Elsevier B.V.; 2010 Sep;7(3):260 72. 415
de Groot RS, Wilson MA, Boumans RMJ. A typology for the classification, description and valuation of 416
ecosystem functions, goods and services. Ecol Econ. 2002;41(3):393 408. 417
Honey-R J A V B M B N M R M A Examining the Demand for 418
Ecosystem Services: The Value of Stream Restoration for Drinking Water Treatment Managers in 419
the Llobregat River, Spain. Ecol Econ. Elsevier B.V.; 2013 Jun;90:196 205. 420
Hou Y, Burkhard B, Müller F. Uncertainties in landscape analysis and ecosystem service assessment. J 421
Environ Manage. Elsevier Ltd; 2013 Sep;127 Suppl:S117 31. 422
Johnson KA, Polasky S, Nelson E, Pennington D. Uncertainty in ecosystem services valuation and 423
implications for assessing land use tradeoffs: An agricultural case study in the Minnesota River 424
23 Jordan SJ, Hayes SE, Yoskowitz D, Smith LM, Summers JK, Russell M, et al. Accounting for Natural 426
Resources and Environmental Sustainability: Linking Ecosystem Services to Human Well-Being. 427
Environ Sci Technol. 2010 Mar;44(5):1530 6. 428
K BL P “ B KA J KA F JC O N A L
429
well-being for improved assessment and valuation of ecosystem services. Proc Natl Acad Sci U S 430
A. 2012 Oct 22;109(45):18619 24. 431
Ludwig D, Brock WA, Carpenter SR. Uncertainty in discount models and environmental accounting. 432
Ecol Soc. 2005;10(2):13. 433
Mendelsohn R, Olmstead S. The Economic Valuation of Environmental Amenities and Disamenities: 434
Methods and Applications. Annu Rev Environ Resour. 2009 Nov;34(1):325 47. 435
Montgomery DC. Introduction to statistical quality control. 6th ed. New Jersey, U.S.A.: John Wiley & 436
Sons Ltd.; 2009. 437
Naeem BS, Ingram JC, Varga A, Agardy T, Barten P, Bennett G, et al. Get the science right when paying 438
“ - ). 2015;347(6227):1206 7. 439
Naidoo R, Ricketts TH. Mapping the Economic Costs and Benefits of Conservation. PLoS Biol. 440
2006;4(11):e360. 441
National Research Council. Valuing Ecosystem Services: Toward Better Environmental Decision-442
making. Washington DC, U.S.A.: National Academies Press; 2005. 443
Nelson E, Mendoza G, Regetz J, Polasky S, Tallis H, Cameron Dr, et al. Modeling multiple ecosystem 444
services, biodiversity conservation, commodity production, and tradeoffs at landscape scales. 445
Front Ecol Environ. 2009 Feb;7(1):4 11. 446
Nicholson E, Mace GM, Armsworth PR, Atkinson G, Buckle S, Clements T, et al. Priority research areas 447
for ecosystem services in a changing world. J Appl Ecol. 2009;46:1139 44. 448
Rouquette JR, Posthumus H, Gowing DJG, Tucker G, Dawson QL, Hess TM, et al. Valuing nature-449
conservation interests on agricultural floodplains. J Appl Ecol. 2009 Apr;46(2):289 96. 450
Saltelli A, Ratto M, Tarantola S, Campolongo F. Sensitivity analysis for chemical models. Chem Rev. 451
2005;105(7):2811 28. 452
Saltelli A, Tarantola S, Campolongo F, Ratto M. Sensitivity analysis in practice: a guide to assessing 453
scientific models. John Wiley & Sons Ltd; 2004. 454
Sánchez-Canales M, López Benito A, Passuello A, Terrado M, Ziv G, Acuña V, et al. Sensitivity analysis 455
of ecosystem service valuation in a Mediterranean watershed. Sci Total Environ. Elsevier B.V.; 456
2012 Dec 1;440:140 53. 457
Sánchez-Canales M, López-Benito A, Acuña V, Ziv G, Hamel P, Chaplin-Kramer R, et al. Sensitivity 458
analysis of a sediment dynamics model applied in a Mediterranean river basin: Global change 459
and management implications. Sci Total Environ. Elsevier B.V.; 2015 Oct 7;502:602 10. 460
Scolozzi R, Morri E, Santolini R. Delphi-based change assessment in ecosystem service values to 461
24 Seppelt R, Dormann CF, Eppink F V., Lautenbach S, Schmidt S. A quantitative review of ecosystem 463
service studies: approaches, shortcomings and the road ahead. J Appl Ecol. 2011 Jun 464
26;48(3):630 6. 465
Spangenberg JH, Settele J. Precisely incorrect? Monetising the value of ecosystem services. Ecol 466
Complex. Elsevier B.V.; 2010 Sep;7(3):327 37. 467
T HT R T G AD W “A “ R N E I VE“T U G
468
TEEB. The Ecological and Economic Foundation. 2010. 469
Terrado M, Acuña V, Ennaanay D, Tallis H, Sabater S. Impact of climate extremes on hydrological 470
ecosystem services in a heavily humanized Mediterranean basin. Ecol Indic. 2014;37:199 209. 471
Terrado M, Sabater S, Chaplin-Kramer B, Mandle L, Ziv G, Acuña V. Model development for the 472
assessment of terrestrial and aquatic biodiversity in conservation planning. Sci Total Environ. 473
Elsevier B.V.; 2015;In Press:DOI 10.1016/j.scitotenv.2015.03.064. 474
Turner K, Georgiou S, Clark R, Brouwer R, Burke J. Economic valuation of water resources in 475
agriculture: From the sectoral to a functional perspective of natural resource management. 476
Food and Agriculture Organization of the United Nations, Rome; 2004. 477
Wallace KJ. Classification of ecosystem services: Problems and solutions. Biol Conserv. 2007 478
Oct;139(3-4):235 46. 479
Woodward RT, Wui Y-S. The economic value of wetland services: a meta-analysis. Ecol Econ. 480
2001;37(2):257 70. 481
25
Tables
[image:26.842.73.775.153.483.2]483
Table 1. Benefits, endpoints, beneficiaries, valuation metrics and values of 4 ecosystem services: Water Provisioning (WP), Waste Treatment (WT), Erosion 484
Protection (EP) and Habitat for Species (HS). 485
Benefits Endpoints Beneficiaries Valuation metrics Value
Water provisioning
WP1.1 Water for drinking purpose Surface water Household water consumers Market Price Value of water for drinking purpose WP2.1 Water for irrigation purpose Surface water Farmers Production based approach Value of water for irrigation purpose
WP2.2 Surface water Farmers Market Price Value of water for irrigation purpose
WP3.1 Hydropower production Reservoirs Energy producers and tax payers Market price Value of water for hydropower production
Waste treatment
WT1.1 Higher surface water quality Drinking water Treatment facilities and tax payers Avoided cost Cost of water treatment for drinking purpose (contaminant removal)
WT1.2 Drinking water Treatment facilities and tax payers Avoided cost Cost of water treatment for drinking purpose (contaminant removal)
WT1.3 Drinking water Consumers Avoided cost Cost of health care linked to poor water quality WT1.4 Rivers and lakes Users and non-users Avoided cost Cost of ecosystem damages
WT2.1 Enjoyment of recreational areas Rivers and lakes Recreationists Contingent valuation Willingness to pay for clean water bathing areas
Erosion protection
EP1.1 Higher surface water quality Drinking water Treatment facilities and taxpayers Avoided cost Cost of water treatment for drinking purpose (suspended sediment filtering)
EP2.1 Avoided soil losses Land Land owners Replacement cost Cost of soil restoration
EP2.2 Land Land owners Market price Loss of income from productivity loss
EP3.1 Extension of water management infrastructures lifetime
Reservoirs Reservoirs managers and taxpayers Avoided cost Cost of dredging dam reservoirs
EP3.2 Reservoirs Reservoirs managers and taxpayers Avoided cost Cost of dredging dam reservoirs EP4.1 Soil carbon storage Land Users and non-users Market price Value of soil carbon storage
EP5.1 Enjoyment of recreational areas River and lakes Recreationists Contingent valuation Willingness to pay for clear water bathing areas
Habitat for species
HS1.1 Existence / conservation of genetic and species diversity
Land, stream and wetlands
Everyone Contingent valuation Willingness to pay for species conservation
HS1.2 Land Everyone Public investments Investments in biodiversity conservation
HS1.3 Stream Recreationists Market price Sale of fishing licenses
26
Appendices
486
Additional Supporting Information may be found in the online version of this article. 487
Table A1. List of the parameters used to value the multiple benefits of the 4 ecosystem services. 488
Table A2. List of the equations used to value the multiple benefits of the 4 ecosystem services. 489
Table A3. Benefit values, service values and total monetary value for the Llobregat basin. 490