City, University of London Institutional Repository
Citation
:
Jensen, A. M., Stevens, R. J. and Burls, A. (2017). Muscle testing for lie detection: Grip strength dynamometry is inadequate. European Journal of Integrative Medicine, doi: 10.1016/j.eujim.2017.11.001This is the accepted version of the paper.
This version of the publication may differ from the final published
version.
Permanent repository link:
http://openaccess.city.ac.uk/18485/Link to published version
:
http://dx.doi.org/10.1016/j.eujim.2017.11.001Copyright and reuse:
City Research Online aims to make research
outputs of City, University of London available to a wider audience.
Copyright and Moral Rights remain with the author(s) and/or copyright
holders. URLs from City Research Online may be freely distributed and
linked to.
City Research Online: http://openaccess.city.ac.uk/ [email protected]
Accepted Manuscript
Title: Muscle testing for lie detection: Grip strength dynamometry is inadequate
Authors: Anne M. Jensen, Richard J. Stevens, Amanda J. Burls
PII: S1876-3820(17)30215-9
DOI: https://doi.org/10.1016/j.eujim.2017.11.001 Reference: EUJIM 736
To appear in:
Received date: 19-7-2017 Revised date: 27-9-2017 Accepted date: 2-11-2017
Please cite this article as: Jensen Anne M, Stevens Richard J, Burls Amanda J.Muscle testing for lie detection: Grip strength dynamometry is inadequate.European Journal of Integrative Medicine https://doi.org/10.1016/j.eujim.2017.11.001
Muscle testing for lie detection: Grip strength dynamometry is inadequate
Running Head: Grip strength testing inadequate for lie detection
Authors: (1) Anne M. Jensen DC, MSc, MS, DPhil
Department of Continuing Professional Education and Department of Primary Care Health Sciences University of Oxford
Oxford, U.K.
(2) Richard J. Stevens MSc, PhD
Department of Primary Care Health Sciences University of Oxford
Oxford, U.K.
(3) Amanda J. Burls
MBBS MSc (Neuroscience) MSc (Public Health) FFPH School of Health Sciences
City University London London, U.K.
Corresponding Author: Dr Anne M Jensen
DC, MSc, DPhil
Wolfson College
Oxford OX2 6UD UK
Telephone: +44 (0)1865 600 599 Email: [email protected]
Muscle testing for lie detection: grip strength dynamometry is inadequate
ABSTRACT
Introduction: Although DMT is primarily used in the diagnosis of neuromusculoskeletal (NMS)
disorders, previous studies have attempted to use other forms of manual muscle testing (MMT) to
detect conditions other than NMS. For instance, muscle response testing (MRT) was used to
distinguish lies (a known stressor) from truth. Therefore, it is hypothesised that DMT might be
used to detect deceit as well, and the aim of this study was to investigate if grip strength via
dynamometric muscle testing (DMT) could be used to distinguish lies from truth.
Methods: A prospective study of diagnostic test accuracy was carried out. Twenty participants,
aged 18-65 years, with healthy hands, were recruited. Participants were given a visual stimulus
and followed an auditory instruction to lie or to tell the truth about the stimulus, beforerecording
grip strength with a dynamometer. Testing proceeded in this manner until 20 DMTs were
performed, 10 by each hand. We analysed the accuracy of grip strength for detecting lies.
Results: The mean grip strength after true statements was found to be 24.9 kg (95% CI 20.3 to
29.6), and after false statements, 24.8 (95% CI 20.2 to 29.5), which were not statistically different
(p=0.61).
Conclusion: DMT via hand-held grip strength dynamometry failed to distinguish lies from truth.
These results seem to suggest that strength as measured by DMT is not impacted by deceit. A
limitation of this study is it is not generalisable to other types or applications of MMT or MRT or
to other target conditions.
Muscle testing for lie detection: grip strength dynamometry is inadequate
1 Introduction
Muscle Response Testing (MRT) is a type of manual muscle testing (MMT) used by integrative
health care providers to assess not muscular strength, but rather, MRT, a binary test, is used to
detect other specified target conditions. The tester applies a force to an indicator muscle and labels
the outcome as either “weak” or “strong” depending on the muscle’s ability to resist the force.
MRT is a commonly used in kinesiology techniques, such as Applied Kinesiology, HeartSpeak
and Total Body Modification. This paper reports one study in a series of scientific experiments
designed to assess the validity, accuracy and precision of muscle response testing (MRT).
Previous studies in this series demonstrated that MRT could be used to distinguish lies from truths
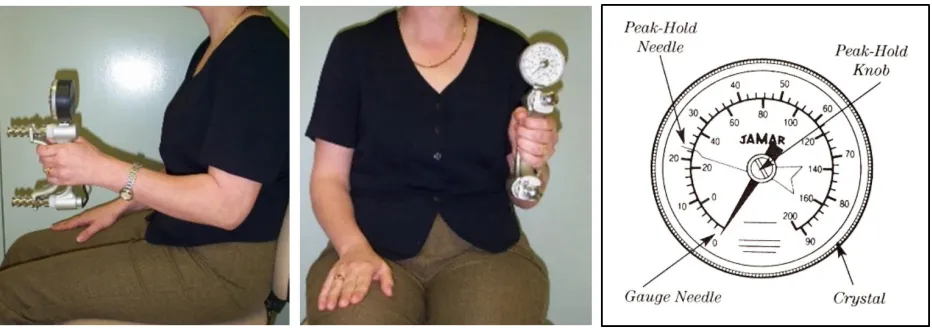
[1, 2]. As a comparator, in this study the practitioner-applied testing of MRT was replaced with an
objective instrument, a handheld or grip-strength dynamometer (HHD; see Figure 1), in order to
assess its usefulness in the same application: to distinguish lies from truths.
Muscle strength testing is typically used to diagnose neuromusculoskeletal (NMS) disorders,
however in recent times other applications have emerged. One type of MMT, MRT, arose from
Goodheart’s Applied Kinesiology and other techniques in the 1980’s [3, 4], and is estimated to be
used by over 1 million people worldwide [5]. MRT is distinct from other types of MMT in that
typically only one muscle (usually the deltoid) is tested repeatedly, to detect the presence of
potential target conditions, such as food allergies [6-10], phobia [11, 12], and deceit [1, 2].
However, despite its widespread use, many clinicians argue that MRT lacks credibility objectivity
In an effort to quantify muscle strength measurement, and thereby gain objectivity, instruments
such as the HHD were developed. Dynamometric muscle testing (DMT) has been shown to be
reliable in different populations [14-16], and subjective practitioner judgement of muscle strength
by MMT has been shown to correlate well with muscle strength measured objectively by HHD
[17-21]. In addition, DMT correlates well with other forms of MMT [17], and its intra-subject
test–retest variability has been found to be small [22].
If the loss of muscle strength is the underlying mechanism behind the observed ability of MRT to
distinguish lies from truth, it suggests that DMT should also be able to distinguish lies from truth
[17]. The aim of this study is to assess whether muscle strength (via DMT) can distinguish lies
from truth.
2 Methods
This was a prospective diagnostic test accuracy study. No participant was assessed prior to
enrolment. This protocol received ethics committee approval by the Oxford Tropical Research
Ethics Committee (OxTREC; Approval #41-10) and the Parker University Institutional Review
Board for Human Subjects (Approval # R19_10). In addition, this study protocol was
prospectively registered with two clinical trials registries: the Australian New Zealand Clinical
Trials Registry (ANZCTR; www.anzctr.org.au), and US-based ClinicalTrials.gov. Written
informed consent was obtained from all participants. This study is reported in accordance with the
Standards for the Reporting of Diagnostic Test Accuracy Studies (STARD) guidelines [23-26].
2.1 Overview
Participants were given a visual stimulus (a picture displayed on a computer screen: for example,
recording grip strength with a dynamometer. We analysed the accuracy of grip strength (via DMT)
for detecting lies. This study is one in a series of studies assessing the validity of MRT, and as
such it follows a similar protocol [1, 2].
2.2 Participants and Setting
Participants had to be aged between18-65 years, have fully functioning and pain-free hands, and
be fluent in English. Volunteers were excluded if they had visual, auditory or speech impairment.
Both MRT-naïve and non-MRT-naïve participants were eligible for enrolment. Recruitment was
by direct contact, social media and word of mouth. All recruitment took place in the states of Texas
and New York, USA.
Each participant was given a Participant Information Sheet (PIS) and gave written informed
consent. Pre- and post-test questionnaires (see Supplements 1 & 2, respectively) were completed
by each participant to collect demographic information and participant opinions.
2.3 Test Methods
The index test under investigation was hand-held grip strength DMT, which was compared to the
actual verity of the spoken statement (i.e. the reference standard), and the target condition was
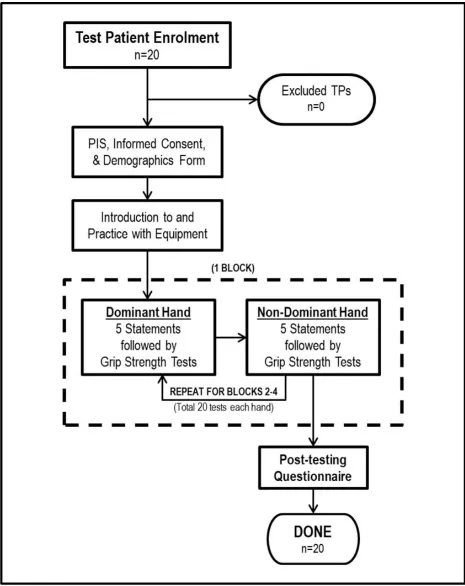
deceit. Each participant performed 20 DMTs after speaking an instructed statement out loud, 10
with their dominant hand and 10 with their non-dominant hand, broken up into blocks of five: 5
dominant, 5 non-dominant, 5 dominant, 5 non-dominant. Participants always started with their
dominant hand and ended with their nondominant hand.
Visual stimuli in the form of neutral pictures were randomly presented on a computer screen
viewed by the participant. In addition, a verbal instruction was also randomly generated by the
false statement about the viewed picture. For example, on the computer screen might be presented
an apple, and the participant might be instructed to say this true statement: “Say, ‘I see an apple.’
” Alternatively, the participant may be instructed to say a false statement, such as, “Say, ‘I see a
boat.’ ” Immediately after speaking the true or false statement, the participant then performed the
DMT.
The stimuli presented were selected from a database of 100 affect-neutral pictures/statements.
DirectRT© Research Software (Empirisoft Corporation, New York, NY) was programmed to
randomly present a unique sequence of stimuli for each participant, randomising the verity of the
statements (i.e. true or false) and keeping the prevalence of false statements constant at 0.50.
2.3.1 Grip Strength Dynamometry
All DMT was performed using the same factory calibrated hydraulic JAMAR (Model J00105,
Lafayette, Indiana, USA) analogue hand-grip dynamometer and employing a standardised
approach. This brand of dynamometer is the most widely used, and has proven inter-rater,
intra-rater, and test-re-test reliability [27]. Participants were instructed to squeeze the dynamometer for
5 seconds, giving a maximum effort each time. They could rest as needed. The examiner read the
scale (in kilograms, kg) on the dial face, which was facing away from the participant, and after
recording the result, reset the peak-hold needle to zero, ready for the next effort. Grip strength was
measured to the nearest 1kg.
2.3.2 Procedures
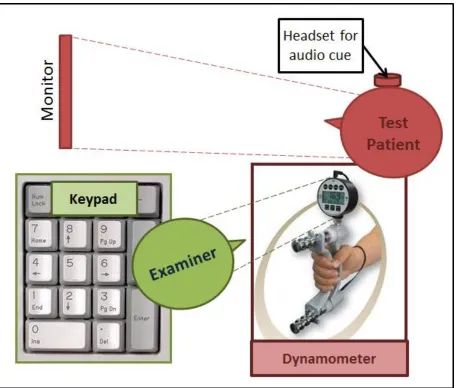
The participant was seated comfortably in front of a computer and held the dynamometer vertically
in his hand, elbow at his side and bent to 90 degrees, forearm and wrist in neutral (i.e. palm facing
medially). The dial of the dynamometer was facing away from the participant such that it was out
she was seated in front and to the side of the participant, positioned so that she could read the dial
of the dynamometer, and was also unable to see the participant’s computer screen. For the testing
scenario layout, see Figure 2. One repetition of DMT consisted of: (1) participant viewed a picture,
(2) participant was instructed (via an earpiece) to say a statement in relation to the picture, (3)
participant took the DMT position, (4) while viewing the picture, participant spoke the instructed
statement, (5) participant immediately performed the DMT, and (6) the examiner recorded the grip
strength result directly into the computer, which advanced the screen to the next picture/statement.
Testing proceeded in this manner until 2 blocks of 5 DMTs were performed by each hand.
In the post-testing questionnaire (see Supplement 2), participants were asked if they noticed
anything different in their tests following true statements compared to false statements. This
question was included to ascertain if they guessed the aim of the study, which was to investigate
if grip strength can be used to distinguish lies from truth. It was likely that those with prior MRT
experience were aware of the paradigm that MRT following false statements resulted in a “weak”
outcome, and MRT following a true statement resulted in a “strong” outcome. Therefore, it was
necessary to track on both the MRT-naivety of the participants and if they noticed a difference or
guessed the paradigm.
2.4 Sample size
Based on a previous study, in which the accuracy of manual MRT for lie detection had mean 66%
and standard deviation 13% across participants [1], we estimated that a sample size of 20
participants would have greater than 99% power to detect an overall accuracy of 66% compared
2.5 Statistical Methods
Mean grip strengths following false statements and true statements were calculated for each
participant and are reported with their 95% confidence intervals. Then since the data were not
normally distributed, the means were compared using a two-tailed rank sign test. In MRT, false
positives (Type I Errors) are equally as important as false negatives (Type 2 Errors), and was
defined as the overall percent correct. However, in this study, we simply compared the mean grip
strength (kg) after true statements and compared this to the mean grip strength (kg) after false
statements to determine if there was a difference. Finally, correlation analyses were made between
mean grip strengths and other participant characteristics, such as gender, MRT-naïveté, confidence
in MRT, and if the TP reported guessing the paradigm. All data were analyzed using Stata/IC 12.1
(StataCorp LP, College Station, Texas), specifically the commands “signrank” and “pwcorr.”
3 Results
3.1 Participants
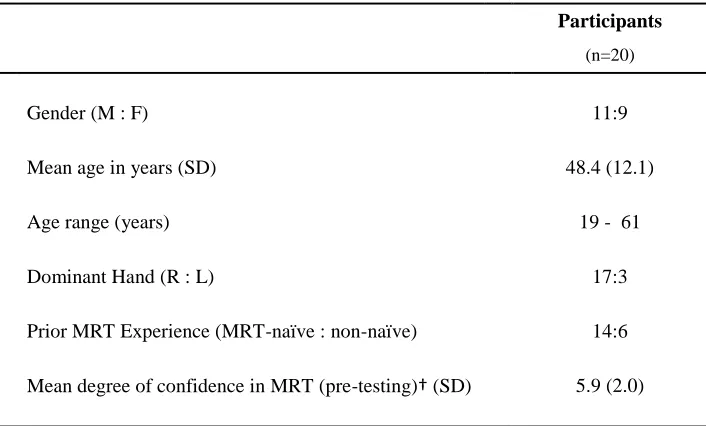
Twenty participants were enrolled in the United States between June and August 2011, and
included 11 males and 9 females. The mean (SD) age was 48.4 (12.1) years. Seventeen reported
being right-hand dominant, 3, left-hand dominant, and 14 reported being MRT-naïve and 6
reported having had some prior experience with MRT. For a summary of participant
demographics, see Table 1. Also, see Figure 3 for the Participant Flow Diagram.
3.2 Test Results
Participants took between 5 and 15 minutes to complete their participation, all completed all DMT
scores showed that the data were not normally distributed (see Supplemental Figure 1), so
nonparametric statistics (e.g. sign test) have been applied.
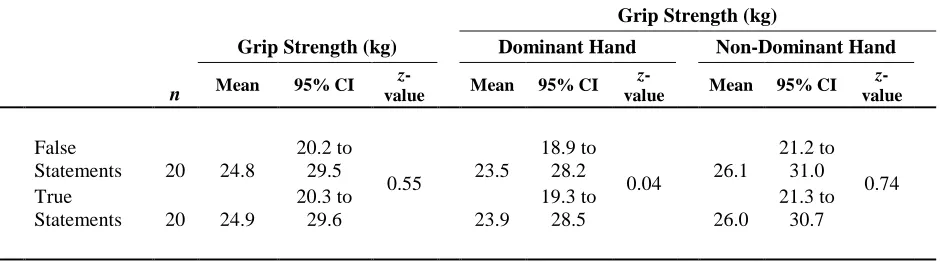
The mean grip strength after true statements was found to be 24.9 kg (95% CI 20.3 to 29.6), and
after false statements, 24.8 (95% CI 20.2 to 29.5), which was not statistically different (z=0.60).
The difference in mean grip strengths between true and false statements (Difference = Mean Grip
StrengthTrue – Mean Grip StrengthFalse) was 0.1 (95% CI -0.4 to 0.6), which was no different from
0.0 (p=1.00). See Table 2. Also see Supplemental Table 1 for the mean grip strengths for each
participant.
Finally, mean grip strengths by block were found to be consistent throughout testing (see
Supplemental Figure 2). Also, it is noted that mean grip strengths in this study fell toward to lower
end of the of normative range grip strengths reported in current literature [28, 29].
4 Discussion
4.1 Statement of Principal Findings & Possible Explanations of Results
This study failed to demonstrate that deceit can be detected using grip strength dynamometry, an
instrument form of MMT. This contradicts the findings of similar previous studies which
demonstrated that another form of MMT, the practitioner-applied muscle response testing (MRT),
can accurately distinguish false statements from true [30].
One may be tempted to interpret this contradiction to mean that perhaps the MRT studies simply
by chance produced a false positive (that is, it found an effect where none exists). However,
because these studies were rigorously designed to prevent potential biases and because they
due to some other feature, which at this stage, remains largely unknown [2, 30]. Accordingly, then,
there must be other plausible explanations for the findings of the present study.
One of the first difference to note is that the DMT in this study tested the participants’ grip strength,
whereas the prior studies in this series tested shoulder strength via MRT of the deltoid muscle. It
is possible that the deltoid muscle behaves differently compared to the muscles used for grip. It
has not been established that the results of the MRT studies can be generalized to testing muscles
other than the deltoid. Secondly, while both types of MMT (DMT and MRT) use isometric muscle
contractions (at least initially), DMT uses a patient’s maximum effort, whereas MRT uses
submaximal force and this may be a relevant factor [31].
Another difference between the two methodologies is the presence of a practitioner. Interaction
with a practitioner is integral to the implementation of MRT, but not of DMT, in which a
practitioner is not required. It is possible that the practitioner is, in some way, a necessary
component of the success of MRT.
Another possible explanation of the results is this study is that the instrument used (i.e. the HHD)
lack the of sensitivity necessary to make a distinction between grip strengths. Because previous
research has found that DMT was more discriminating than MMT in identifying small differences
in muscle strength [17, 22, 32], we think that this reason is highly unlikely. Another possible
explanation of these findings is that while DMT is measuring strength, deceit does not cause
changes in strength, per se, but instead, changes in some other quality (or qualities) perceptible by
MRT but not by DMT. It would be important to think what element is biologically plausible. One
possibility is that MRT evaluates power rather than strength, like DMT. The strength of a muscle
is the degree of force it can exert, and is dependent upon the size of the muscle and its nerve supply,
velocity) may be important factors in MRT [34-36]. Power, which takes into consideration force
and velocity, might be detectable by MRT but is not detected by DMT.
These negative findings might also be attributable to inconsistencies in patients’ efforts throughout
their testing, such as through fatigue or lack of attention or motivation. However, mean grip
strengths remained consistent throughout testing, so this explanation is implausible.
Also interesting is the finding that there was a statistically significant difference in mean grip
strengths after true statements compared to false statements in the group that reported guessing the
paradigm under investigation. Because there was no significant difference in the group that did not
report guessing the paradigm, this finding might be accounted for by social desirability bias, or the
desire of the participant to please the investigator [37]. An enhancement to this study design might
be to screen participants using a psychometric instrument, such as the Marlowe-Crowne Social
Desirability Scale [38], to track on the possibility of this type of bias.
Another finding was that participants in this study achieved remarkably lower mean grip strengths
than normative means. Numerous internal and external factors exist that may impact a person’s
ability to contract maximally, such as fatigue, pain, volition, motivation and even time of day [39].
Reasons why our participants scored lower may be because of their high mean age (48.4 years, SD
12.1 years), or that all data collection occurred in America, or that this sample was particularly
unhealthy. Because no information was collected on health status, fatigue, time of day or
motivation level, it is difficult to speculate as to the cause of this marked difference.
The lack of significant findings may also be explained by the use of s single HHD. While on the
one hand, this may be considered a strength of this methodology, since all participants used the
measuring accurately. This could account for both the results differing from population norms and
the failure to detect a true effect.
Furthermore, since grip strengths were found to be block-wise stable throughout testing, it is
unlikely that learning, fatigue or other internal/external factors played a significant role. Lastly,
the DMT in this study was patient-initiated while MRT is usually tester-initiated. This may have
had an influence as it seems that there are fundamental differences between the two [40, 41].
A final explanation for the discrepant findings between this study and the MRT studies could be
that, despite the rigorous methods and statistical tests, this study is a false negative finding (that is
it failed to pick up a true underlying weakening of the muscles).
4.2 Other DMT Studies
Although DMT is mainly used in the diagnosis of NMS disorders, previous studies have attempted
to use DMT and other forms of MMT to detect conditions other than NMS. For instance, Radin
successfully used grip strength to distinguish refined sugar (purportedly, a toxic substance and a
stressor) from sand (hypothetically inert or nontoxic, and hence, not a stressor) [42]. However,
three replication studies failed to support his findings [43-45].
4.3 Strengths and Limitations
A strength of this study is its rigorous design, which adhered to the STARD guidelines for studies
of diagnostic test accuracy. In addition, since one examiner (AJ) performed all assessment,
adherence was high. A more explicit strength was the duration of participation was appropriate:
given that maximum effort tests like DMT are limited by patient fatigue, and since the results show
that fatigue was not influencing factor. In addition, the inclusion of participants with and without
participants who reported guessing the paradigm and those who did not, there was no significant
difference found between MRT-naïve and non-MRT-naïve participants.
A limitation of this study is that with 20 participants, it may have been underpowered. Also, it is
possible that the analogue dynamometer used may have lacked the necessary sensitivity required,
and that a digital one may have been a better choice. Another limitation is the lack of
generalizability of these results to other types of MMT. In addition, the recruitment method of
direct contact of potential participants may have introduced selection bias, and so may be
considered a limitation.
4.4 Implications for Clinical Practice
Because these results failed to confirm the research hypothesis that DMT can be used to distinguish
lies from truth, the clinical implications of these results are limited: DMT is not useful for detecting
deceit. Accordingly, these results cannot be generalised to other forms of MMT.
4.5 Unanswered Questions and Future Research
In this study, an analog DMT dynamometer was used, however, future researchers may want to
use a digital / computerised dynamometer, which might produce useful information about force,
time, displacement and power. These factors might be what MRT is detecting that DMT is not.
Also, future researchers may consider using a larger sample size and more than one HHD for
assessing grip strength, to avoid potential calibration errors.
Although previous studies of MMT and MRT used force plates to quantify practitioner-applied
pressure [35, 36, 46], the force still involved a practitioner. To remove their potential subjectivity,
future research may want to test the deltoid muscle employing an instrument which can measure
isokinetic dynamometer (e.g. a Biodex dynamometer) [48, 49]. Using specifically quantified
measurements may further establish if instrument-only MMT is able to distinguish truths from lies.
5 Summary
DMT via hand-held grip strength dynamometry failed to distinguish lies from truth. One
explanation of this might be that strength, as measured by DMT, is not impacted by deceit. For
instance, perhaps it is not strength, but some other yet undetermined quality (e.g. power), that
allows MRT to accurately make this distinction but not DMT. Another explanation might be that
the practitioner is an important part of the MMT complex, since previous studies found that MRT
was useful for detecting deceit. Further research is needed to reconcile these apparently
contradictory findings of this study.
6 Author Notes
6.1 Authors Declaration
All authors attest that all research was done by the authors.
6.2 Funding / Financial Support
This research did not receive any specific funding, grant or financial support from any funding
6.3 Acknowledgments
The authors would like to thank those who volunteered their time to participate in this study, and
Parker University for the use of their facilities.
6.4 Conflicts of interest
7 References
[1] A.M. Jensen, R.J. Stevens, A.J. Burls, Estimating the accuracy of kinesiology-style manual
muscle testing: two randomised-order blinded studies, BMC Complementary and Alternative
Medicine 16 (2016) 492.
[2] A.M. Jensen, The accuracy and precision of kinesiology-style manual muscle testing,
Department of Continuing Education and Department of Primary Health Care Sciences, University
of Oxford, Oxford, UK, 2015.
[3] J. Thie, M. Thie, Touch for health: A practical guide to natural health, DeVorss Publications,
Camarillo (CA), 2005.
[4] D.S. Walther, Applied Kinesiology: Synopsis, 2nd ed., Systems DC, Pueblo, CO, 2000.
[5] A.M. Jensen, Estimating the prevalence of use of kinesiology-style manual muscle testing: A
survey of educators, Advances in Integrative Medicine 2(2) (2015) 96–102.
[6] U. Banis, Diagnosis of allergy with kinesiology - A critical view, Allergiediagnostik mit der
kinesiologie - Eine kritische betrachtung 42(6) (2001) 414-417.
[7] J.S. Garrow, Kinesiology and food allergy, Br. Med. J. 296(6636) (1988) 1573-1574.
[8] J. Kleine-Tebbe, D.A. Herold, Inappropriate test methods in allergy, Ungeeignete
Testverfahren in der Allergologie 61(11) (2010) 961-966.
[9] S.S. Teuber, C. Porch-Curren, Unproved diagnostic and therapeutic approaches to food allergy
and intolerance, Curr. Opin. Allergy Clin. Immunol. 3(3) (2003) 217-221.
[10] B. Wüthrich, Unproven techniques in allergy diagnosis, J. Investig. Allergol. Clin. Immunol.
[11] K.B. Peterson, A preliminary inquiry into manual muscle testing response in phobic and
control subjects exposed to threatening stimuli, J. Manipulative Physiol. Ther. 19(5) (1996)
310-316.
[12] A.M. Jensen, A. Ramasamy, Treating spider phobia using Neuro Emotional Technique™:
Findings from a pilot study, J. Altern. Complement. Med. 15(12) (2009) 1363-74.
[13] S. Hall, G. Lewith, S. Brien, P. Little, A review of the literature in Applied and Specialised
Kinesiology, Forsch. Komplementarmed. 15(1) (2008) 40-46.
[14] C.E. Baldwin, J.D. Paratz, A.D. Bersten, Muscle strength assessment in critically ill patients
with handheld dynamometry: An investigation of reliability, minimal detectable change, and time
to peak force generation, J. Crit. Care 28(1) (2013) 77-86.
[15] R.W. Bohannon, Muscle strength: Clinical and prognostic value of hand-grip dynamometry,
Curr. Opin. Clin. Nutr. Metab. Care 18(5) (2015) 465-470.
[16] M.S. Clifford, P. Hamer, M. Phillips, F.M. Wood, D.W. Edgar, Grip strength dynamometry:
Reliability and validity for adults with upper limb burns, Burns 39(7) (2013) 1430-1436.
[17] C.T. Wadsworth, R. Krishnan, M. Sear, Intrarater reliability of manual muscle testing and
hand-held dynametric muscle testing, Phys. Ther. 67(9) (1987) 1342-1347.
[18] K.W. Hayes, J. Falconer, Reliability of hand-held dynamometry and its relationship with
manual muscle testing in patients with osteoarthritis in the knee, J. Orthop. Sports Phys. Ther.
16(3) (1992) 145-149.
[19] P. Aufsesser, M. Horvat, R. Croce, A critical examination of selected hand-held
[20] S. Aitkens, J. Lord, E. Bernauer, W.M. Fowler Jr, J.S. Lieberman, P. Berck, Relationship of
manual muscle testing to objective strength measurements, Muscle Nerve 12(3) (1989) 173-177.
[21] L. Dowhan, R. DeChicco, R. Welsh, W. R., M. Habib, P. Hipskind, G. Cresci, Comparison
between handgrip dynamometry and manual muscle testing performed by registered dietitians in
measuring muscle strength and function of hospitalized patients, Journal of Parenteral and Enteral
Nutrition & Food Science (2015).
[22] R. Colombo, L. Mazzini, G. Mora, R. Parenzan, G. Creola, I. Pirali, G. Minuco, Measurement
of isometric muscle strength: A reproducibility study of maximal voluntary contraction in normal
subjects and amyotrophic lateral sclerosis patients, Med. Eng. Phys. 22(3) (2000) 167-174.
[23] P.M.M. Bossuyt, M.M. Leeflang, Chapter 6: developing criteria for including studies,
Cochrane Handbook of Systematic Reviews of Diagnostic Test Accuracy Version 4.0 [updated
September 2008], The Cochrane Collaboration, London, 2008.
[24] P.M.M. Bossuyt, J.B. Reitsma, D.E. Bruns, C.A. Gatsonis, P.P. Glasziou, L.M. Irwig, D.
Moher, D. Rennie, H.C.W. De Vet, J.G. Lijmer, The STARD statement for reporting studies of
diagnostic accuracy: Explanation and elaboration, Clin. Chem. 49(1) (2003) 7-18.
[25] P.M.M. Bossuyt, J.B. Reitsma, D.E. Bruns, C.A. Gatsonis, P.P. Glasziou, L.M. Irwig, J.G.
Lijmer, D. Moher, D. Rennie, H.C. de Vet, Towards complete and accurate reporting of studies of
diagnostic accuracy: The STARD initiative, Br. Med. J. 326 (2003) 41-44.
[26] R.J. Bossuyt PM, Bruns DE, Gatsonis CA, et al, and For the STARD Group. , STARD 2015:
An Updated List of Essential Items for Reporting Diagnostic Accuracy Studies, Radiology 277(3)
[27] H.C. Roberts, H.J. Denison, H.J. Martin, H.P. Patel, H. Syddall, C. Cooper, A.A. Sayer, A
review of the measurement of grip strength in clinical and epidemiological studies: Towards a
standardised approach, Age Ageing 40(4) (2011) 423-429.
[28] N. Massy-Westropp, W. Rankin, M. Ahern, J. Krishnan, T.C. Hearn, Measuring grip strength
in normal adults: Reference ranges and a comparison of electronic and hydraulic instruments, J.
Hand Surg. (USA) 29(3) (2004) 514-519.
[29] C.M. Günther, A. Bürger, M. Rickert, A. Crispin, C.U. Schulz, Grip Strength in Healthy
Caucasian Adults: Reference Values, J. Hand Surg. (USA) 33(4) (2008) 558-565.
[30] A.M. Jensen, R.J. Stevens, A.J. Burls, Estimating the accuracy of kinesiology-style manual
muscle testing: Two randomised-order blinded studies, BMC Complementary and Alternative
Medicine (in press) (2016).
[31] K.M. Conable, Intraexaminer comparison of Applied Kinesiology manual muscle testing of
varying durations: a pilot study, J Chiropr Med 9(1) (2010) 3-10.
[32] T.A.R. Schreuders, R.W. Selles, M.E. Roebroeck, H.J. Stam, Strength measurements of the
intrinsic hand muscles: A review of the development and evaluation of the Rotterdam Intrinsic
Hand Myometer, J. Hand Ther. 19(4) (2006) 393-402.
[33] A.C. Guyton, J.E. Hall, Human physiology and mechanisms of disease, 10th edition, 10th ed.,
W.B. Saunders Co., Philadelphia, 2000.
[34] E.J. Sorenson, A comparison of muscle strength testing techniques in amyotrophic lateral
[35] W. Caruso, G. Leisman, The clinical utility of force/displacement analysis of muscle testing
in Applied Kinesiology, Int. J. Neurosci. 106(3-4) (2001) 147-157.
[36] W. Caruso, G. Leisman, A force/displacement analysis of muscle testing, Percept. Mot. Skills
91(2) (2000) 683-692.
[37] A. Furnham, Response bias, social desirability and dissimulation, Pers. Individ. Differ. 7(3)
(1986) 385-400.
[38] D.P. Crowne, D. Marlowe, A new scale of social desirability independent of psychopathology,
J. Consult. Psychol. 24(4) (1960) 349-354.
[39] S.R. McGarvey, B.F. Morrey, L.J. Askew, K.N. An, Reliability of isometric strength testing.
Temporal factors and strength variation, Clin. Orthop. NO. 185 (1984) 301-305.
[40] C.Y. Hsieh, R.B. Phillips, Reliability of manual muscle testing with a computerized
dynamometer, J. Manipulative Physiol. Ther. 13(2) (1990) 72-82.
[41] K. Conable, J. Corneal, T. Hambrick, N. Marquina, J. Zhang, Investigation of methods and
styles of manual muscle testing by AK practitioners, J Chiropr Med 4(1) (2005) 1-10.
[42] D.I. Radin, A possible proximity effect on human grip strength, Percept. Mot. Skills 58(3)
(1984) 887-888.
[43] W.G. Braud, A possible proximity effect on human grip strength: an attempted replication,
Percept. Mot. Skills 68(1) (1989) 157-158.
[44] B.S. Kendler, T.M. Keating, Re-evaluation of a possible proximity effect on muscular
[45] A.F. Quintanar, T.V. Hill, Sugar proximity and human grip strength, Percept. Mot. Skills
67(3) (1988) 853-854.
[46] D.A. Monti, J. Sinnott, M. Marchese, E.J.S. Kunkel, J.M. Greeson, Muscle test comparisons
of congruent and incongruent self-referential statements, Percept. Mot. Skills 88(3) (1999)
1019-1028.
[47] C.W. Maglischo, Bases of norms for cable-tension strength tests for upper elementary, junior
high, and senior high school girls, Res. Q. Am. Assoc. Health, Phys. Educ. Recreat. 39(3) (1968)
595-603.
[48] G. Gozlan, L. Bensoussan, J.M. Coudreuse, J. Fondarai, V. Gremeaux, J.M. Viton, A.
Delarque, Isokinetic dynamometer measurement of shoulder rotational strength in healthy elite
athletes (swimming, volley-ball, tennis): Comparison between dominant and nondominant
shoulder, Ann. Readapt. Med. Phys. 49(1) (2006) 8-15.
[49] J. Van Meeteren, M.E. Roebroeck, H.J. Stam, Test-retest reliability in isokinetic muscle
8 Figure Captions
FIGURE 1 – (A) and (B) Proper positioning during grip strength dynamometry; (C) Sample face of a grip strength dynamometer.
FIGURE 2 – Testing Scenario Layout
Tables
TABLE 1 - Demographics of Participants
Participants
(n=20)
Gender (M : F) 11:9
Mean age in years (SD) 48.4 (12.1)
Age range (years) 19 - 61
Dominant Hand (R : L) 17:3
Prior MRT Experience (MRT-naïve : non-naïve) 14:6
Mean degree of confidence in MRT (pre-testing)† (SD) 5.9 (2.0)
TABLE 2 - Comparison of Mean Grip Strengths (kg) for False vs. True Statements. Combined data for both hands, and Dominant and Non-Dominant Hands separately.
Grip Strength (kg)
Grip Strength (kg) Dominant Hand Non-Dominant Hand
n Mean 95% CI
z
-value Mean 95% CI
z
-value Mean 95% CI
z -value
False
Statements 20 24.8
20.2 to 29.5
0.55 23.5
18.9 to 28.2
0.04 26.1
21.2 to 31.0
0.74 True
Statements 20 24.9
20.3 to
29.6 23.9
19.3 to
28.5 26.0
21.3 to 30.7