“ The first step towards
tackling poverty is
understanding it better...”
POVERTY IN PERSPECTIVE
Claudia Wood
Jo Salter
Demos is a think-tank focused on power and politics. Our unique approach challenges the traditional, ‘ivory tower’ model of policymaking by giving a voice to people and communities. We work together with the groups and individuals who are the focus of our research, including them in citizens’ juries, deliberative workshops, focus groups and ethnographic research. Through our high quality and socially responsible research, Demos has established itself as the leading independent think-tank in British politics.
In 2012, our work is focused on four programmes: Family and Society; Public Services and Welfare; Violence and Extremism; and Citizens. Alongside and connected with our research programes, Demos has political projects focused on the burning issues in current political thinking, including the Progressive Conservatism Project, the Centre for London at Demos and Demos Collections, bringing together topical essays by leading thinkers and commentators.
Our work is driven by the goal of a society populated by free, capable, secure and powerful citizens.
First published in 2012 © Demos. Some rights reserved
Magdalen House, 136 Tooley Street London, SE1 2TU, UK
ISBN 978-1-909037-25-0 Copy edited by Susannah Wight Series design by modernactivity Typeset by modernactivity
Set in Gotham Rounded and Baskerville 10
POVERTY IN PERSPECTIVE
Claudia Wood
Jo Salter
Open access. Some rights reserved.
As the publisher of this work, Demos wants to encourage the circulation of our work as widely as possible while retaining the copyright. We therefore have an open access policy which enables anyone to access our content online without charge.
Anyone can download, save, perform or distribute this work in any format, including translation, without written permission. This is subject to the terms of the Demos licence found at the back of this publication. Its main conditions are:
· Demos and the author(s) are credited
· This summary and the address www.demos.co.uk are displayed · The text is not altered and is used in full
· The work is not resold
· A copy of the work or link to its use online is sent to Demos
You are welcome to ask for permission to use this work for purposes other than those covered by the licence. Demos gratefully acknowledges the work of Creative Commons in inspiring our approach to copyright. To find out more go to
1
2
3
4
5
6
7
8
Acknowledgements
Executive summary
Poverty in perspective: In graphics
SECTION 1:
National Poverty
Policy background
Methodological decisions taken in this project
Findings: child poverty groups
Policy implications for child poverty
Older people and households
without children cohorts
SECTION 2:
Local Poverty
Local poverty and data sharing – an introduction
Tackling multi-dimensional poverty types locally
Conclusions and recommendations
Appendix: Poverty indicator definitions
Endnotes References
9
13
39
59
61
85
109
141
163
181
183
215
259
265
273 299
9
Acknowledgements
This project has benefited from the knowledge and experience of a very wide range of individuals, and we apologise if we have missed anyone off the list.
First and foremost, we would like to thank the Esmée Fairbairn Foundation for making this project possible. Having sponsored our first report exploring this issue, 3D
Poverty, the Foundation demonstrated considerable faith in
the Demos and NatCen team to turn theory into reality and create a new analytical model to better understand poverty. Special thanks go to John Mulligan for his enthusiasm for this project from the beginning, and for contributing his insights to the research process.
Special thanks also go to the members of our project advisory board: Paul Allin, Prof Mike Brewer, David Brindle, Prof David Gordon, Katie Lane, Ian Mulheirn, Patrick Nolan, Prof Lucinda Platt, Jonathan Portes and Mary Riddell. This group has been particularly generous with their time in helping steer the research smoothly through methodological dilemmas and setbacks, and we are grateful to them for being so constructive with their ideas and advice.
We are also indebted to the three local authorities who allowed us to test out the practical application of our
typologies at a local level. Particularly, we would like to thank Nicola Kilvington, Mike Webb and Anna Brooke at Camden Council, Gareth Latham at Wirral Council and Paul Hayes at Wakefield Council, and also Emily Castle at Young Lives Consortium in Wakefield for her help in setting up fieldwork with voluntary and community groups in Wakefield.
11 Acknowledgements
At Demos, we are grateful for all the support we have received from our colleagues over the past year. Honourable mention goes to our interns Katherine Stevenson, Jennifer Norton, Nina Tobolewska, Ella Goschalk and Rosa Bransky, and researcher Chris Tryhorn.
Many others provided constructive criticism on our findings, which benefited the final report. Thanks to Ralph Scott, Rob Macpherson, Sophie Duder and Josephine Brady for coordinating the production and launch of the report, and Henrietta Ross whose outstanding design skills have created the infographics both in this report and on our new website. At NatCen, Ashley Brown, Nilufer Rahim and Fay Sadro have all dedicated considerable time and energy to this research.
As always, any errors or omissions are solely those of the authors.
Claudia Wood Jo Salter Gareth Morrell Dr Matt Barnes Ally Paget Duncan O’Leary
13
Executive summary
This report is the culmination of an 18-month long project, led by Demos, in partnership with NatCen and supported by the Esmée Fairbairn Foundation, to create a new model to under-stand poverty in a multi-dimensional way.
This new model is unlike other multi-dimensional measures or analyses as we have applied a set of 20 indicators to those with incomes below 70 per cent of the median in a large household panel study (Understanding Society: The UK Household Longitudinal Study, which covers 40,000 UK households1 ) and identified which combinations of indicators
cluster most frequently together. We are not redefining
poverty, or measuring it in a new way that replaces the existing income benchmark. Instead, we are applying a new model of analysis to the low-income population (using an existing income-based poverty line) to better understand the lived experience of poverty and generate new insights into how to tackle it. Our reasoning behind this approach is described in detail in the main report.
We are now able to describe 15 distinct types of poverty within the low-income population, characterised by a unique interaction of 20 indicators across three cohorts: households with and without children, and pensioner households.
15 Executive summary
Such an exercise has never been carried out before, and the insights presented in this report – and their policy implica-tions – are entirely new. In many cases they shake common assumptions about the meaning of poverty and what it is like for those living in poverty.
We were motivated to undertake this work following our report 3D Poverty, which explored the public’s perceptions and understanding of the poverty measures and analyses currently used, and the available alternatives.2 We soon
realised that an income-based poverty measure (the poverty line) was easy to understand, but used on its own might only prompt income-based solutions (benefit redistribution, or employment). In the face of unprecedented cuts to welfare spending and a sluggish labour market, however, neither solution is proving entirely effective in combating poverty, and we have seen an increase in in-work poverty over recent years. Attempts to think about the ‘causes and symptoms’ of poverty have had limited impact on policymaking thus far, and tend to be influenced by other agendas, such as social mobility, inequality or family breakdown.
We realised that a multi-dimensional analysis to enrich the current income-based measure was needed – one that resonated with ‘real life’ and could be understood by the public and used by practitioners and policymakers to tackle poverty in a less wide-ranging manner. After generating new findings through our analysis of the Understanding Society data, we verified them with 30 depth interviews with people living in each poverty ‘group’, and also attempted to apply our analysis in three local authority pilot areas.
This was undoubtedly an extremely ambitious
undertaking, but we believe that the results make an important contribution to our understanding of modern poverty in Britain today.
This report is structured in eight chapters, across two sections. Section 1 presents the policy context, methodology and national findings based on the new model that has been developed. Section 2 takes a closer look at how the model could be applied at local level and the challenges local data
present in repeating this analysis with anything other than the Understanding Society data.
We have also developed a new website to present our findings in a more accessible way, which can be found at www.demos.co.uk/poverty/index. NatCen has produced its own report, Exploring Multi-Dimensional Poverty: A research methodology
to create poverty typologies, which presents in greater detail the
methodology used to produce the findings from the quantitative analysis of Understanding Society and qualitative study.3
Policy background
Poverty was placed firmly on the political agenda by the recent Labour Government after it was elected in 1997, and in 1999 Prime Minister Tony Blair made the historic pledge to halve child poverty by 2010, and eradicate it completely by 2020.4
This pledge set in motion a series of policies aimed at improving the incomes of families with children and
supporting children from disadvantaged backgrounds to fulfil their potential.
Labour also made steps to improve the way that poverty is monitored and measured. The report Opportunity for All, published in 1999, set out a range of indicators against which progress on tackling poverty and social exclusion at all ages can be measured, stating, ‘there is no one single measure of poverty or of social exclusion which can capture the complex problems which need to be overcome’.5 Opportunity for All
used 59 indicators in total, covering educational attainment in children, health, housing, worklessness, income, adult qualifications and inequality. When the indicators were reviewed in 2007, the data showed improvements on 34 out of the total of 59 indicators since the baseline in 1997 – with seven remaining broadly constant and six showing regression (12 showed no clear trend in either direction).6 In 2009, the
17 Executive summary
election, had the backing of all the political parties.7 Its four
targets (to be achieved by the 2020/21 financial year) were mainly focused around reducing child poverty based on an income measure, but also incorporated a combined measure of low income and material deprivation.
Since coming to power, the Coalition Government has attempted to distance itself from Labour’s approach to child poverty, which it accuses of relying too heavily on income redistribution methods. The accusation that has been levelled against Labour by the current government is that it threw large amounts of money at households just below the poverty line, yielding easy results for minimum effort, but without substantially altering families’ circumstances, or removing the causes of their low income. In November 2010, Deputy Prime Minister Nick Clegg described this approach as ‘poverty plus a pound’, saying that this was ‘simply not an ambitious enough goal’.8 Instead, the Coalition Government
has shifted the debate towards tackling the root causes rather than the perceived symptoms of poverty – though what exactly is classed as a cause and what as a symptom remains the subject of debate.
Since the Coalition Government formed in 2010, there have been several important new developments in the battle against poverty: the publication of the first national Child Poverty Strategy in April 2011, and the publication of two independent reviews commissioned by the Government – the independent review on poverty and life chances by Frank Field MP, and the independent report on early years intervention by Graham Allen MP.9 Drawing on the work of Field and Allen,
the Government then published its Social Justice Strategy in March 2012.
In December 2011, Secretary of State for Work and Pensions Iain Duncan Smith stated that targets set by the previous Labour Government to eradicate child poverty completely by 2020 were ‘set to fail’, arguing that the income-based approach was too narrow. He described income as an imperfect measure of wellbeing, with the latter dependent on a much wider range of outcomes (such as poor health, education,
life chances and family security).10 This sentiment was echoed by
Prime Minister David Cameron, who has repeatedly emphasised family structure and parenting skills as the foundations for opportunity in later life.
At the time, these comments reflected a potential sea change in poverty measurement, which was confirmed when, on the same day that poverty figures for 2010/11 were released in June 2012, showing that the Government had failed to meet its target to halve child poverty by 2010 (the target was missed by 600,000 children), Iain Duncan Smith said that the Coalition Government would seek to develop a new poverty measurement, which would include income but ‘do more to reflect the reality of child poverty in the UK today’.11 This resonates with the
objec-tives behind the model presented in this report – to capture the lived experience. The consultation on this measure is due to be launched at around the same time as this report is published (November 2012), and we hope that the lessons we have learnt in developing this model might inform the Government’s endeav-our. We believe our analysis will act as a way of enriching whatever measure the Government decides on following the consultation process, and we will be submitting this report and its technical appendix, to the consultation to do what we can to help with what will be a challenging undertaking.
Methodology
Our model was created using a five stage process:
· selecting poverty indicators
· analysing the dataset of Understanding Society · verifying the findings with follow-up interviews · developing a toolkit
· testing the analysis at local level
19 Executive summary
· income
· material deprivation · lifestyle deprivation · bills
· access to a car · heating · employment
· subjective financial situation · neighbourhood deprivation · physical health
· mental health
· caring for a sick or disabled child · highest qualification
· neighbourhood support · family support
· participation · politics
· household composition · tenure
· overcrowding
We then used these indicators in a latent class analysis of the Understanding Society dataset (a household panel asking a wide range of questions in all of the areas we needed to include, and covering 40,000 households). This generated clusters of indicators which coexisted most frequently together, thereby creating ‘groups’ of households with similar features.
We only analysed households with less than 70 per cent of median income, and every one of the 15 groups we have created have low income (based on a quantitative measure – though it is important to note that the families we spoke to did not necessarily identify themselves as being on a low income, or in poverty) in common.
We did this as feedback from policymakers, practitioners and the public strongly indicated that low income would always be a central feature of poverty, though not a sufficient way in which to describe it or to inform policies on how to tackle it. We selected 70 per cent of median income as a measure of ‘low
income’ to identify our target group for analysis, as this income benchmark is identified in the Child Poverty Act 2010 as the one used when material deprivation is included. As we were going to match low income with a range of other factors (including material deprivation, and also housing, education and health issues) we felt the 70 per cent income line was more appropriate than the relative 60 per cent income line, which is used in isolation of other factors. We also felt that a 70 per cent income line would give us greater scope to explore the lived experience of those on or just above the relative poverty line.
We followed our quantitative analysis with 30 detailed interviews to verify our findings. Given the constraints of time and resources, we focused our qualitative work on the child poverty groups. We felt the priority placed on child poverty justified our selection of this one cohort over the two others. These interviews were designed to provide a greater insight into the lived experience of these types of poverty, tease out cause and effect, and explore ways in which these groups might be helped.
We used these findings to develop a toolkit – a series of steps designed to guide policymaker and practitioner thinking around each type of poverty (box 1). We designed our model to be used to combat poverty, and the toolkit is an important part of the process.
Box 1 Toolkit
1 Description
The first thing practitioners need to know in order to build a response to one of the types of poverty is what that group ‘looks like’. What combinations of problems are they experiencing? How do they interact? What is the most significant dimension?
2 Identification
21 Executive summary
3 Harnessing existing resources
At this stage, local practitioners and policymakers need to think about what services are already in place to target people experi-encing each type of poverty, and how the dimensions of their pov-erty can be addressed through existing policies and interventions. In some cases, disparate services can be brought together more effectively to tackle multiple and complex needs.
4 Committing new resources
Additional steps may need to be taken to improve people’s quality of life and help lift people in each of the types out of poverty through extra services and interventions, new policies and strate-gies, and changing the allocation of resources.
5 Measuring impact
To find out whether these interventions are having an effect on multi-dimensional poverty types involves more than simply meas-uring income. However, there are outcomes that can be tracked for each type of poverty to show improvement within it, using different sources of data.
The final stage of this project was to assess whether we could replicate our analysis at local level, using local data. Our reason-ing behind this is that local authorities and local charitable organisations are on the coal face of combating poverty, and while our national groups are no doubt instructive to local agencies, their practical value to different local populations is limited.
We therefore worked with Camden, Wirral and Wakefield local authorities to see how well our national groups resonated with the local populations, whether local data were suitable to recreate our analysis and develop bespoke local poverty groups, and whether a local toolkit might be of use to practitioners on the front line.
Findings – types of poverty
We identified five groups living with incomes below 70 per cent of the median income in each of the three cohorts. We gave these
names capturing their defining features. Table 1 lists the groups in order by prevalence. Thus the largest group of families living in child poverty are the grafters, and the smallest are the managing mothers.
Table 1 The groups within the three types of poverty
Child poverty types Working age
without children Pensioner types
Grafters New poor Stoics
Full house families Insecure singles Coping couples
Pressured parents Stressed groups Cheerful grans
Vulnerable mothers One man bands Trouble shared
Managing mothers Empty nesters Left alone
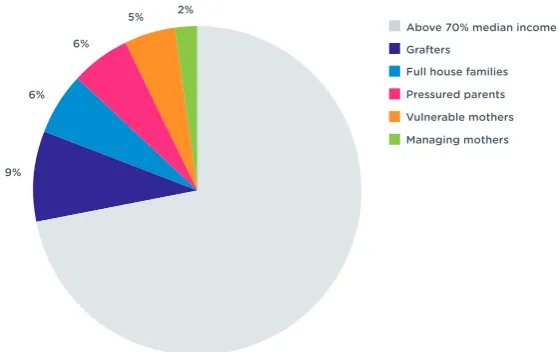
Figure 1 The proportion of the UK population that experiences each type of child poverty
9% 6%
6%
23 Executive summary
Child poverty groups
Figure 1 shows how many households in the UK experience child poverty.
The grafters This group makes up the largest proportion of low-income households with children, and is a combination of three sub-groups:
· the recently redundant
· the self-employed experiencing a drop in income · those with a long work history in poorly paid jobs
(the working poor)
While their employment status differs – they have much else in common: the vast majority of households in this group contain more than one adult, and although they have low incomes, they perform well across the other indicators – for example, they tend to be homeowners, have high levels of qualifications and employment, are not short of material goods, and report that they are coping financially. They live in less deprived neighbourhoods than other groups with low incomes and are likely to be engaged in community activity and politics. They are a far cry from the stereotype of people in poverty tackling multiple social problems, and are instead implementing stringent budgeting tactics in order to get by.
Full house families More than one in five (22 per cent) of families with children and low incomes fit into this group. These tend to be very large households, containing multiple adults and young children. Members of this group are more likely to be from Asian and other minority ethnic backgrounds, many without English as a first language. They are able to heat their homes and are not behind in paying bills, but housing conditions are likely to be overcrowded. Their qualifications range from low to degree level, and their rate of employment is low, with only one or two family members in work. They live in deprived but reasonably supportive neighbourhoods and get more support from families than other groups.
Pressured parents This group accounts for 21 per cent of low-income households with children. Living predominantly in rental properties – more often social than private – these families have a mixed range of low incomes but are extremely deprived on lifestyle as well as material measures. They tend to have poor physical and mental health, low skills and low rates of employment. They are also more likely to be caring for a child with a health condition or disability than other groups.
Vulnerable mothers Just under a fifth of low-income households with children (18 per cent) fall into this group. Group members are extremely likely to be single parents – mostly young single mothers under 24, with babies and/or young children. They are most likely to be renting of all the groups – generally from councils or housing associations. Families in this group are the most deprived in our analysis and are highly likely to lack consumer durables and be behind on bill payments, and have very limited work history in poorly paid jobs. They have the lowest skills of the five groups, and are more likely to be physically and mentally unwell. Despite living in supportive neighbourhoods, they are the most disengaged from community life.
25 Executive summary
Working age households without children
New poor This group makes up over a quarter of childless working-age households. Households tend to contain multiple adults, often headed by people in their 50s. They fare well across the vast majority of indicators: most own their homes, many have a degree, and they report little financial stress, but between half and two-thirds are unemployed. The neighbour-hoods they live in are the least deprived of the poverty groups. It is possible these households might be middle-aged couples with adult children still living at home, who have been made redundant recently or who are self-employed and experiencing a dip in income associated with the economic downturn – similar to the grafters.
Insecure singles This group accounts for just over one in five of all childless, working-age households with low incomes. These are overwhelmingly single adult households, predominantly renting their homes, whether in private or social housing. Members of this group tend to be deprived and lack consumer durables, and are often behind with paying their bills. They report struggling financially, live in the most deprived neigh-bourhoods of our groups, struggle to heat their home, do not have a car and are usually unemployed. They have the lowest skills levels of all of the childless groups and have the highest rates of physical and mental health problems.
Stressed groups Just over one in five childless working-age households are in this group. These households are likely to be non-white British, and are primarily social renters living in the most deprived areas. Almost all contain multiple adults, and are at higher risk of overcrowding and fuel poverty than other groups. Qualification levels vary but employment levels are low, and those in this group are most likely of all childless groups to be behind in paying their bills. These households may well be extended family, blighted by low employment and without the coping strategies associated with those families able to budget effectively and manage on very low incomes.
One man bands This single adult group accounts for 15 per cent
of childless working-age households with low incomes. Their typical profile is non-white British males under 30 who are renting. Although they have some of the lowest incomes and lack material goods, they manage to pay their bills on time and feel they are generally coping financially. Physical and mental health problems are not prevalent in the group, and there is an even spread of qualifications, but more than half of this group are out of work. Although they lack family support, they are active in the community and are politically engaged.
Empty nesters This is the smallest group, accounting for just over one in ten childless working-age households. These single adults are mainly in their 50s with some of the lowest incomes, but they say they are not struggling financially. They are equally likely to be unemployed as to be employed full time. They are comparatively well off in many domains; all own cars, most own their homes and live in less deprived neighbour-hoods, and many have a degree. This group are likely to be either recently early retirees, leaving well-paid jobs perhaps through early redundancy, or divorcees with savings and assets to draw from.
Pensioner types
Stoics This is the largest group, accounting for around a third of pensioners living on low income. The group consists of mainly female pensioners living alone, and contains the oldest pensioners. They lack typical consumer durables, and do not have a car. They also have high levels of physical health problems among pensioners with low incomes. At 48 per cent of the group, their level of home ownership is second lowest of all of these poverty types. They also have the lowest level of family support. Despite their material deprivation and very low income, most report that they are not struggling financially and very few are behind in paying their bills or report struggling to heat their homes.
27 Executive summary
consists mostly of pensioner couples, who have very low incomes, but experience very little material disadvantage (because of their savings and assets). Almost all own their own homes (unmortgaged), and at least one car. They have some physical health issues, but very few mental health issues, are highly qualified and tend to live in the least deprived neigh-bourhoods. They have good, regular contact with their families, and are interested in politics. This group is likely to consist of outgoing, active and articulate couples who have healthy savings as a result of having had good jobs in their working years. However, their very low incomes suggest that (like many older people) they are under-pensioned, which is what places them below the poverty line.
Cheerful grans Around one in five low-income pensioners experience this type of poverty. This group all live alone, and are mostly women. They lack some durables, but – like coping couples – live in less deprived neighbourhoods, and are likely to own their own homes. They are much healthier (mentally and physically) than the other pensioners with low incomes, and are the most likely of the pensioner groups to own a car. They are the second most likely group to have a high level of qualification, and are most likely to say they are living comfortably.
Trouble shared This group accounts for around 18 per cent of pensioners living on low income, consisting of couples who lack some durables and live in more deprived neighbour-hoods. Although their income (like that of comfortable widows) is slightly higher than that of other groups and they are on or around the poverty line, they are more likely to rent (27 per cent of them do). Therefore they have lower disposable income, perhaps explaining why they have greater material disadvantage and report experiencing more financial difficul-ties than others with similar incomes. They also have the second worst mental health of all the pensioner groups. It is likely that those in this group were less able to accumulate assets during their working life (because of lower qualification
levels), and they are less likely to own a car, home and material goods than the ‘coping couples’.
The left alone This is the smallest pensioner group (8 per cent of low-income pensioners). Those in this group live alone and have very low incomes. They are extremely deprived on material and lifestyle measures, and most likely to struggle to pay their bills and keep their homes warm. Along with the stoics, they are most likely to rent, with half renters and half owners. Within the group there are extremely high rates of physical and mental health problems, the highest of all of the pensioner groups. They live in deprived neighbourhoods and, unsurprisingly, report that they find it difficult to cope financially. On the other hand, they also experience the highest level of social support from their neighbours among the pensioner groups.
The implications of these findings
Child poverty
Because of our time and resource constraints, we decided to carry out qualitative research only in the child poverty cohort. This gave us an additional level of insight with which we could develop an overview of a toolkit for each of the five types. These explained how each group might be identified through their service use or appearance on datasets, and how existing resources might be harnessed to help each group before any new resources were committed.
29 Executive summary
We identified the shortage of appropriate and affordable housing for the big families in the full house families group, in places where jobs were easier to find, and discussed the need to invest in the deprived areas in which these families live. Harnessing these families’ dissatisfaction with their local areas could be one way of encouraging community activity. Childcare was also an important service for this group.
We identified social housing providers as key partners in reaching and helping pressured parents. They should be co-opted as a partner in supporting health needs, improving employment outcomes and tackling material deprivation. Joint working opportunities might be to bring adult skills, health outreach and debt and budgeting advice services into social housing locations to help this group tackle their problems on all fronts simultaneously. Improving carer support services, with the objective of improving carers’ own health and facilitating their access to employment, is another key investment priority.
Vulnerable mothers need simultaneous and coordinated delivery on all fronts – health, education, housing, childcare and debt advice – and new investment might best be spent in bringing existing services together or in creating a new combined service, for example, bespoke employment support for those with poor skills and mental health needs, which also offers crèche services. The type of joined-up health, adult education and childcare on offer from children’s centres would be very useful for this group.
Managing mothers find childcare a barrier to working more hours or pursuing job progression, so encouraging employers to link to childcare for older children is one way of joining up thinking to help this group in particular. Using employers to encourage healthy living and mental health (stress, anxiety and depression) support and ensuring wages properly reward managing mothers – who have long work histories and good qualifications but may be working part time – will also be key.
The policy activities we outline for the child poverty groups might be seen as falling into two categories. The first form of intervention is economic, linked to childcare, predistribution to
make work pay, and some more rapid but lighter touch assistance to help well-skilled and experienced groups return to work quickly before their hardship becomes entrenched.
These groups (the grafters and managing mothers, and potentially the full house families) might be deemed the ‘easiest to help’, but in the current policy environment and with limited resources, they are often overlooked by policymakers because they are seen to be ‘getting by’. We would suggest, given the state of the economy, that the Government should not be complacent about these groups’ ability to lift themselves out of poverty unassisted. The ability to ‘get by’ may not last forever, and our findings clearly suggest there is a link between more entrenched poverty and wider social problems.
The second form of intervention is economic and social, requiring multi-agency and whole family support for pressured parents and vulnerable mothers. The complex interaction between cause and effect for these groups on low income makes it very difficult to select one issue to resolve – poor housing might feed poor health, which undermines the ability to work, which exacerbates poor mental health, which in turn lowers job prospects. It is important, therefore, to tackle simultaneously these groups’ multiple and varied problems, which is resource intensive.
Nonetheless, resources have already been committed to undertaking such work with these groups. There is a clear policy focus – not to mention a commitment by most public services and charities – to help the most in need, as a result of prioritising the deployment of scarce resources. We suggest that evidence-based and strategic coordination of existing interventions – which these findings could help guide – will facilitate a more effective use of resources and achieve greater bang for the Government’s buck.
Households without children and pensioner households
31 Executive summary
To draw out a fuller range of policy implications and suggestions for how each type might be tackled it would be necessary to undertake a more robust analysis.
Nonetheless, some early indicators arising from these findings are already interesting – for example, there seem to be similar themes across all three cohorts – at least one newly poor-type group appears in each cohort, as do very similar single and couple households (either both coping better, or both struggling). The same conclusions made about child poverty – the difference between economic and social problems dividing the groups – can be applied to the other two cohorts, and there is a clear division between the ‘copers’ and ‘strugglers’ in facing multiple problems and in their poor resilience in the face of hardship. It seems clear that people’s earlier lives dictate their ability to cope with poverty in the present – their work history, qualifications, earlier income and life experiences all build financial and emotional resilience to low income – and by examining people’s earlier lives it is possible to predict those households not only ‘at risk of poverty’ but also those least resilient and therefore most at risk of the negative effects of poverty.
Employability was a crucial issue for almost all childless households, with four of the five groups having no significant barriers to work other than a difficult labour market
disadvantaging those with less experience or fewer qualifications, or living in areas with scarce jobs. Only one – the insecure singles – could be seen to require substantial help with education, health and housing before they were able to work. This chimes with the fact that childless household poverty is the fastest growing poverty group in the country – with people being pushed below the poverty line because of the economic climate. Although some in these groups have the assets and resilience to cope with a
temporary period of low income before lifting themselves out of poverty, others (particularly those who had hitherto been just above the poverty line) might struggle with a lack of assets, skills and the coping strategies needed to fend off hardship while on very low incomes. Given the state of the
economy and sluggish labour market, the Government should again not entirely overlook those groups who may be ‘coping’ – for now – with their low incomes, but consider different types of support needed that focus on economic rather than social needs per se.
For the pensioners on low income, we can distinguish between those with low incomes but higher assets, which are currently protecting them from the excesses of deprivation and hardship; those with some material deprivation but who are coping; and those with significant deprivation who are not coping well at all. These also seem to correlate with decreasing levels of physical and mental health. It will be important to ensure that those currently doing better than other groups are able to delay hardship and poor health through healthy ageing and financial products to protect their assets or sustain their incomes into later old age. Simply increasing the income of the more vulnerable groups will be insufficient, and tackling health and housing issues are perhaps – for this cohort – more important.
The challenges of local data
In section 2 we reflect on the way in which poverty has been tackled at local level. In the past local authorities have been charged with carrying out programmes requiring local joint working and information sharing. These include Total Place and family intervention projects, most recently the troubled families agenda and the Child Poverty Strategy.
33 Executive summary
by using a narrower set of the most important indicators, which we identify in chapter 3.
Nonetheless, even with a narrower and more
manageable range of indicators, the collection and matching of data to identify specific households is phenomenally difficult. On the practical side, local datasets are very rarely broken down to household level. They might variously be borough wide, at ward level, at super-output level, or at postcode level, and matching these different sets of data to any common level – let alone to household level – is almost impossible without a significant amount of resources. Yet such an exercise is a central tool of almost everything local authorities try to do – from combating poverty and other social problems to better targeting their services and commissioning strategies.
Even if this endeavour were practically possible
(and we describe in chapters 6 and 7 some impressive attempts to achieve this level of household level understanding), local authorities are often thwarted by data protection and data-sharing regulation. In order for organisations to share data that enable another organisation to identify their subjects, consent must be given by those subjects. This makes the sharing of data to identify households very difficult, as consent is hard to get after (sometimes years after) the information has been collected.
However, the Social Justice Strategy, identifying the need to tackle troubled families at local level, has paved the way for overcoming data-sharing problems. In the Welfare Reform Act 2012 the Government changed the legislation to allow the Department for Work and Pensions (DWP) to share its data on benefits claimants with local authorities, with the express purpose of identifying troubled families.
Local practitioners have been requesting this
information from the DWP for years in order to tackle local issues, often related to poverty, but their requests had been refused. Now that the Government has changed the law in this one instance, it is possible that further opportunities for similar sharing might arise. Our findings suggest that such
data sharing is vital if local authorities are to tackle poverty effectively. A lack of household level data is a fundamental obstacle to multi-agency working to help families in poverty, and the Government cannot expect to meet national poverty targets while local authorities are stymied by poor data and obstructive data-sharing rules.
The findings from our pilots
In the absence of local data at household level covering all 20 of our indicators, we established a local methodology in order to identify local groups on low income, marrying available data with our national analysis.
To do this, with the help of the local authorities of Camden, Wirral and Wakefield, we gathered all of the data available relating to as many of the 20 indicators in our poverty model as possible, and identified the indicators which seemed particularly problematic for the area (for example, much higher than average sickness benefit claims; much higher than average overcrowding). We then compared these flagged indicators with our poverty groups and isolated where there was the largest overlap.
For example, if local authority A has:
· small households with single parents · problems of social isolation
· high rates of mental health problems · mixed skill rates and mixed labour market
it is likely that local authority A will have managing mothers in the area.
The limitations of this approach means we can only state that local authority A is likely to have managing mothers, and we do not know if it has predominantly managing mothers or if it has a low-income group that is wholly different from all of the national average groups we have identified.
35 Executive summary
groups we thought would be common locally (based on local data) ‘sounded like’ the types of families they encountered and helped daily.
We then refined further these local types with these stakeholders’ insights before using them to develop local toolkits – suggesting ways in which such groups might be identified, targeted and helped with existing and new local resources and joint working, based on the toolkit model outlined above.
This process gave us invaluable insights into how local authorities currently work to tackle poverty – we saw at first hand the challenges associated with matching local data, and found most the data available were from the 2001 Census or other out-dated studies, and that often this provided borough-wide averages. In spite of this, we heard of pioneering ways in which local authorities were overcoming these challenges by developing small-scale data collection projects as well as comprehensive matching strategies to provide as detailed an insight as was possible with the data available. We also heard of several instances of multi-agency working, between health, education, housing and children’s services, and across the statutory and voluntary sectors, where it was recognised that these agencies were supporting the same families and an opportunity to reduce duplication and coordinate efforts arose. Nonetheless, it was clear that an evidence-based strategy to guide a more systematic approach to joint working and information sharing would be the best way for local authorities to tackle local poverty and the wide range of social problems connected to it.
While replicating our national analysis would be beyond the reach of most local authorities because of the limitations of local data and data sharing, we realised that local authorities could follow the process we undertook in the local pilots – bringing together different local data sources, matching them to national groups and then using the policy and practice insights described in this report to guide local thinking on how to help different local groups on low income. Moreover, this could be achieved using a less comprehensive range of
indicators: instead of attempting to gather data across the full 20 indicators we have used – which might be a challenge – local authorities could use a smaller group of ‘key indicators’, identified as the most prominent in our quantitative analysis and highlighted through our qualitative analysis. These could then be verified using local authorities’ own investigations with front-line practitioners in the statutory and voluntary sectors.
This more limited process would still generate valuable local insights to create a local toolkit, which would in turn make more effective use of ever more limited resources by reducing duplication of effort and highlighting the most effective ways of tackling poverty. It would also raise aware-ness of poverty as a multi-faceted problem: rather than poverty being one organisation’s responsibility, a toolkit could create a sense of joint ‘ownership’ of tackling poverty locally, with each agency – from the GP to the nursery to the urban planner – recognising they have a role to play.
Conclusions and recommendations
This project sought to create a new model to analyse poverty in a multi-dimensional way, which would be helpful to encourage policymakers and practitioners to move from a one-size-fits-all approach (usually focusing on improving income) to a more nuanced and multi-faceted approach – based on the lived experience of people actually on low income. The model is an entirely new way of understanding poverty, and is in itself of as much interest as the findings it has generated.
Recommendations
37 Executive summary
identified in our analysis as having multiple social problems and entrenched low income require substantial and resource intensive help. Nonetheless, policymakers cannot overlook those groups that appear to have fewer disadvantages, for example, the ‘recently poor’ groups (new poor and some of the grafters), as targeted and timely intervention might prevent those in these groups from developing a wide range of social problems. Our analysis suggests that a short-term response and longer-term ‘invest to save’ strategies are both needed.
Second, we recommend that the model itself is given careful consideration by national policymakers as they consult on a new multi-dimensional measure of poverty. This model, and the process we went through to develop it, will be instructive to teams in the DWP and Child Poverty Unit as they develop their own measure. We believe our analysis will be compatible with and act as a way of enriching the measure the Government decides on following the consultation process.
Third, we urge the Government to help local authorities tackle the problems they encounter with the collection and sharing of local data. Many local authorities and practitioners felt the funding to assist them with this had been
discontinued, which was thwarting their attempts to tackle a range of social and economic problems. As greater
responsibility is passed to local authorities for the wellbeing of their local populations, the Government must ensure the infrastructure is in place to enable them to do this. A central plank of this infrastructure is a databank providing a clear understanding of the nature and scale of local problems in order to inform strategy. Currently, the Census provides the most comprehensive source of data for local authorities on their local populations, and in our pilots the 2001 Census was often the most up-to-date source available for comparing local areas’ performance across the majority of our poverty
indicators. People we spoke to in many local authorities throughout our research were awaiting the next wave of Census results, which is being released in stages over the next year.12 This will provide all local authorities with recent data
relating to a wide range of poverty indicators, but
confidentiality prevents personal information or addresses being disclosed, making it difficult to use as a means of combating poverty at household level.
Fourth, and related to our third recommendation, we suggest that the Government should use the Welfare Reform Act 2012 data-sharing powers related to troubled families as a test run to help local authorities tackle child poverty. We recognise that troubled families are a priority, given the resource intensive nature of the support they require.
Nonetheless, it is important to remember that troubled families belong in a wider in-poverty population, that poverty
underpins these families’ difficulties, and that other groups on low income need assistance too. Without the tools to identify these households, local authorities will be unable to provide the early help needed to prevent the disadvantage of these families becoming entrenched and national child poverty targets will remain out of reach.
39
41 Poverty in perspective
Renting Low
participation material goodsLacking householdsLone adult
Carer for a child
Low income
Physical ill health
Disinterest in politics
Overcrowding
Low/no
employment povertyFuel Mental
ill health neighbourhoodDeprived Financial worries Behind
on bills car accessLimited family supportLack of Low/no
qualifications deprivationLifestyle
Lack of neighbourhood
support
43 Poverty in perspective
Child poverty – Grafters
This group makes up the largest proportion (31 per cent) of families in poverty.
The vast majority of households in this group contain more than one adult. Households in this group have low incomes but perform well across the other indicators. They tend to be homeowners, have high levels of qualification and employment, are not short of material goods, and report that they are coping financially. They live in the least deprived neighbourhoods and are likely to be engaged in community activity and politics.
The poverty types
This research aims to improve our understanding of the different ways that people experience poverty – and the different combinations of factors that are involved in these different experiences.
By looking at the interaction between 20 separate indicators (spanning health, education, housing, social and material resources), our analysis has identified 15 main ‘types’ of poverty that are experienced in Britain today, across three separate life stages: families with children, childless working age adults, and pensioners.
Developing this understanding of the combinations of features that occur in low-income households is not just an academic exercise – it can help drive a better response to poverty by improving our understanding of the ways that people experience poverty by examining their lives as a whole, and providing an evidence base for bringing different services together to tackle poverty more effectively, rather than treating separate issues in isolation.
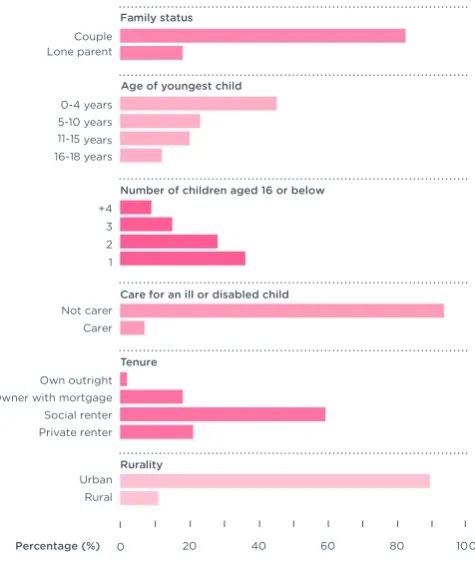
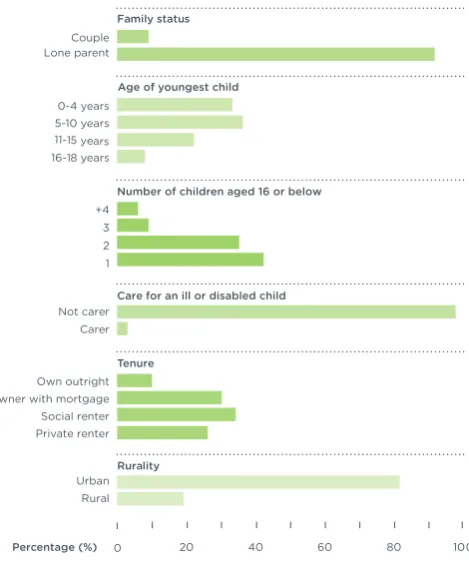
Guide to reading the graphics
The graphics contained in this section give an overview of each of the 15 poverty types in turn, grouped according to the three life stages that we examined (working age parents, working age non–parents and pensioners). Each graphic shows how that particular group experiences all 20 of the dimensions of poverty, to give an overall impression of their lives. The sample diagram below explains how to read the information contained in the graphics.
· The ring of indicators corresponds to the 20 poverty dimensions (see overleaf).
· Each of the bars extending outwards shows how strongly associated each indicator is with that poverty type. A longer bar indicates a stronger association.
45 Poverty in perspective
Child poverty – Pressured parents Child poverty – Full house families
Just over one in five families in poverty (22 per cent) fit into this group.
These tend to be very large households, containing multiple adults and young children. Members of this group are more likely to be from Asian and other BME backgrounds, many without English as a first language. They are able to heat their homes and are not behind on bills, but housing
conditions are more likely to be overcrowded. Their
qualifications range from low to degree level, but their rate of employment is low, with only one or two family members in work. The live in deprived but reasonably supportive neighbourhoods, and get more support from families.
This group accounts for just over one in five (21 per cent) of families in poverty.
47 Poverty in perspective
Child poverty – Managing mothers Child poverty – Vulnerable mothers
Just under a fifth of families in poverty (18 per cent) fall into this group.
Group members are extremely likely to be single parents – mostly young single mothers under 24, with babies and/or young children. They are most likely to be renting – generally from councils or housing associations. Families in this group are the most deprived and are highly likely to lack consumer durables and be behind on bill payments. They are also the most likely to want, but not be able to afford, to make regular savings. Despite living in supportive neighbourhoods, they are the most disengaged from community life on other indicators, such as political engagement and community participation.
This entirely single-parent group makes up the smallest proportion of poor families (8 per cent of the total).
49 Poverty in perspective
Working age without children – New poor Working age without children – Insecure singles
This group makes up over a quarter of childless working age households.
Households tend to contain multiple adults, often headed by people in their 50s, though there are also some under 30s. They fare well across the vast majority of indicators. Most own their homes, many have a degree, and they report little financial stress. The neighbourhoods they live in are both the least deprived and the least supportive, and this group scores low for participation.
This group accounts for just over one in five of all childless, working age households in poverty.
51 Poverty in perspective
Working age without children – One man bands Working age without children – Stressed groups
Just over one in five childless working age households are in this group.
These households are more likely to be non-White British, and are often social renters. Almost all contain multiple adults, and they are at higher risk of overcrowding and fuel poverty. Qualification levels vary in this group but employment levels are low, and households struggle to pay bills or to afford some goods. They have reasonable physical health, but are much more likely to have a mental health condition. While both neighbourhood and family support networks are strong, group members tend towards low participation and have little interest in politics.
This single adult group accounts for 15 per cent of the childless working age lifestage.
53 Poverty in perspective
Pensioner poverty – Stoics Working age without children – Empty nesters
This is the smallest group, accounting for just over one in ten childless working age households.
These are single adults with some of the lowest incomes, but they are not struggling financially. They are equally likely to be unemployed as to be employed full-time. They are comparatively well off in many domains; all own cars, most own homes and live in less deprived neighbourhoods, and many have a degree. What they lack in neighbourhood support they make up in frequent contact with their families and community participation.
This is the largest pensioner poverty group, accounting for around a third of pensioners living in poverty.
55 Poverty in perspective
Pensioner poverty – Cheerful grans Pensioner poverty – Coping couples
This is the second largest pensioner group (23 per cent of low-income pensioners).
This groups consists mostly of pensioner couples, who have extremely low incomes, but experience very little disadvantage. They are likely to own their homes, and at least one car. They have some physical health issues, but very few mental health issues, are highly qualified and tend to live in the least deprived neighbourhoods.
Around one-in-five low-income pensioners experience this type of poverty.
57 Poverty in perspective
Pensioner poverty – Left alone Pensioner poverty – Trouble shared
This group accounts for around 18 per cent of pensioners living in poverty.
This is a group consisting of pensioner couples – they are lacking some durables, and live in more deprived
neighbourhoods, where they are more likely to own their home than rent. They report experiencing financial difficulties, and have some physical and mental health problems.
This is the smallest pensioner poverty group (8 per cent of low-income pensioners).
59
SECTION 1:
61
1
Policy background
Introduction
Poverty is the most pressing social problem of our time. It is widely recognised that millions of people in the UK today have a poor quality of life, poor housing, few job prospects and little or no protection from the financial shocks which are all too common in the current economic climate, such as redundancy or increases in fuel or food prices. Policymakers also recognise that millions of people suffer from poor educational and health outcomes, and a wider problem of poor life chances. And yet, while no one denies the scale or seriousness of the problem, few agree on how to define it. These problems have variously been defined as poverty, inequality, social exclusion, life chances and other terms – which have only served to undermine the coherence of policies and strategies to tackle them.
Rather than seeing these various social problems as part of a larger, interrelated whole, policymakers have in the past attempted to address one or two of these issues within specific departmental remits.
The current government, having launched the Field review of poverty and life chances, Graham Allen’s review of early intervention, and the Social Mobility Strategy, seems to be pursuing a similar course of action.13 Yet this approach
may leave many individuals and families – particularly those experiencing multiple disadvantages – with disjointed and ultimately ineffective support. It also fails to recognise that the whole is greater than the sum of its parts – that the combination and interaction of several forms of disadvantage is an important phenomenon in and of itself, which cannot be tackled by addressing one of the other component disadvantages in isolation.
63 Policy background
description. Of all the terms in use, ‘poverty’ is perhaps the broadest and most accessible. However, poverty itself is a problematic concept. While several attempts have been made to define and measure it, no single, universally accepted definition has emerged, nor consensus on how it should be measured.
As a result, poverty in the UK is defined and talked about differently by different political traditions at different times – but it is overwhelmingly focused on a measure of income. We know that around 10 million people – around a sixth (16 per cent) of the population – in the UK live in households with below the 60 per cent low-income threshold before deducting housing costs, which is the widely accepted level of poverty in the UK today. There are around 2.3 million children growing up below the poverty line before taking into account housing costs.
Yet this narrow approach has a number of disadvantages. The lived experience of those on low income is much more than a monetary phenomenon. It is a complex, multi-dimensional experience, which involves people’s health, housing, educational and social opportunities, and other factors. As outlined above, some of these will be recognised in isolation as part of the life chances or social exclusion agendas, but it is the cumulative experience of multiple aspects of poverty that has the greatest impact on people’s quality of life. Therefore a definition based on income alone is far too narrow, and as a result, is likely to:
· underestimate the full impact of poverty in the UK on people’s wellbeing and quality of life
· fail to recognise different forms of poverty – which may include low income, but may be exacerbated by other factors (for example poor health) – and the cumulative impact of several forms of disadvantage that a person might experience · treat those defined as ‘in poverty’ as a homogenous group,
rather than considering sub-groups whose members may be facing multiple disadvantage and may therefore find it more difficult to escape poverty
· critically limit the way in which poverty is addressed – a narrow, income-based definition will inevitably result in a narrow, income-based solution
Our review of evidence, the findings of which were published in our report 3D Poverty,14 suggests that this last
point has been particularly problematic, as the most obvious income-based ‘solution’ to poverty – employment – has led to an increase in in-work poverty with fewer attempts to ensure that those in low-paid and low-skilled jobs can improve their position through improving skills, financial capability, housing stability and so on, or to boost wages relative to living costs. Again, this demonstrates how policymakers tend to separate a particular aspect of the problem (low income) and address it in isolation, critically undermining its effectiveness in alleviating poverty as they overlook other closely related issues.
The predominant income-based definition of poverty has an additional weakness – it is poorly understood by the public and policymakers. As our primary research with the public demonstrated, the definition of poverty as applying to those who have ‘below 60 per cent of median income’ cannot be translated into real-life circumstances or visual-ised. In short, while families recognise when they are struggling financially, few people understand what having less than 60 per cent of median income, and therefore being technically ‘in poverty’, involves in real life. Therefore people in those groups which are in poverty (according to the 60 per cent measure) may not be easily identified by the front-line practitioners or third sector organisations set up to help them.
This report is the culmination of a stream of work which began with the publication of 3D Poverty in 2010.15 This report
explored how the public and policymakers perceived the current way in which we measure poverty in the UK, the level of understanding of the relative and absolute poverty lines, and opinions of other measures that are already available in the UK (for example material deprivation, social exclusion and disadvantage measures) as well as multi-dimensional measures of poverty used in other countries.
65 Policy background
sufficient to develop policies to tackle poverty. We realised there remained a significant gap in the field for an accessible and usable analytical tool to understand poverty – one that:
· recognises the importance of multiple dimensions of poverty and the fact that they interact with one another at a household level, to either mitigate or exacerbate the negative effects of poverty
· is easily understood by the public, policymakers and practitioners because it resonates with ‘real life’ – it can be easily visualised as different lifestyles, rather than an abstract or numerical concept
· most importantly, can be used to help create a tool to combat poverty
This report presents such a model, which Demos and NatCen have been developing for over a year. This new model is unlike other multi-dimensional measures and analyses, in that we have applied a set of 20 indicators to a large household panel survey (Understanding Society: The UK Household Longitudinal Study, covering 40,000 households) and identified which combinations of indicators cluster most frequently together. We are not redefining poverty, or measuring it in a new way. Instead, we are applying a new model of analysis to the low-income population (using the existing income-based poverty line) to better understand the lived experience of poverty and generate new insights into how to tackle it. We are now able to describe 15 distinct types of poverty, characterised by a unique interaction of 20 indicators, across three cohorts: households with and without children, and pensioner households.
We have also developed a new website to present our findings in a more accessible way, which can be found at www.demos.co.uk/poverty/index. NatCen’s report Exploring
Multi-Dimensional Poverty: A research methodology to create poverty typologies presents in greater detail the findings from
the quantitative analysis of Understanding Society and the related qualitative study.16
Before presenting the findings of this analysis and the implications for policy and practice, we begin with a brief overview of the policy background in which we began our work, and which has developed over the course of this project.
Poverty trends
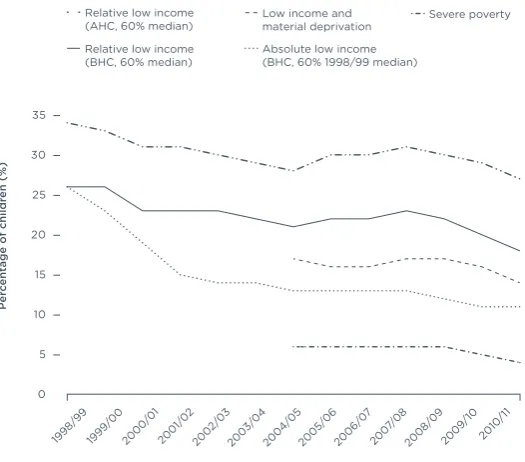
Despite rising slightly immediately before and during the 2008 recession, poverty – particularly child poverty, defined as poverty in a household where a child or children are living – has generally been falling in recent decades. Box 2 explains the poverty thresholds used most widely by the UK Government.
Box 2 The poverty thresholds
The poverty line most widely used by the EU, the UK Government and politicians is 60 per cent of the median in-come before taking into account housing costs. Therefore, when people talk about the number of people in poverty they are usually referring to the population who live on incomes below this line.
However, there are several other lines also in use to provide additional insight – for example, the measures 70 per cent and 50 per cent of the median income are also used, as are lines before and after taking into account housing costs to identify disposable income. This has changed over time, with different definitions of relative poverty being used. The com-monly accepted definitions were, until recently:
· relative income poverty: households living below 60 per cent of median income, before taking into account housing costs · absolute income poverty: households living below 60 per cent
of the median income in 1998/99, uprated each year in line with prices
67 Policy background
[image:35.680.40.290.148.368.2] [image:35.680.380.643.172.403.2]median income in 2010, uprated each year in line with prices. In 2010, the relative and absolute poverty lines in the UK were the same. The Child Poverty Act also introduced a further line when assessing the level of child poverty: ‘A combined income and low-income benchmark: households living below 70 per cent of the median income and in material deprivation.’
Figure 2 Poverty trends for UK population, 1998/9 – 2010/11
financial crisis of 2008, levels of poverty rose – since 2008/09, relative poverty has fallen for three consecutive years.
Successive governments have made the focus of their efforts to combat poverty eliminating child poverty, which measures the number of children living in households below the 60 per cent of median income threshold, and it is worth a separate exploration of figures relating to child poverty (see figure 3).
Source: DWP, Households Below Average Income, 2010/11 17
Figure 2 shows how income poverty has changed in recent years. The number of individuals classified as living in poverty rose dramatically from the mid-1980s, peaking in the early 1990s before beginning to decline. Between 1997/98 and 2004/05, the Labour Government under Tony Blair is credited with overseeing the longest year-on-year decline in poverty since the Institute for Fiscal Studies (IFS) consistent time series began in 1961.18 In the three years approaching the
Source: DWP, Households Below Average Income, 2010/11 19
69 Policy background
Digging below these figures to explore the characteris-tics of those families experiencing poverty reveals that the number of children in poverty living in households where at least one adult member is in work is increasing. The Joseph Rowntree Foundation’s Monitoring Poverty and Social
Exclusion series for 2008/09 20 found that, for the first time,
more than half (58 per cent) of all children in poverty were living in households where at least one adult was in work – despite unemployment rising over the same period. This proportion has continued to rise and by 2010/11 had reached 61 per cent.21
This is a worrying figure for the Coalition Government, whose rhetoric around work and poverty suggests that the two are mutually exclusive. However, in March 2012, a report published by the Building and Social Housing Federation showed that 93 per cent of new Housing Benefit claims made between January 2010 and December 2011 were made by households where at least one adult was in work (279,000 out of 300,000 extra claimants).22 This suggests that the
Government will be unable to reduce the welfare bill simply by moving more people into work.
In other groups, there has been a significant decline in pensioner poverty over the past few years, which is now at its lowest level since 1984, following a sharp rise during the late 1980s. In 2010/11, 2 million pensioners were living in poverty before taking into account housing costs (17 per cent), and 1.7 million after taking into account housing costs (14 per cent).
The group that has fared least well is working-age adults without dependent children. Relative poverty among this group has been creeping up over time, and in 2009/10 reached its highest level ever recorded (since 1961). Relative poverty levels among childless adults of working age
remained broadly unchanged in 2010/11, showing only a very slight decrease on the previous year. In 2010/11, there were 3.3 million working-age adults in poverty before taking into account housing costs (14.6 per cent) and 4.5 million after taking into account housing costs (19.7 per cent).23
The poverty outlook
Despite recent falls in the number of people living in poverty, there is some concern that current government policies will have the effect of pushing more people into poverty in the medium and long term. A study carried out by the IFS, looking ahead over the next decade to forecast levels of child and working-age poverty, predicted that relative child poverty would fall in the short term before rising in 2012/13 and continuing to rise to reach 24 per cent in 2020/21.24 This
suggests that the Government is likely to miss the relative child poverty target specified in the Child Poverty Act (10 per cent by 2020/21) by a considerable margin.
The IFS’s analysis