Effects of blasting on the stability of paste fill stopes at Cannington Mine
29
0
0
Full text
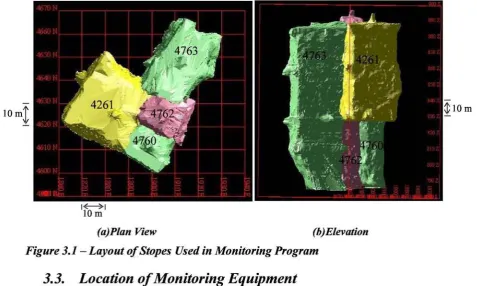
(2) Chapter 3 - Monitoring of Stope 4261 During Nearby Blasting. 3. Monitoring of Stope 4261 During Nearby Blasting 3.1.. General. A monitoring program was put into place at Cannington Mine to measure the velocities experienced in a backfilled stope during extraction of adjacent secondary stopes. Stope 4261 was chosen for this monitoring program. The stope had been backfilled with a combination of rock and paste fill after its extraction. The paste fill consisted of 76 % solids and 3.8 % cement. The rock pieces were found to be concentrated towards the centre of the stope and almost non existent towards the edges of the stope. Stope 4261 is 60 m high, 30 m wide and 30 m long and extends from thy 375 m level down to 425 m level. One secondary stope adjacent to 4261 had been mined and backfilled prior to monitoring program.. This was stope 4762, which had. dimensions of 15 m wide by 15 m long by 100 m high, and extended from 375 m level to 475 m level. A horizontal tunnel was excavated two thirds of the way through stope 4261 at the 400 m level, which was at the mid height of the stope. Monitoring equipment was installed in boreholes drilled from this tunnel. Stope 4261 was monitored during blasting of adjacent stopes 4760 and 4763. Stope 4760 had dimensions of 100 m high, 15 m wide and 15 m long and extended from 375 m level to 475 m level. Blasting occurred in 8 stages between the 14th September and 9th October 2001. Stope 4763 had dimensions of 104 m high, 30 m wide, 27.5 m long at the base and 36.5 m long at the top and extended from 375 m level to 475 m level. Blasting occurred in 8 stages between during May 2002. The positions of stopes 4760, 4261, 4762 and 4763 relative to one another can be seen in Figure 3.1 and plans ofthe stopes are given in Appendix A.. 3.2. Monitoring Equipment Used The monitoring program involved the installation of 5 triaxial geophones in the backfilled stope 4261. During blast events, the geophones were connected to a Blastronics BMX Blast monitor. Triaxial geophones measure velocities in three directions, which are perpendicular to one another. The velocity at that point can then be obtained by calculating the vector sum of these velocity records. Upon the complete extraction of each adjacent stope, the inside of the cavity was scanned and input into a computer program which was used to provide an accurate representation of the size of the cavity. The volume of paste fill which failed during the removal of the secondary and tertiary stopes was calculated from this information.. 25.
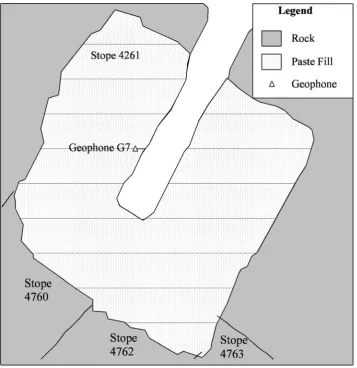
(3) Chapter 3 - Monitoring of Stope 4261 During Nearby Blasting. ~lOm. lorn!. (a)Plan View. (b)Elevation. Figure 3.1 - Layout ofStopes Used in Monitoring Program. 3.3. Location ofMonitoring Equipment A total of 5 triaxial geophones were installed from boreholes drilled from a tunnel that was excavated 20 metres into the paste fill stope 4261. A borehole was drilled from the end of this tunnel towards the adjacent rock at an angle of 33° to the horizontal. Four triaxial geophones, G3, G4, G5 and G6, were positioned in this borehole, as shown in Figure 3.2. The fifth geophone, G7, was installed in a borehole drilled into the side wall of the tunnel, as shown in Figure 3.3. As can be seen, geophone G3 was installed in the rock, while the remaining geophones were installed in paste fill. The distances of G3, G4, and G5 from the end of the drive are shown in Figure 3.2.. 3.4. Type ofExplosive Used in the Production Blasts The emulsion type explosive Powerbulk VE, at a density of approximately 1.0 g/cm", was used in the production blasts at Cannington Mine. Powerbulk VE is a primer sensitive bulk emulsion explosive that has been designed for used in underground blasting applications. Powerbulk VE is a fluid with a viscosity similar to that of heavy grease. It is pumped into boreholes and can be used for boreholes of up to 35 m length. The explosive can be detonated using either a primer or a Powergel packaged explosive cartridge in conjunction with a detonator. Information about this explosive, which was supplied by Orica, is given in Table 3.1.. 26.
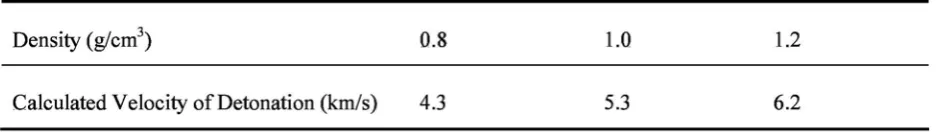
(4) Chapter 3 - Monitoring of Stope 4261 During Nearby Blasting. Table 3.1 Properties of Powerbulk VE. Calculated Velocity of Detonation (km/s). 0.8. 1.0. 1.2. 4.3. 5.3. 6.2. 3.5. Events Monitored Monitoring data was collected during the blasting of stopes 4760 and 4763. The blast events for which occurred during this blasting and the blast events for which monitoring data was available for analysis is discussed in this section.. 3.5.1.. Stope 4760. Stope 4760 is a secondary stope with two paste fill exposures. The first paste fill exposure is stope 4261, which is to the west, and involves an exposure between the 375 m level and the 425 m level. The second paste exposure, stope 4762, is to the north, and extends from the 375 m level to the 475 m level. Stope 4760 also extends from the 375 m level to the 475 m level.. Legend 1 :1 Paste Fill. I ;:i;;g~~l Paste Fill with ----- Rock Fragments. H@mml ~:=: i~~;ith Fragments DRock /::,.. Geophone. Figure 3.2 - Location of Geophones G3 to G6. 27.
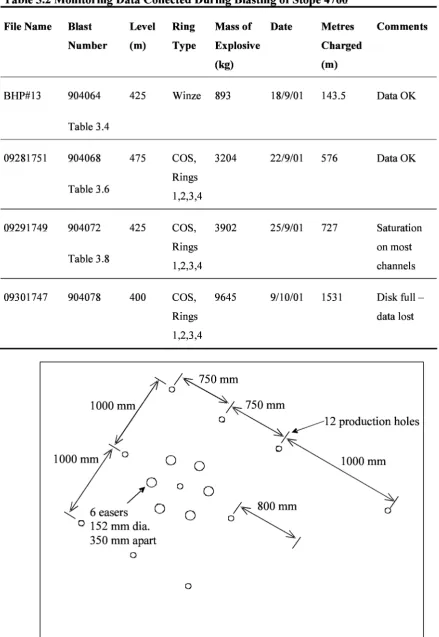
(5) Chapter 3 - Monitoring of Stope 4261 During Nearby Blasting. .::~~~~~:~:~:~:~:~:~::::::::::::::: ~. Legend. ... r1.. Stone' A26 1. :. :::: y::. l V. r! \. j. t-. ~! /. ::. I. "". Q. j. /. /. D. Rock. D. Paste Fill. r-,. b.. Geophone. ~. /. •. l. .~. Stope 4760. ..... l. .>u •. "". /. /. ~. Stope 4762. "<\ ""::::::::. ). Stope 4763. Figure 3.3 - Location of Geophone G7 Blasting was carried out over a 3 liz week period, with a total of 8 separate blast events. Table 3.2 lists the blast events for which data was collected. Blast plans and delay times for these events are given in Appendix B. The ring types given in Table 3.2 refer to the different types of blast hole patterns used in the production blasts that were monitored. The following three types of blast hole patterns were used in the production blasts that were monitored: •. Winze The winze is a vertical shaft that is excavated at the beginning of the mining sequence for a given stope.. The winze monitored in this production blast consisted of 12. production blasts with a 69 mm diameter and 6 easers with a 152 mm diameter. The easers are boreholes drilled into the rock to allow room for the crushed rock to expand into during blasting. The layout of the winze blast monitored for stope 4760 is shown in plan view in Figure 3.4. All blast holes were vertical.. 28.
(6) Chapter 3 - Monitoring of Stope 4261 During Nearby Blasting Table 3.2 Monitoring Data Collected During Blasting of Stope 4760 File Name. BHP#13. Blast. Level. Ring. Mass of. Number. (m). Type. Explosive. Charged. (kg). (m). 904064. Metres. Date. Comments. 425. Winze. 893. 18/9/01. 143.5. Data OK. 475. COS,. 3204. 22/9/01. 576. Data OK. 3902. 25/9/01. 727. Saturation. Table 3.4 09281751. 904068. Rings Table 3.6. 09291749. 904072. 1,2,3,4 425. COS,. Table 3.8. 09301747. 904078. 400. Rings. on most. 1,2,3,4. channels. COS,. 9645. 9/10/01. Rings. 1531. Disk fulldata lost. 1,2,3,4. ~/~m ~. 750mm. o ~. v. >uU>. ~At. o o /0 o o <, 6 easers 0 o o 152 mm dia.. 12 production holes. o. 1000 mm. 1000 mm. a. 350 mm apart. o o. o Figure 3.4 - Winze Blast Hole Layout/or Stope 4760. 29.
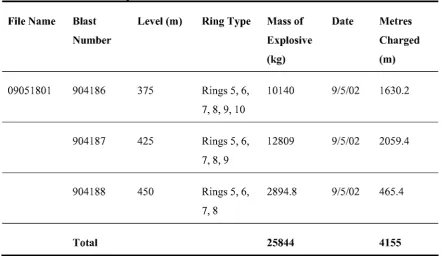
(7) Chapter 3 - Monitoring of Stope 4261 During Nearby Blasting. • cos The COS blast pattern consisted of rows of vertical blast holes with a diameter of 89mm. •. Rings The ring blast pattern consisted of a set of blast holes drilled in a radial pattern. The blast holes in the rings had diameters of 76 mm for rings close to the paste fill face of stope 4760, and diameters of 89 mm for the rings in the main body ofthe stope.. 3.5.2.. Stope 4763. Stope 4763 is a secondary stope with one paste fill exposure composed of fill masses from stopes 4261 and 4762, on the south side. The paste fill exposure of stope 4261 involves an exposure between the 375 m level and the 425 m level while the paste fill exposure of stope 4762 involves an exposure between the 375 m level to the 475 m level. Stope 4763 extends from the 375 m level to the 475 m level. Blasting was carried out with a total of8 separate blast events. The southern most rings were fired together from the bottom up, allowing the paste to be exposed last to reduce the chance of damage to the paste fill mass. Data was collected during the firing of the southern main rings between the 475 m level and the 375 m level. This blast involved approximately 30000 kg of emulsion explosive installed in 89 mm boreholes. Table 3.3 lists the details of this blast event. Blast plans and delay times for these events are given in Appendix C.. Table 3.3 Details of Stope 4763 Blast Event Monitored File Name. Blast. Level (m). Ring Type. Number. 09051801. 904186. 375. Rings 5, 6,. Mass of. Date. Metres. Explosive. Charged. (kg). (m). 10140. 9/5/02. 1630.2. 12809. 9/5/02. 2059.4. 2894.8. 9/5/02. 465.4. 7,8,9, 10 904187. 425. Rings 5, 6, 7,8,9. 904188. 450. Rings 5, 6, 7,8. Total. 25844. 4155. 30.
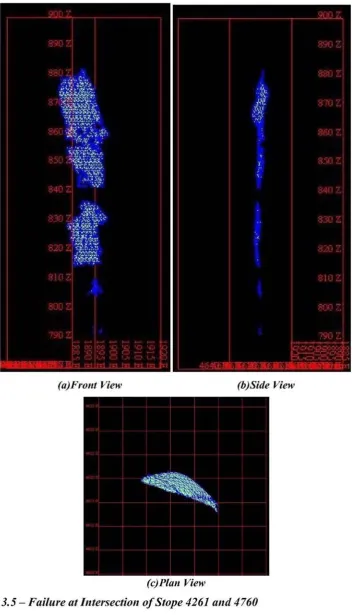
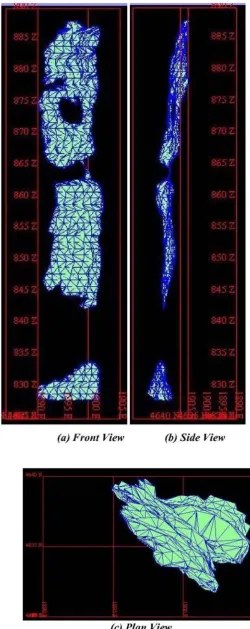
(8) Chapter 3 - Monitoring of Stope 4261 During Nearby Blasting. 3.6.. Collected Data. Each geophone recorded a set of 3 velocity versus time profiles for each blast event that was monitored. The overall velocity profile for each geophone was obtained by calculating the vector sum ofthese three records.. 3.6.1.. Stope 4760. Records were collected for all 5 geophones during the first 3 blast events for stope 4760 listed in Table 3.2. However, the monitor failed to record the data for the fourth blast event, blast number 904078, as the disk on the Blastronics BMX blast monitor was full. The velocity profiles measured during each blast are given in Appendix B. 3.6.2.. Stope 4763. The geophones were tested prior to blasting stope 4763. During this test, geophones G3 and G4 tested dead. These geophones were the closest geophones to the blast of stope 4760, and were most likely to be damaged during the blast. As a result, velocity records for only geophones G5, G6 and G7 were recorded during the southern main ring blast of stope 4763. Results consisted of an 11000 ms duration sample for G5 (sample interval 200 us), a 2750 ms duration sample for G6 (sample interval 50 us), and an 1100 ms duration sample for G7 (sample interval 20 us). The distance between the geophones and the main ring ranged between 19 m and 83 m.. 3.6.3.. Volume of Stopes. In addition to the blast records, the cavity of each stope was scanned. The volume of paste fill. that failed was determined by comparing the cavity extracted for each stope. These volumes are shown in Figure 3.5 and Figure 3.6.. 3. 7.. Analysis ofData. 3.7.1.. Volume of Failed Paste Fill. The volume of failed paste fill for each blast was obtained through a comparison of the volume of the cavity extracted with each stope. Once a stope is extracted, the inside of the cavity is scanned. The volume that overlapped between the cavity of stope 4261 and the adjacent stopes represents the volume of paste fill that failed during the extraction of the adjacent stopes. Computer software used by Cannington Mine was used to calculate the volume of the intersection between the stopes, and to plot images of this volume. The failure at the interface of stopes 4261 and 4760 is shown in Figure 3.5, and the failure at the interface between stopes 4261 and 4763 is shown in Figure 3.6. The volume of failure for each interface is given in. 31.
(9) Chapter 3 - Monitoring of Stope 4261 During Nearby Blasting. (a)Front View. (b)Side View. (c)Plan View. Figure 3.5 - Failure at Intersection ofStope 4261 and 4760. 32.
(10) Chapter 3 - Monitoring of Stope 4261 During Nearby Blasting. (a) Front View. (b) Side View. (c) Plan View. Figure 3.6- Failure at Intersection ofStope 4261 and 4763. 33.
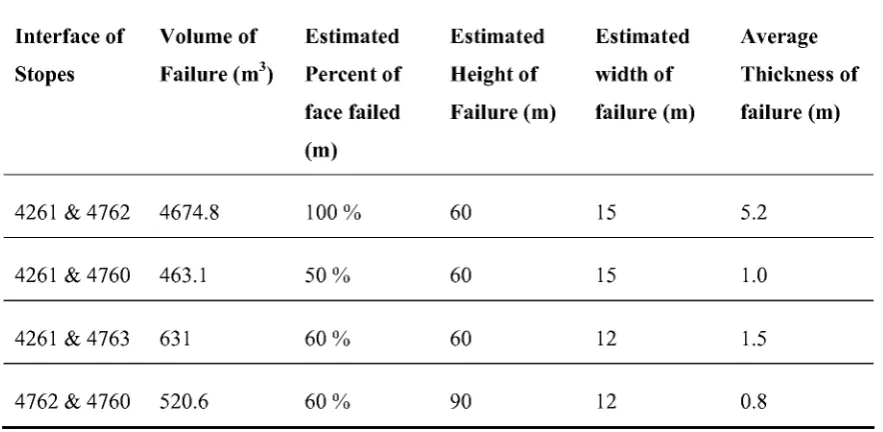
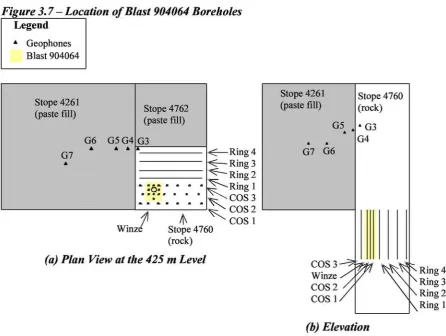
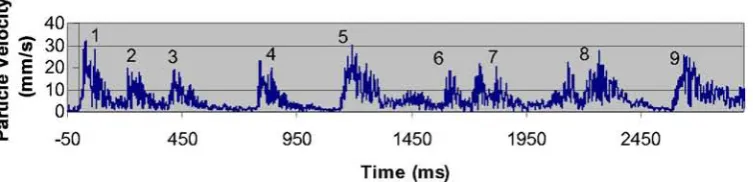
(11) Chapter 3 - Monitoring of Stope 4261 During Nearby Blasting Table 3.4. The average thickness of failure in the paste fill estimated from this data is also given.. As can be seen, generally the average of thickness of failure of paste fill was. approximately 1 to 1.5 m.. Table 3.4 Failure Observed During Blasting of Secondary Stopes Interface of. Volume of. Estimated. Estimated. Estimated. Average. Stopes. Failure (rrr'). Percent of. Height of. width of. Thickness of. face failed. Failure (m). failure (m). failure (m). (m). 4261 & 4762. 4674.8. 100 %. 60. 15. 5.2. 4261 & 4760. 463.1. 50%. 60. 15. 1.0. 4261 &4763. 631. 60%. 60. 12. 1.5. 4762 & 4760. 520.6. 60%. 90. 12. 0.8. 3.7.2.. Peak Particle Velocities Measured During Monitoring. 3.7.2.1.. Stope 4760. Blast 904064 Blast 904064 consisted of a winze that extended down from the 425 m level.. This blast. consisted of 9 production holes with a diameter of 69 mm surrounding a 152 mm diameter easer borehole. A total of 893 kg of explosive was used, over a total blast hole length of 143.5 m. The location ofthe boreholes detonated in blast 904064 are shown in Figure 3.7. Velocity profiles measured at each geophone are given in Figure 3.8. These profiles show the arrival of several waves. The blast consisted of 9 blast holes which are shaded yellow in Figure 3.7. The arrival of these blasts can be identified by the delay time used for each blast hole. In some cases, more than 9 wave arrivals can be identified. This may be due to reflections within the paste fill from the first blast holes interfering with the waves from the later blast holes. The peak particle velocity for each wave is given in Table 3.5.. 34.
(12) Chapter 3 - Monitoring of Stope 4261 During Nearby Blasting Figure 3.7- Location ofBlast 904064 Boreholes Legend •. Geophones Blast 904064. Stope 4261 (paste fill). Stope 4762 (paste fill) G6. G7. Stope 4261 (paste fill). •. Stope 4760 (rock). . .. G5. G5G4 G3. • •. ~ Ring4. • G3 G4. G7 G6. Ring3 ~ .~. •. &. &. •. j1. · W rnze. ,. Ring2. Ring 1 :9:.. . . . ~ COS3 &. •. A. A. A. A. A. A. fi\. ~COS2. Stope 4760 (rock). (a) Plan View at the 425 m Level. COS 1. COS 3 ---:;~"A Winze COS2 COS 1. Ring4 Ring3 Ring2 Ring 1. (b) Elevation Comparison of records from Geophone G3, situated in the rock, and geophone G4, situated in the paste fill adjacent to geophone G3, show a reduction in peak particle velocity which can be attributed to losses experienced at the rock/paste fill interface. Comparison of Geophones G4, G5, G6 and G7 generally show the peak particle velocity decreasing with distance from the blast as expected. However in a number of cases, the peak particle velocity increased with distance. This increase in peak particle velocity may be due to the reflection of waves from the paste fill/rock interface. The waveforms given in Figure 3.8 show a relatively slow attenuation of the velocity which also suggest that a significant amount of the wave is being reflected within the paste fill.. 35.
(13) Chapter 3 - Monitoring of Stope 4261 During Nearby Blasting. Geophone G3 - Magnitude of Resultant Velocity ~. 'u. 40. u~~r Jrl2(- rt~JO ~ o~ l'CI. fl.. -50. 450. 950. 1450. 1950. 2450. Time (ms). Geophone G4 - Magnitude of Resultant Velocity ~. ~'iil30~. il~i~~ l'CI. fl.. -50. 450. 950. 1450. 1950. 2450. Time (ms). Geophone G5 - Magnitude of Resultant Velocity ~. If:: l'CI. -50. fl.. 450. 950. 1450. 1950. 2450. Time (ms). Geophone G6 - Magnitude of Resultant Velocity ~. 'u. 60. ..2 'iii ~"E40. 9. 34568. ..2! E 20 CJ--. 1::. 0. fl.. -50. l'CI. 450. 950. 1450. 1950. 2450. Time (ms). Geophone G7 - Magnitude of Resultant Velocity. ~. 60. Qj III. 40. o ........ >"E. 1. 5 2. 3. 4. 6. 8. 9. ..2! E 20 CJ--. i. fl.. 0 -50. 450. 950. 1450. 1950. 2450. Time (ms). Figure 3.8 - Velocity Profiles Measured During Blast 904064 36.
(14) Chapter 3 - Monitoring of Stope 4261 During Nearby Blasting. Table 3.5 Results for Blast 904064 Geophone. G3. G4. G5. G6. G7. Min Distance from Blast (m). 32.2. 30.9. 29.6. 27.4. 24.2. Max Distance from Blast (m). 54.9. 53.8. 52.6. 50.1. 47.3. Material at Geophone Location. Rock. Paste. Paste. Paste. Paste. Wave 1 ppv (mm/s). 32.5. 23.2. 78.1. 44.6. 37.2. Wave 2 ppv (mm/s). 20.2. 13.6. 73.9. 21.0. 29.8. Wave 3 ppv (mm/s). 19.2. 14.6. 74.5. 26.4. 26.1. Wave 4 ppv (mm/s). 23.0. 13.3. 74.8. 26.4. 29.5. Wave 5 ppv (mm/s). 30.1. 24.3. 76.3. 32.4. 39.6. Wave 6 ppv (mm/s). 22.0. 15.7. 73.5. 28.3. 26.1. Wave 7 ppv (mm/s). 20.3. 15.0. 75.7. 29.3. 53.0. Wave 8 ppv (mm/s). 27.5. 18.4. 76.3. 30.6. 31.0. Wave 9 ppv (mm/s). 25.6. 21.8. 77.9. 44.1. 34.0. Blast 904068 Blast 904068 consisted of the detonation of the 475 m level COS upholes and Rings 1,2, 3 and 4. A total of 8 vertical COS boreholes of 89 mm diameter were detonated in this blast. Each Ring consisted of between 12 and 14 boreholes of 89 mm diameter drilled radially from the 475 TA63 DS tunnel. A total of 3204 kg of emulsion explosive was used; over a total blast hole length of 576 m. The location of the boreholes detonated in blast 904068 are shown as the yellow shaded section in Figure 3.9.. 37.
(15) Chapter 3 - Monitoring of Stope 4261 During Nearby Blasting. Stope 4261 (paste fill). Stope 4762 (paste fill) G6. G7. Stope 4261 (paste fill). G5G4 G3. &. &. ~Ring4. &. &. Stope 4760 (rock). G5•• ' G3 G4 G7 G6. <E-Ring3 ~Ring2 . ~Ring 1. .[J .. .. .. ~COS3 ill·.·.·.·. ". ... . . ... Winzt'. III. IIlI. co. •. ... Jt\. ~COS2. Stop e 476 o (rock). COS 1. (a) Plan View at the 425 m Level Legend &. Geophones Blast 904068. COS3~ ~Ring4 Ring 3. Winze /. Ring 2 Ring 1. D Void due to previous blasting. (b) Elevation. Figure 3.9 - Location ofBlast 904068 Boreholes. Velocity profiles measured at each geophone are given in Figure 3.10. The record lasts for 3 seconds, and shows the velocities experienced during the first half of the production blast. These profiles show the arrival of 5 waves. These waves were compared against delay times identified in the firing plans to identify the blast holes responsible for each wave as shown in Table 3.6. As can be seen, individual wave arrivals could not be identified for several blast holes. In some cases (COS 1 holes 4 and 5, and COS 3 holes 4 and 5) this may be attributed to the reduction of the signal due to travelling through broken rock as a result of previous detonation. In the remaining cases, the absence of an arrival wave indicated the misfiring of the blast hole. The peak particle velocity for each wave is given in Table 3.7.. 38.
(16) Chapter 3 - Monitoring of Stope 4261 During Nearby Blasting. Geophone G3 - Magnitude of Resultant Velocity. 3. ~ 950. 1450. 1950. 2450. Time (ms). Geophone G4 - Magnitude of Resultant Velocity. .a-. g _ 100~. 3. ;15:_~. III. a.. -50. 450. 950. 1450. 1950. 2450. Time (ms). Geophone G5 - Magnitude of Resultant Velocity. .a.-. 150. II'~~~ III. a.. -50. 450. 950. 1450. 1950. 2450. Time (ms). Geophone G6 - Magnitude of Resultant Velocity. .a·u. 150. ~~100m ~ ~. ~S5~~~ III. a.. -50. 450. 950. 1450. 1950. 2450. Time (ms). Geophone G7 - Magnitude of Resultant Velocity. --LL. .a-. ~~100~1 i150 ~~4. 2. ~. 0. a.. -50. III. 3. 5. ~ ----r-~~=. --"""'T"f-. 450. 950. -L..:._. 1450. _. I. ...L.:-":;-="'-'''''''''''''''''- ----''-=-T"''''''''''''''''''O----J. 1950. 2450. Time (ms). Figure 3.10 - Velocity Profiles Measured During Blast 904068. 39.
(17) Chapter 3 - Monitoring of Stope 4261 During Nearby Blasting. Table 3.6 Blast 904068 Delay Times Blast Type. Blast Hole. Delay (ms). Delay (s). COS 1. 3. 200. 0.2. COS3. 3. 200. 0.2. COS2. 4. 400. 0.4. 2. RING 4. 3. 450. 0.45. 2. 500. 0.5. 2. RING 4. Arrival number. COS 1. 4. 600. 0.6. NO ARRIVAL IN SIGNAL. COS3. 4. 600. 0.6. NO ARRIVAL IN SIGNAL. COS2. 5. 1000. COS 1. 5. 1400. 1.4. NO ARRIVAL IN SIGNAL. COS3. 5. 1400. 1.4. NO ARRIVAL IN SIGNAL. RING 1. 8. 1400. 1.4. NO ARRIVAL IN SIGNAL. RING 1. 7. 1675. 1.675. NO ARRIVAL IN SIGNAL. RING 1. 9. 1675. 1.675. NO ARRIVAL IN SIGNAL. RING 1. 6. 1800. 1.8. 4. RING 1. 10. 1800. 1.8. 4. RING 1. 5. 1950. 1.95. 4. RING 1. 11. 1950. 1.95. 4. RING 1. 4. 2275. 2.275. NO ARRIVAL IN SIGNAL. RING 1. 12. 2275. 2.275. NO ARRIVAL IN SIGNAL. RING 1. 3. 2400. 2.4. 5. RING 2. 8. 2400. 2.4. 5. 3. 40.
(18) Chapter 3 - Monitoring of Stope 4261 During Nearby Blasting Table 3.7 Results for Blast 904068 Geophone. G3. G4. G5. G6. G7. Min Distance from Blast (m). 30.9. 29.6. 28.2. 25.9. 23.6. Max Distance from Blast (m). 56.6. 55.9. 55.3. 54.2. 50.1. Material at Geophone Location. Rock. Paste. Paste. Paste. Paste. Wave 1 ppv (mm/s). 88.6. 39.7. 124.6. 97.3. 71.9. Wave 2 ppv (mm/s). 48.6. 39.0. 94.1. 63.0. 78.0. Wave 3 ppv (mm/s). 63.2. 65.2. 117.8. 89.4. 83.8. Wave 4 ppv (mm/s). 80.4. 70.6. 108.0. 57.5. 83.0. Wave 5 ppv (mm/s). 60.4. 34.6. 86.9. 52.3. 70.1. Comparison of records from Geophone G3, situated in the rock, and geophone G4, situated in the paste fill adjacent to geophone G3, show a reduction in peak particle velocity that can be attributed to losses experienced at the rock/paste fill interface. Comparison of Geophones G4, G5, G6 and G7 generally show the peak particle velocity decreasing with distance from the blast as expected. However, as observed in the results for blast 904064, in a number of cases, the peak particle velocity increased with distance. This increase in peak particle velocity may be due to the reflection of waves from the paste fill/rock interface. The waveforms given in Figure 3.10 show a relatively slow attenuation of the velocity which also suggest that a significant amount ofthe wave is being reflected within the paste fill.. Blast 904072 Blast 904072 consisted of the detonation of the 425 m level COS downholes and Rings 1, 2, 3 and 4. A total of 8 vertical COS holes were detonated in this blast. Each Ring consisted of between 13 and 16 blast holes drilled radially from the 425 TA63 DS tunnel. Each blast hole was 89 mm in diameter. A total of 3902 kg of emulsion explosive was used; over a total blast hole length of 727 m. The location ofthe boreholes detonated in blast 904072 are shown as the area shaded yellow in Figure 3.11. Velocity profiles measured at each geophone are given in Figure 3.12. The record lasts for 3 seconds, and shows the velocities experienced during the detonation of the COS holes and the initial 3 blast holes of Ring 1. These profiles show the arrival of 5 waves.. 41.
(19) Chapter 3 - Monitoring of Stope 4261 During Nearby Blasting. Stope 4261 (paste fill). Stope 4261 (paste fill). Stope 4762 (paste fill) G6. G5G4 G3. &. G7. &. ~Ring4. &. &. Stope 476 (rock). G5•• ' G3 G4 G7 G6. <E-Ring3 ~Ring2 . ~Ring 1. .[J .. .. .. ~COS3 ill.·.·.·.. ". •••. III. ... IIlI. co. •. Jt\. ~COS2. Stop e 476 o (rock). Winzl'. COS 1 COS 3 Winze. ra) Plan View at the 425 m Level Legend &. Geophones Blast 904072. D Void due to. Ring Ring Ring Ring. (b) Elevation. previous blasting. Figure 3.11 - Location ofBlast 904072 Boreholes These waves were compared against delay times identified in the firing plans to identify the blast holes responsible for each wave as shown in Table 3.8. The peak particle velocity for each wave is given in Table 3.9.. Table 3.8 Delay Times for Blast 904072 Blast Type. Blast Hole. Delay (ms). Delay (s). Arrival Number. COS 1. 3. 200. 0.2. 1. COS3. 3. 200. 0.2. 1. COS2. 4. 400. 0.4. 2. COS 1. 4. 600. 0.6. 2. COS3. 4. 600. 0.6. 3. COS2. 5. 1000. 1. 4. COS 1. 5. 1400. 1.4. 5. COS3. 5. 1400. 1.4. 5. RING 1. 3,4 and 5. 1400. 1.4. 5. 42. 4 3 2 1.
(20) Chapter 3 - Monitoring of Stope 4261 During Nearby Blasting. Geophone G3 - Magnitude of Resultant Velocity. .a-. .g -. 150. ~ ~ 100 ~. E. u -. 1:: III a.. r. 50 0. B!:. f--------------. ,,' '.... h·. -50. ' I. 450. ,. 950. 1450. 1950. E ~ 4. ,. 2450. Time (ms). Geophone G4 - Magnitude of Resultant Velocity. .a·u. 150. !I 1~~rolt=--, ~---------__ _,j~ ~=!~~.k :w. c~_..U .c. .:~ 1:: III a.. 4. -50. 450. 950. 1450. 1950. 2450. Time (ms). Geophone G5 - Magnitude of Resultant Velocity. .a.-. 150. II'~~~. ~ III. a.. -50. 450. 950. 1450. 1950. 2450. Time (ms). Geophone G6 - Magnitude of Resultant Velocity. .a·u. ~:w ~i. 1::III a.. 100 50. [ - - - - - - - - - - - - -, ~ 1 2 ~3 ,,~ 5. O -~. -50. 450. 950. 1450. 1950. 2450. Time (ms). Geophone G7 - Magnitude of Resultant Velocity. .a·u. 100. II 5:[L-.. _-.---~UL=f:lJ III. a.. -50. 450. 950. 1450. 1950. 2450. Time (ms). Figure 3.12 - Velocity Profiles Measured During Blast 904072. 43.
(21) Chapter 3 - Monitoring of Stope 4261 During Nearby Blasting. Table 3.9 Results for Blast 904072 Geophone. G4. G5. G6. G7. Min Distance from Blast (m) 52.9. 51.5. 50.1. 46.7. 45.3. Max Distance from Blast (m)80.5. 79.5. 78.6. 76.4. 73.4. G3. Material at Geophone Location. Rock. Paste. Paste. Paste. Paste. Wave 1 ppv (mm/s). 126.2. 124.8. 123.7. 90.5. 84.4. Wave 2 ppv (mm/s). 111.5. 124.8. 123.7. 64.6. 83.6. Wave 3 ppv (mm/s). 123.4. 124.8. 122.4. 61.1. 73.1. Wave 4 ppv (mm/s). 99.7. 88.3. 100.9. 67.0. 79.6. Wave 5 ppv (mm/s). 105.4. 103.4. 109.9. 34.1. 44.6. As can be seen, the results observed for blast 904072 were similar to those observed for blasts 904064 and 904068.. Blast 904078 The blast monitor failed to record any data during this blast as the disk was full. Therefore, no analysis could be conducted for this blast.. 3.7.2.2.. Stope 4763. Stope 4763 was detonated after stope 4760. During testing of the geophones prior to detonating stope 4763, geophones G3 and G4 tested dead. As a result, velocity records were only recorded for geophones G5, G6 and G7. The velocity records for these geophones showed similar results as those seen during the blasting of stope 4760. The peak particle velocities were generally seen to reduce with distance, but in some cases these peak particle velocities increased. This increase in peak particle velocity may be due to the reflection of waves from the paste fillirock interface. As shown in Figure 3.2, geophones G3 and G4 were located on either side of the rock/paste fill interface. Since these geophones did not record any data during these blasts, the transmission of the wave across the interface could not be analysed. Therefore, these waveforms were not analysed further.. 44.
(22) Chapter 3 - Monitoring of Stope 4261 During Nearby Blasting. 3.7.2.3.. Summary. Stope 4261 was monitored during the extraction of adjacent stopes 4760 and 4763. In all cases, comparison of peak particle velocities recorded at geophone G3, situated in the rock, and geophone G4, situated in the paste fill adjacent to geophone G3, show a reduction in peak particle velocity which can be attributed to losses experienced at the rock/paste fill interface. Comparison of peak particle velocities recorded at geophones G4, G5, G6 and G7 generally show the peak particle velocity decreasing with distance from the blast as expected. However in a number of cases, the peak particle velocity increased with distance.. Results from field. instrumentation tests discussed in Chapter 4 indicate that approximately 90 % of the pressure wave is reflected at the paste fill/rock boundary.. Therefore, the increase in peak particle. velocity observed in the blast monitoring can be attributed to the reflection of waves from the paste fill/rock interface.. The relatively slow attenuation of the velocity observed in the. waveforms also suggests that a significant amount of the wave is being reflected within the paste fill.. 3.7.3.. Wave Transmission Across the Rock/Paste Fill Interface. The peak particle velocities measured at geophones G3 and G4 were used to examine the effect of the rock to paste fill interface on the transmission of the wave generated from the explosion. Geophone G3 was located in the rock and geophone G4 was located in the paste fill. The geophones were 2.5 m apart.. The percentage of the wave that was refracted through the. interface into the rock was calculated as the percentage ofthe peak particle velocity measured at geophone G4 compared to the peak particle velocity measured at geophone G3. The results of the analysis are given in Table 3.10. As can be seen, the percentage of refraction into the paste fill varies considerably. This is due to a number of factors including the geometry ofthe boreholes in comparison to the geophone locations, and the reflection of waves within the paste fill from previous blasts interfering with the peak particle velocity measured at geophone G4. A field instrumentation test of blasts in paste fill indicated that the paste fill/rock boundary reflects approximately 90 % of the blast wave back into the paste fill. Therefore, during a production blast involving the detonation of numerous boreholes with millisecond delays between each blast, a large amount of reflection would occur. The peak particle velocities measured at geophone G4 is the peak particle velocity experienced at this location as a sum of all waves present at that time. Therefore, the peak particle velocities measured at geophone G4 may be much higher than the peak particle velocities that would be experienced if a single explosive were detonated. As can be seen in Table 3.10, in some cases the large amount of reflection of pressure waves within the paste fill produced peak particle velocities in the paste fill that were larger than those measured in the rock. The results from this analysis indicate that. 45.
(23) Chapter 3 - Monitoring of Stope 4261 During Nearby Blasting Table 3.10 Transmission of Blast Wave Across Rock/Paste Fill Interface Ppv Measured ppv Measured Percentage of at Geophone. Percentage of. at Geophone Pressure Wave Pressure Wave. Blast. Wave. G3 in Rock. G4 in Paste. Refracted into. Reflected in to. Number. Number. (mm/s). Fill (mm/s). Paste Fill. Rock. 32.5. 23.2. 71.5 %. 28.5 %. 904064 904064. 2. 20.2. 13.6. 67.3 %. 32.7 %. 904064. 3. 19.2. 14.6. 75.9 %. 24.1 %. 904064. 4. 23.0. 13.3. 57.6 %. 42.4 %. 904064. 5. 30.1. 24.3. 80.5 %. 19.5 %. 904064. 6. 19.0. 15.7. 82.7 %. 17.3 %. 904064. 7. 22.0. 13.0. 59.3 %. 40.7 %. 904064. 8. 20.3. 15.0. 73.8 %. 26.2 %. 904064. 9. 22.7. 12.7. 55.8 %. 44.2 %. 904064. 10. 27.5. 18.4. 66.7%. 33.3 %. 904064. 11. 25.6. 21.8. 85.3 %. 14.7 %. 88.6. 79.3. 89.5 %. 10.5 %. 904068 904068. 2. 48.6. 39.0. 80.1 %. 19.9 %. 904068. 3. 63.2. 65.2. 103.2 %. 0%. 904068. 4. 80.4. 70.6. 87.8 %. 12.2 %. 904068. 5. 60.4. 34.6. 57.3 %. 42.7 %. 126.2. 124.8. 98.9 %. 1.1%. 904072 904072. 2. 111.5. 124.8. 111.9 %. 0%. 904072. 3. 123.4. 124.8. 101.1 %. 0%. 904072. 4. 99.7. 88.3. 88.6 %. 11.4 %. 904072. 5. 105.4. 103.4. 98.0 %. 2.0%. a large proportion of the stress wave is refracted from the rock into the paste fill, with a minimum of 55 % of the wave observed to be refracted.. 46.
(24) Chapter 3 - Monitoring of Stope 4261 During Nearby Blasting The refraction and reflection of waves at a boundary between two different materials is complicated and the amplitude of each of the waves generated at the boundary is dependent on the characteristic impedance of the materials, where the characteristic impedance is a material property which affects the transmission of waves through an elastic medium. The characteristic impedance is the product of the p-wave velocity and the density. When two different materials have the same characteristic impedance, the wave will be fully refracted through an interface of the two materials. When the characteristic impedance of the second material is greater than the characteristic impedance of the first material, the majority of the wave will be reflected back into the first material at an interface between the two materials.. Similarly, when the. characteristic impedance of the second material is less than the characteristic impedance of the first material, the majority of the wave will be refracted from the first material to the second material at an interface between the two materials. The p-wave velocity, density and characteristic impedance of rock and paste fill at Cannington Mine is shown in Table 3.11. As can be seen, the characteristic impedance of rock is much larger than the characteristic impedance of paste fill. It is not surprising then that the majority ofthe wave will be refracted from the rock into the paste fill. In a similar manner, in the case of a wave travelling through the paste fill towards a paste fill/rock interface it is expected that the majority ofthe wave would be reflected back into the paste fill.. Table 3.11 Characteristic Impedance of Rock and Paste Fill at Cannington Mine Material. P-Wave Velocity. Density (kg/m'). Characteristic Impedance (Ns/m 3 ). (m/s). Rock. 2330. 3950. 9203562. Paste Fill. 176. 2003. 353031. 3.7.4. Estimation of the Peak Particle Velocity at which Failure of Paste Fill Occurs The peak particle velocities at which the paste fill failed could not be calculated from the monitoring data, as useable data was not obtained during the blasting of the sections of the adjacent stopes that were the closest to the geophones. The recordings taken during these blasts were "saturated", i.e. the velocities experienced at the geophones during these blasts were much higher than the levels at which the geophones were set to record. Geophones G3 and G4 were either lost or damaged beyond use during these blasts.. 47.
(25) Chapter 3 - Monitoring of Stope 4261 During Nearby Blasting The peak particle velocity that causes failure in the paste fill was estimated using data from the following sources: •. The blast plans for stope 4760. •. The volume of paste fill that failed, particularly the thickness ofthe failed section, discussed in section 3.7.1. •. Equations for predicting peak particle velocities using constants previously reported for rock at Cannington Mine (Sartor, 1999) and constants for paste fill obtained during field instrumentation tests (see Chapter 4).. The peak particle velocity experienced at the failure plane in the paste fill was estimated using the following method: 1. Determine the location ofthe nearest borehole to the rock/paste fill interface. 2. Estimate the peak particle velocity in the rock immediately prior to the rock/paste fill interface using equation 2.5. The values of the constants for rock at Cannington Mine were obtained from work by Sartor (1999). These values are k = 2938 and ~/2 = 0.66. 3. The peak particle velocity in the paste fill immediately after the rock/paste fill interface was estimated by assuming that 50 % or 90 % of the wave will be refracted across the interface, as calculated in section 3.6.3. 4. Equation 2.5 and the site specific constants for paste fill presented in Chapter 4 (k. =. 1000 and. ~ =. 1.02) were used to calculate the equivalent distance a wave. would have travelled in paste fill to result in the same peak particle velocity. 5. Equation 2.5, the site specific constants for Cannington Mine paste fill and the equivalent distance of the failure plane from an explosive source in paste fill were used to estimate the peak particle velocity at the failure plane. The results from this calculation are given in Table 3.12. From these results it can be seen that failure of paste fill is expected to occur when peak particle velocities over 2.5 mls are experienced.. 48.
(26) Chapter 3 - Monitoring of Stope 4261 During Nearby Blasting. Table 3.12 Peak Particle Velocity at which Failure Occurs in Paste Fill Interface. Average. Diameter of Linear. Thickness of Borehole Paste Fill. (mm). Failure (m). Charge. Distance. ppvat. ppv at interface in. Equivalent Distance from. from. interface in. paste fill (mm/s). Source to Interface if. Density Interface (m) rock (mm/s) (kg/m). ppv at Failure Plane. Explosive is in Paste Fill 50% *. 90%*. 50%*. 90%*. 50%*. 90%*. 4261- 4760. 1. 89. 6.22. 2. 12328.93. 4418. 7230. 0.52. 0.20. 2.51. 2.85. 4762- 4760. 0.8. 76. 4.54. 1.4. 12943.39. 4597. 7522. 0.35. 0.14. 2.48. 2.76. Note: *The percentage of the wave assumed to be refracted through the rock/paste fill interface as calculated in section 3.7.3.. 49.
(27) Chapter 3 - Monitoring of Stope 4261 During Nearby Blasting. 3.7.5.. Fourier Analysis. The fast Fourier transform of each waveform was calculated in order to analyse the frequency content of the waveforms. The fast Fourier transform is a method used by computer programs such as Microsoft Excel to calculate the discrete Fourier transform of a signal. The discrete Fourier transform is defined as: N-l. =. F(iIJ.f) Lf(nIJ.t)e- i (2iTif.1 )(nf.t ) fori=O, 1,2,... ,N-l. (3.1). n=O. where N = the total number of discrete samples taken in the time domain. T .M= the time increment between samples IJ.t = N T = total sampling time. f, = the sampling frequency. f. = _1 = N S. IJ.t. T. Af = the frequency increment for the output in the frequency domain. F(iM) = the discrete Fourier transform output The discrete Fourier transform output is given as one complex number for each discrete frequency and provides information about the relative contribution of each discrete frequency to the signal. The magnitude of the complex number calculated by the fast Fourier transform is used to compare the relative contribution ofthe different frequencies. An example of the frequency spectrum generated for one of the velocity waveforms is shown in Figure 3.13. Similar frequency spectrums were obtained for all other waveforms. In all cases, the frequency spectrums indicate that it is the lower frequencies that contribute to the waveform. This is likely due to the higher frequencies attenuating prior to the waves reaching the geophones. No significant difference was seen between the contribution of the frequencies at the geophone in rock compared to the geophones in paste fill.. 50.
(28) Chapter 3 - Monitoring of Stope 4261 During Nearby Blasting. 6 -. Radial Direction. -. Transverse Direction Vertical Direction. 5. 4 Gl. "C. ,gc.. 3. E. <. ' ~I. 2. ,! i. o. \. ~I ~\i,. j. ·~f\,,,,~d.. o. 10. ~ ~--r--~-. -- .----. 20. - -~"1. 30. - -. -~~--- -. --. ~~-- I- --. 40. _____ ___..,t.I· ~··. - - . -- - - - --. 50. - I-. ~ ._ ~-~- ~ -. 60. ' -- I - - ' ~ - ------- ( -- -- -. 70. 80. - - -~-- - -- - I-. 90. ---- .---. -- ~_ .. ,. 100. Frequency (Hz). Figure 3.13 - Frequency Spectrum for Blast 904064, Wave Arrival 1 Recorded at Geophone G3 in Rock. 3.7.6.. Damage to Walls of Tunnel in Paste Fill. During the production blasts of stopes adjacent to stope 4261, minimal damage to the walls of the tunnel in the paste fill was observed. The vibrations from the nearby blasts appeared to simple shake the dust off the walls. This indicates that the peak particle velocities experienced in the general mass of paste fill are less than required to damage the paste fill.. 3.8. Summary The paste fill stope 4261 at Cannington Mine was monitored during the extraction of adjacent stopes. A total of five geophones were used for the monitoring program, 4 of which were installed in paste fill and one of which was installed in rock. The following observations were made during the field monitoring: 1. Higher than expected peak particle velocities were observed in the paste fill when compared to those observed in the rock. This indicates a large proportion of the waves that enter the paste fill are reflected back into the paste fill at the paste fill/rock boundary. This results in the slow attenuation of the wave within the paste fill. This slow attenuation was also observed in the velocity profiles measured during the field monitoring exercise.. 51.
(29) Chapter 3 - Monitoring of Stope 4261 During Nearby Blasting 2. The majority of the blast wave was refracted from the rock into the paste fill at the rock/paste fill interface. 3. The peak particle velocity at the failure plane in paste fill was estimated to be 2.5 m/s. 4. Damage to the paste fill was not visible at the tunnel wall due to the attenuation of the blast wave prior to reaching the centre ofthe paste fill stope. 5. A Fourier analysis of the data indicated that the higher frequencies had attenuated before the blast waves reached the geophones.. 52.
(30)
Figure
+7
Related documents
1994 11 Table 3.1 Properties ofPowerbulk VE 27 Table 3.2 Monitoring Data Collected During Blasting ofStope 4760 29 Table 3.3 Details ofStope 4763 Blast Event Monitored 30 Table
Chapter 5 - The Study of Blast Attenuation in Paste Fill using Laboratory Tests Figure 5.2 - Accelerometer Installed in Casing Prior to Pouring Resin A problem faced early in the
The stage 1 models were used to validate the model results of the transmission of blast waves through paste fill against the data obtained in the field instrumentation tests
Chapter 8 - Numerical Model Results and Discussion - Blast pattern 2, 100 ms delay - Blast pattern 2, 200 ms delay Blast pattern 2, 400 ms delay -7.5 -12.5 -2.5 2.5 7.5 12.5 Offset
At present, the reflection coefficient of the stress wave at free interface is not considered in the equation for calculating the peak particle velocity in step
