GREATER
LOND
ON
AUTHORITY
Data Management and Analysis Group
Social Selection, Social Sorting and Education – 2:
'Missing' children
0.0 10.0 20.0 30.0 40.0 50.0 60.0 70.0 80.0 90.0 100.0
£20,000 £25,000 £30,000 £35,000 £40,000 £45,000 £50,000 £55,000 £60,000 Average income in each ward in 2005
Percentag
e ag
ed
4 to
10 no
t in m
aintained
scho
DMAG Briefing 2008-27
June 2008
Social Selection, Social Sorting and Education – 2
‘Missing’ children
For further information please contact:
David Ewens
Data Management and Analysis Group Greater London Authority
City Hall (2 East PP24a) The Queen’s Walk London SE1 2AA
Telephone: 020 7983 4656
Email: [email protected]
Copyright © Greater London Authority, 2008
The data tables in this Briefing can be made available in other formats on request
Contents
Page
1 Executive Summary 1
2 Affluence and pupils ‘missing’ from maintained schools. Independent
schools 5
3 Pupil age and ‘missing’ pupils 12
4 Affluence, poverty and ‘missing’ children 17
5 Affluence and attainment, and affluence, attainment and children
‘missing’ maintained schooling 21
6 Children ‘missing’ the final year of compulsory schooling, overall raw score performance in the schools they once attended, and children’s prior attainment
26
7 Social vulnerability and ‘missing’ children – highlighting the need for
further qualitative analysis 36
8 Conclusions 43
References and Notes 46
Appendix A. Continuity and discontinuity in the pupil record. Age, gender and
ethnicity 49
DMAG helps provide the GLA with its evidence base. This Briefing is not a statement of GLA policy.
1. Executive Summary
The Victoria Climbié case might appear to suggest that the issue of children missing from education is a matter of social pathology, existing only in extreme and highly unusual circumstances, and involving only a small number of children and/or schools. This Briefing confirms that this is not so.
Over 150,000 pupils are sorted away from or out of, or are ‘mobile out of ‘ maintained schooling in any one year, and a large number of these will have taken up places at
independent schools. 124,207 pupils were on the roll of independent schools located within London in 2002. However, this still leaves a shortfall of more than 25,000 young people unaccounted for when the numbers on roll in maintained schools are compared with the numbers of children who were living in London at the time of the 2001 census, and a surprisingly large number (approximately 4,000) appear to be missing from the final year of compulsory education in maintained schools. The latter are in circumstances which make it highly unlikely that anything more than a very small minority will have transferred to private sector educational provision.
Earlier DMAG education Briefings have pointed to the sizeable number of young Londoners who were recorded as being on roll in a maintained school at one point in time and who, though still of school age, were missing from the record one year later.1 Earlier work from DMAG also indicated that ‘missing’ children were also likely to also have missing key stage records, and that this was especially the case with pupils entitled to free school meals.2
The Victoria Climbié case underlined the point that children who are missing from the school system can be at serious risk and, following the 2004 Children Act, local authorities merged their Education and Social Services Departments to improve services for all young children. Nonetheless, despite developments such as ContactPoint, which is a database containing records of young people with whom schools, social workers and GPs work, there is no single complete dataset of young people who are not attending maintained schools.
This Briefing uses two methods to indicate the number and characteristics of children missing from the maintained school record in London. Taken together the two approaches point to links between affluence and children ‘being missing’ from maintained schooling, particularly at the end of primary school, and to links between educational and social disadvantage and children ‘being missing’ from the final year of compulsory schooling in mainstream and special schools.
• There were 86,464 fewer children aged 4 to 10 on 31st August 2001 in the London Pupil Dataset3 (LPD) headcount of children attending maintained (state) schools in January 2002 than in the census population count of children of the same age in spring 2001, and
• There were 64,093 fewer young people aged 11 to 15.
• Measured this way, the likelihood of being ‘missing’ from maintained schooling is age related.
• Pupils aged 5 attending maintained schools accounted for 86 per cent of locally resident population in inner London and 90.6 per cent of the locally-resident population in outer London in 2001/2
• The equivalent figures for 15 year olds were 78.2 per cent and 85.6 per cent.
The tendency to ‘be missing’ from maintained schooling is, as noted, in some cases related to affluence. The more affluent the ward, the lower the proportion of locally resident children accounted for by numbers of children on roll in maintained schools. For example, by London standards, average income in Knightsbridge and Belgravia ward is high. Locally resident pupils aged four to ten attending maintained schools (anywhere) account for only 10 per cent of locally resident children in the same age range.
A second approach to identifying the number and characteristics of missing pupils in this Briefing is based on an analysis of individual pupil records in the merged 2002 2003 2004 and 2005 London Pupil Dataset (LPD), focussing on continuity and breaks in the pupil record for 2004 and 2005.3 (In 2005, the ‘catchment’ of the LPD was expanded to include young people in the shire counties and unitary authorities around London, which reduces the likelihood that pupils who moved from London to, for example, Surrey, would be lost to the LPD).
This approach aims to answer five key questions. Firstly, taking pupils who were on roll in 2004, and who were of compulsory school age in 2005, how many had no record in 2005 and, related to this, how many pupils were newly arrived in 2005? Secondly what, if anything is the relationship between pupils’ degree of affluence and the tendency to be missing from the maintained school record? Thirdly what, if anything, is the relationship between degree of affluence, pupil educational attainment and the tendency to be missing from maintained schooling? Fourthly, taking all those factors into account, what is the relationship between average attainment in individual maintained schools and the tendency to be missing from maintained schooling? The fifth question involves exploratory work on the tendency of looked after children and pupils with a particular social needs and asks whether, and if so when, these pupils are likely to be missing from maintained schools.
• In total 30,269 pupils aged 5 to 14 with records in the 2004 LPD had no record in the 2005 LPD
• Amongst pupils aged 9 who had a record in the 2004 LPD, 2,601 had no record in 2005. More than double that number of 10 year olds in 2004 (5,638) had no 2005 record.
• Amongst pupils aged 13 who had a record in the 2004 LPD, 2,288 had no record in 2005. More than half as many again 14 year olds in 2004 (3,842) had no 2005 LPD record.
This is not a matter of randomly missing pupil records. Data in the LPD also confirm that the tendency to ‘go missing’ from maintained schooling at the end of primary schooling is related to affluence. Based on equivalised income estimates at full postcode level,
• pupils aged 10 in 2004, who lived in a high income area, were more than twice as likely as pupils living in a low income area and/or were entitled to free school meals, to be ‘missing’ from the maintained school record one year later.
The opposite applies to the last year of compulsory education. Poverty is associated with a tendency to be missing from the last year of compulsory school in maintained schools.
• Pupils aged 14 in 2004 who lived in a low income area or who were entitled to free school meals were more than twice as likely as pupils living in a high income area to be missing from the maintained school record one year later.
It is highly unlikely that socially disadvantaged children, who were ‘missing’ from the last year of compulsory schooling, had transferred to fee-paying independent schools, but some would have transferred to Pupil Referral Units (PRUs). The records of pupils in roll in PRUs were not included in the National Pupil Dataset (NPD) or the LPD in 2004 and 2005, and pupils making that transfer would appear to ‘go missing’ from the LPD record. While pupils
transferring to PRU’s will account for some ‘missing’ children, the total number of pupils on roll in PRUs is simply not enough to account for the total number of ‘missing’ children.
Additionally, while the number of 15 year olds on roll in PRUs will account for some ‘missing’ children, this does not itself explain why a large number of young people should be
transferred from their school to a PRU for the final year of compulsory schooling.
• In 2004 there were 30 pupils aged 11, 630 aged 14 and 1,380 aged 15 on the full time roll of PRU’s in Greater London
• The equivalent figures for 2005 were 30, 810 and 1,850 pupils
• In 2006, the equivalent figures were 30, 880 and 1,850 pupils
Given the number and characteristics of pupils ‘missing’ from maintained schooling, especially from the last year of compulsory schooling, it is clearly important that records of pupils in PRUs are included within the NPD at the earliest opportunity.
• At the maximum 57 fourteen year olds in 2004 in one London school (23.3 per cent of the age group) were missing from the final year of compulsory education in 2005
• 52 fourteen year olds in 2004 in one London school (23.7 per cent of the age group) were missing from the final year of compulsory schooling
• At the minimum, no children who were aged 14 in 2004 were missing in this way in more than twenty London schools.
• Pupils aged 14 who had no or low records of raw score attainment at key stage 3, and who attended secondary schools which had low levels of raw score attainment in public examination, were particularly at risk of being missing from the final year of compulsory schooling.
This variation between schools provides scope for the sharing of good practice, and suggests that local authorities might usefully review, and where necessary act on, the information they already hold. It also presents a challenge for those analysing and interpreting data on pupil attainment. Present arrangements effectively underestimate low attainment in London, by excluding some 4,000 missing 15 year olds from analyses of attainment. Present
arrangements also lead to analyses which, in a sense, put at a disadvantage those schools which successfully retain low attaining pupils up to the end of compulsory schooling. There is a clear need for a discussion of how this might best be remedied.
Social vulnerability is also associated with the tendency for pupils to be ‘missing’ from the last year of compulsory schooling. The tendency for pupils in the care of a local authority (‘looked after children’) and for pupils with a special educational need (SEN) record of behaviour, emotional and social difficulty, to be missing from the maintained school record is at its peak during the final year of compulsory schooling.
• One in five pupils aged 14 in 2004 who had a record of behaviour, emotional and social difficulty were ‘missing’ from the school record one year later. The equivalent figure for pupils with no record of special educational need was 1 in 25 pupils ‘going missing’ from the maintained school record.
• Amongst looked after children aged 14 in 2005, 16.0 per cent had no LPD record in 2005, compared with 4.8 per cent of pupils who were not looked after.
Despite the links between age, affluence, poverty and children ‘being missing’ from
maintained schooling we should allow for the possibility that, in at least some instances, the issue may be one of missing pupil records, rather than missing pupils. We need to allow for the possibility that the framework for collecting data will have a bearing on exactly what information is collected. Appendix 1 to the Briefing reviews continuity and discontinuity in the record of pupil age, gender and ethnicity over time to illustrate how this ‘framework effect’ can work.
Acknowledgements
well qualitative and quantitative work can complement each other and, taken together, assist policy makers assess whether an issue is small scale and temporary or whether it has a wider significance.
Discussion with local authority colleagues, in a separate meeting organised by the
Government Office for London on child mobility, was more sceptical and at one point veered towards generating more heat than light. Nonetheless, the discussion confirmed the
importance of including records of pupils on roll in Pupil Referral Units (PRUs) in the National Pupil Dataset (NPD) at the earliest opportunity. It also prompted thought about how local authorities might develop their own use of the data available to them. This is reflected throughout the Briefing, but particularly in Section 6, and also in the outline of the methodology used.
Work for the Briefing benefited from discussion at the 2007 annual conference of the British Educational Research Association and from the patience of a number of colleagues at the Institute of Education, University of London, and the London School of Economics, who might have, but did not, form conclusions in advance of the evidence.
The original London Pupil Dataset would not have existed without proposals made by
colleagues in DMAG. The 2002 LPD and its successors would also not have existed without a continuing and very high level of co-operation from what in 2002 was the Department for Education and Skills’ (DfES) Analytical Services, and is now the Department for Children, Schools and Families (DCSF). Data on school type and location is drawn from the EduBase dataset. Appreciation is expressed to all those involved.
2. Affluence, and pupils ‘missing’ from maintained schools.
Independent schools
The basic questions in this section are whether, and if so how far, the tendency for children to be ‘missing’ from state schooling is associated with affluence. By national standards, a high proportion of pupils attending schools in London attend independent schools and, rightly or wrongly, the division between maintained and independent schools has been seen as one of the major fault lines of social selection and social sorting in education in England.
…. we shall still not have equality of opportunity so long as we maintain a system of superior private schools, open to the wealthier classes, but out of reach of poorer children however talented and deserving. This is much the most flagrant inequality of opportunity, as it is the cause of class inequality generally, in our educational system; and I have never been able to understand why socialists have been so
obsessed with the question of grammar schools, and so indifferent to the much more glaring injustice of the independent schools.4
The problem with our education system is easily stated. Excellence at the top is not matched by high standards for the majority of children. We have some first class schools and our best students compare with the best in the world. But by comparison with other industrialised countries, achievement by the average student is just not good enough.5
A cursory glance at school performance data available on the DCSF Research and Statistics Gateway confirms, not only on standard performance measures but on achievement in specific science disciplines needed for advanced study in those subjects, that there are generally higher levels of raw score attainment in independent schools than in maintained, state schools (other than grammar schools).
Independent schools are fee-paying schools. They do not all charge high fees, but without private support they would cease to exist. Teachers’ salaries will be a major element in any school’s costs, and Table 1 shows the combined numbers of full-time equivalent (fte) pupils and teachers in mainstream maintained primary and secondary schools in London in 2004, and the number of fte teachers in London’s independent schools in the same year.
The full-time equivalent (fte) figures take account of the point that some teachers work part-time. For example, a teacher who works for two and a half days would count as 0.5 fte. The same point would apply to a pupil who is on the roll of a mainstream school for one half the week, and on the roll of a Pupil Referral Unit (PRU) for the other half. The pupil teacher ratio (ptr) shows the average number of pupils to each teacher in schools as a whole, and is
calculated in the Table by dividing the total number of fte pupils by the total number of fte teachers. In London there are typically 20 pupils to every teacher in each maintained school. The Table also shows the fte ptr for independent schools in London, using information published by the Department for Children, School and Families (DCSF). In 2004, independent schools had a ptr of 10.0. There are twice as many pupils to each teacher in maintained schools than in independent schools.
Table 1. Pupil teacher ratios (ptr) in mainstream maintained primary
and secondary schools and in independent schools in 2004
6Maintained primary and secondary fte pupils
Maintained primary and secondary fte teachers
Maintained primary and secondary
combined ptr Independent schools ptr
Inner London 348,960 17,640 19.8 10
Outer London 674,440 33,050 20.4 10
Greater London 1,023,400 50,680 20.2 10
Total number of teachers needed in maintained primary and secondary schools to achieve independent school ptrs
Increase in the total number of teachers in maintained primary and secondary schools required to achieve a ptr of 10
Average teacher salary maintained nursery, primary and secondary schools nationally Estimate of additional staff costs required to achieve ptr in independent schools (£s) Inner London 34,896 17,256 31,580 544,944,480 Outer London 67,444 34,394 31,580 1,086,162,520
Greater London 102,131 51,451 31,580 1,624,833,997 Source: these are given in reference 6 in the reference and notes section
There are more sophisticated ways of calculating ptrs, and teachers in state schools and in independent schools in any event do not have identical responsibilities. Additionally, independent schools are funded differently, and not simply at a different level, from state schools, and the indicator of additional staffing costs in Table 1 is based on a national average salary figure. This would differ from actual costs depending on the seniority of teachers employed, and does not include on-costs to the employer. However, the point of Table 1 is to indicate the size of gap between the two types of schools, rather than to provide a precise economic or accounting model. Looked at this way, the gap between independent and maintained schools is large, and closing that gap would be a major task.
There are clear incentives, for parents who can afford to pay the fees, to at least consider the educational benefits a place at an independent school might confer on their child.7 However, since there is an economic constraint on participation in independent schooling, is there any way of estimating the likelihood that parents will seek a school place outside the state school system?
home ward. The LPD does not contain records of pupils attending PRUs, and there is no immediate prospect of records of pupils attending independent schools being included in the NPD or LPD.
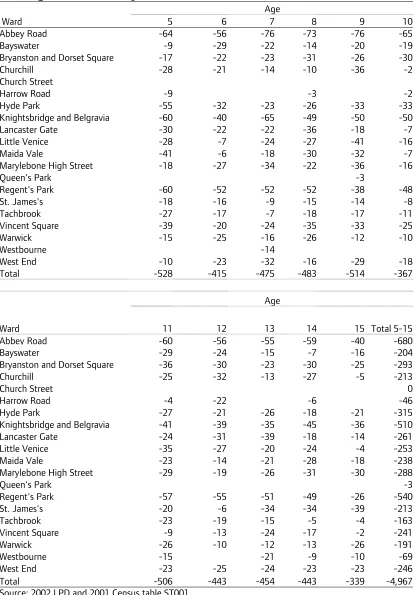
Table 2 shows the extent to which the 2002 LPD headcount of locally resident pupils falls below the 2001 census population headcount of the locally resident population in each ward in one London borough (the City of Westminster). Figures are given for individual age groups. In total, 15,018 pupils aged 5 to 15 were recorded in the 2001 national census as living in Westminster. The total LPD shortfall, counted as the sum of any shortfall in any individual age group, is 4,967 (33.1 per cent of the 2001 census total for this age range).
In Westminster’s Harrow Road ward the picture is what might be expected when headcounts are based on surveys carried out some months apart. In some age groups the number of young people attending any maintained school, i.e. not just those in Harrow Road ward, is less than the numbers in the locally resident population. In other age groups it is not, and the difference is generally small. In other wards there is a shortfall in the numbers of children attending maintained schools in all age groups, and this may indicate the number of children who are missing from state education. That said, there is considerable variation between wards, with an estimated 680 young people missing state education in Abbey Road ward while there is no shortfall in Church Street ward.
As with many areas of London, Westminster contains areas of affluence and areas of
deprivation. Based on PayCheck estimated average income8 for each ward, Knightsbridge and Belgravia ranks as eight wealthiest of London’s 624 wards (excluding wards in the City of London) and Abbey Road is the 21st wealthiest. The LPD headcount accounts for 15.1 and 25.1 per cent respectively of locally resident children aged 5 to 15 in those two wards; the remainder (84.6 per cent and 74.9 per cent respectively) are ‘missing’ from maintained school record.
Table 2. London borough of Westminster. Comparison, locally
resident population headcount in 2001 and 2002 LPD headcount of
locally resident children attending any maintained school. If the
LPD figure is lower, by how much?
Age
Ward 5 6 7 8 9 10
Abbey Road -64 -56 -76 -73 -76 -65
Bayswater -9 -29 -22 -14 -20 -19
Bryanston and Dorset Square -17 -22 -23 -31 -26 -30
Churchill -28 -21 -14 -10 -36 -2
Church Street
Harrow Road -9 -3 -2
Hyde Park -55 -32 -23 -26 -33 -33
Knightsbridge and Belgravia -60 -40 -65 -49 -50 -50 Lancaster Gate -30 -22 -22 -36 -18 -7
Little Venice -28 -7 -24 -27 -41 -16
Maida Vale -41 -6 -18 -30 -32 -7
Marylebone High Street -18 -27 -34 -22 -36 -16
Queen's Park -3
Regent's Park -60 -52 -52 -52 -38 -48
St. James's -18 -16 -9 -15 -14 -8
Tachbrook -27 -17 -7 -18 -17 -11
Vincent Square -39 -20 -24 -35 -33 -25
Warwick -15 -25 -16 -26 -12 -10
Westbourne -14
West End -10 -23 -32 -16 -29 -18
Total -528 -415 -475 -483 -514 -367
Age
Ward 11 12 13 14 15 Total 5-15
Abbey Road -60 -56 -55 -59 -40 -680
Bayswater -29 -24 -15 -7 -16 -204
Bryanston and Dorset Square -36 -30 -23 -30 -25 -293
Churchill -25 -32 -13 -27 -5 -213
Church Street 0
Harrow Road -4 -22 -6 -46
Hyde Park -27 -21 -26 -18 -21 -315
Knightsbridge and Belgravia -41 -39 -35 -45 -36 -510 Lancaster Gate -24 -31 -39 -18 -14 -261 Little Venice -35 -27 -20 -24 -4 -253
Maida Vale -23 -14 -21 -28 -18 -238
Marylebone High Street -29 -19 -26 -31 -30 -288
Queen's Park -3
Regent's Park -57 -55 -51 -49 -26 -540
St. James's -20 -6 -34 -34 -39 -213
Tachbrook -23 -19 -15 -5 -4 -163
Vincent Square -9 -13 -24 -17 -2 -241
Warwick -26 -10 -12 -13 -26 -191
Westbourne -15 -21 -9 -10 -69
West End -23 -25 -24 -23 -23 -246
Total -506 -443 -454 -443 -339 -4,967
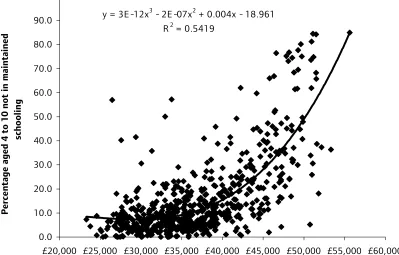
Figure 1 and 2 extend the analysis to all wards in London, other than in the City of London, and take account of estimated average income in each ward. The Figures show the
percentage of the locally resident population not accounted for by pupils attending
maintained schools. Figure 1 refers to pupils of primary school age, and Figure 2 shows the secondary school age range up to the end of compulsory schooling. There is a clear tendency for a higher proportion of children to be ‘missing’ state schooling in the more affluent areas of London.
However, there are a number of low income wards where comparatively high proportions of children of primary and secondary school-age children are not accounted for by the
maintained school record. These wards are in Hackney, where the educational needs of locally resident orthodox Jews are met in private schools. Choice of private schooling may, in most cases, be constrained by the parent’s level of affluence but, as the Hackney case suggests, factors other than affluence are likely to explain why some parents choose to send their children to an independent school. This Briefing does not introduce data on why parents choose places at independent schools, though it does point out there are good reasons for exploring that area further.
Figures 1 and 2 both show an R2 value. These are regression coefficients, and summarise the statistical association between average income in each ward and the percentage of the local population missing state schooling. The more linear the association is between the percentage of an age group missing state education and the level of ward affluence, the nearer the regression coefficient is to 1.
There are other outliers in addition to the Hackney wards, including affluent wards with low proportions of children missing from state education. Wards in London can be socially diverse, and in some the average income figure will mask considerable differences in income. Income estimates are available, at a cost, for smaller areas such as the full postcode area, but
y = 4E -12x3 - 3E -07x2 + 0.0079x - 56.839
R2 = 0.5719
10.0 20.0 30.0 40.0 50.0 60.0 70.0 80.0 90.0 100.0
Estimated percentage ag
ed 11-15 in indpendent
[image:15.595.97.496.119.374.2]schools
Figure 1. Estimated percentage of 2001 population aged 4-10 missing
education by home ward and average income in each ward in 2005
Figure 2. Estimated percentage of 2001 population aged 11 to 15
missing state education, by home ward in 2002 and average income in
each ward in 2005
Source for Figures 1 and 2, 2002 LPD
y = 3E -12x3 - 2E -07x2 + 0.004x - 18.961
R2 = 0.5419
0.0 10.0 20.0 30.0 40.0 50.0 60.0 70.0 80.0 90.0 100.0
£20,000 £25,000 £30,000 £35,000 £40,000 £45,000 £50,000 £55,000 £60,000
Average inc ome in eac h ward in 2005
Percentage aged 4 to 10 not in maintained
[image:15.595.109.498.489.749.2]3. Pupil age and ‘missing’ pupils
In the previous section data in the LPD were compared with data from the 2001 national census, to show the statistical relationship between affluence and the proportion of children not accounted for by the maintained school record. That relationship was slightly stronger, in the sense of being more linear, for secondary pupils than for primary pupils. This section opens with similar comparison to determine whether there is a relationship between age and children ‘missing’ state education.
[image:16.595.75.499.309.638.2]Figure 3 confirms that the tendency for children to be missing from state education is age related. In all age groups, children of primary school age are more likely than of young people of secondary school age to be accounted for by the maintained school record.
Figure 3. Percentage of 2002 locally resident population attending
maintained schools, by age group
Source: 2002 LPD and 2001 Census of population.
In particular, there is a marked fall in the percentage of young people aged 15 at the start of the school year accounted for by the maintained school record. These children are ‘missing’ from the last year of compulsory education, at the end of which pupils sit GCSE and other public examinations. Some of the missing pupils will have transferred to private, fee-paying, tutorial colleges to prepare for those summer public examinations. Records of pupils attending
85.6
90.4 90.8 90.7 90.2
91.7 90
90.8 91.1
91.4 90.6
78.2
81.7 80.9
82.6 81.3
84.5 86.5 83.6
86.1 87.1 86.0
70 75 80 85 90 95
15 14 13 12 11 10 9 8 7 6 5
Agee
% on roll in m aintained s c hools
from maintained schools to the private sector will appear to ‘go missing’ from the record. Other pupils will have left the roll of a mainstream maintained school for a range of reasons, including exclusion, to be placed on the roll of a local authority Pupil Referral Unit (PRU). Records of pupils on roll in PRUs are also not included in the LPDs between 2002 and 2005, but total numbers by age group have been provided by the DCSF, and these are discussed further below. For the present, the point is that a number of the ‘missing’ 15 year olds will simply have
transferred to alternative provision in the private or state sector. Others may be missing from education entirely.
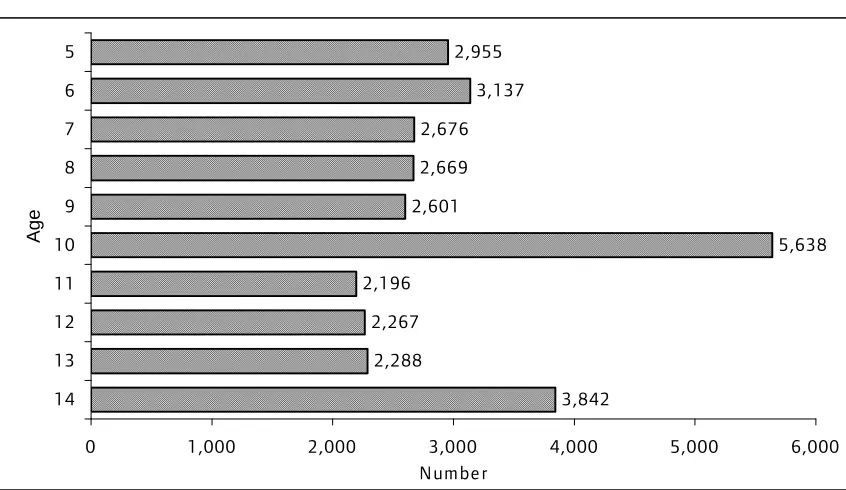
[image:17.595.75.498.478.723.2]The Briefing uses a further way of estimating the number of pupils who are ‘missing’ from maintained schools. Each pupil record in the NPD has a unique pupil number (UPN) which stays with the child throughout his or her time in maintained schooling. The LPD contains a ‘pseudo-UPN’ (i.e. not the original UPN). This means that each pupil’s record in the LPD can be linked from one year to the next, making it possible to identify the number of pupils who were on roll in a maintained school in 2004, were of compulsory school age in 2005, but had no 2005 LPD record. The comparison, then, is between pupils attending maintained schools at two points in time rather than, as previously, between the number of young people on roll in maintained schools and the number of young people in the locally resident population at approximately the same point in time. Figure 4 gives summary information on the number of pupils in individual age groups who were on roll in 2004, but who lacked a record in 2005. As noted above, the 2005 LPD contains records for pupils in London, and also for those living in, or attending schools in, the shire counties and unitary authorities around London. This reduces the likelihood that the large number (30,269 in Figure 4) of missing pupils have simply moved home from London to the shire counties around London.
Figure 4. Pupils aged 5 to 14 in 2004 with a record in the 2004 LPD.
Number with no 2005 LPD record
Source: merged trimmed 2002 2003 20004 2005 LPD
3,842 2,288
2,267 2,196
5,638 2,601
2,669 2,676
3,137 2,955
0 1,000 2,000 3,000 4,000 5,000 6,000
14 13 12 11 10 9 8 7 6 5
Age
Figure 4 confirms that the final year of compulsory education is a peak year for children to be missing from state education. A little under 4,000 14 year olds, who were on roll in 2004 were missing from the record in 2005, when they would have been in the final year of compulsory schooling. One possibility, raised above, is that children missing the final year of compulsory schooling will have transferred to a Pupil Referral Unit (PRU) and, as noted, records for pupils on full-time roll of a PRU are not included in the LPD. Such children would appear to be ‘missing’ from the 2005 LPD record. The number on roll in London’s Pupil Referral Units is shown in Table 3, and that roll is simply not large enough to account for the number missing from the last year of compulsory schooling.
Table 3. Pupils on full-time roll in Pupil Referral Units in London,
2004 to 2006
9Pupil age at 31st August prior to the start of the school year
under 2 and 3 4 5 6 7 8 9 10 Inner London 2004 0 0 0 0 0 10 10 10 20 Inner London 2005 0 0 0 0 10 10 10 10 20 Inner London 2006 0 0 0 0 10 10 10 10 20
Outer London 2004 0 0 0 # 10 10 10 20 20 Outer London 2005 0 0 0 # # # 10 10 10 Outer London 2006 0 0 0 # # 10 10 30 10
Greater London 2004 0 0 0 10 10 20 30 30 40 Greater London 2005 0 0 0 10 10 10 20 20 30 Greater London 2006 0 0 0 0 10 20 20 40 40
Pupil age at 31st August prior to the start of the school year
11 12 13 14 15
Inner London 2004 20 90 140 300 650 Inner London 2005 10 60 160 470 1,130 Inner London 2006 10 70 180 490 1,040 Outer London 2004 20 100 180 320 730 Outer London 2005 20 90 190 340 720 Outer London 2006 20 70 170 390 810 Greater London 2004 30 190 320 630 1,380 Greater London 2005 30 150 350 810 1,850
Greater London 2006 30 130 350 880 1,850 Source: DCSF
happen. When a child changes school, the ‘old’ school is obliged by law to pass his or her records to the ‘new’ school, and schools are provided with school-to-school (S2S) computing software and a common transfer form to assist in this. However, it may be that pupil records are particularly at risk of being lost when children change schools, and it is clearly important that schools’ use of S2S is kept under regular review and that any improvements needed are made.
On the other side of the coin, a child must be recorded on the school roll if the school is to receive funding for the child, and that record includes each pupil’s admission date. Newly admitted pupils can be identified by their admission date, and pupils who had a 2005 LPD record but no matching 2004 record can also be identified. If the issue is one of missing records rather than missing children, then the number of children ‘missing’ after 2004 will be balanced by the number of pupils newly arrived on a school’s roll in 2005 and who had no 2004 record.
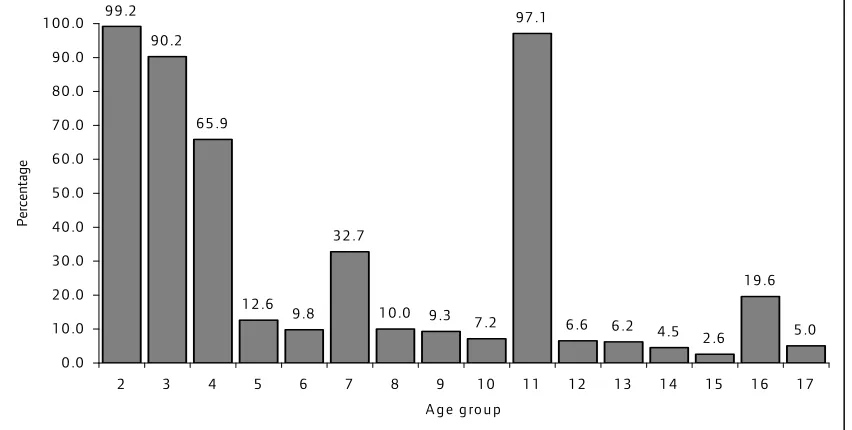
Figure 5 is based on all records in the 2005 LPD, including records for pupils in the shire counties and unitary authorities around London, and shows the total percentage of pupils who were newly admitted to their current school in the 2004/05 school year. For example of 154,400 11 year olds, 97.1 per cent (N=149,853) were newly admitted, and 19.6 per cent (N=13,062) of the 66,754 pupils aged 16 were newly admitted. This is consistent with what might be expected given the structure of maintained mainstream schooling. With few
exceptions this is organised in two phases, with primary schools catering for pupils aged 4 to 10, and secondary schools providing for young people in the compulsory school age range 11 to 15. Pupils aged 2 to 4 are ‘new beginners’ in education, and the comparatively high
proportion of newly admitted pupils aged 7 will reflect the division of primary provision in some instances between infant and junior schools, where age 7 is the standard age of first year pupils in junior schools. Pupils aged 11 at the start of the school year will with few exceptions, for example where there are middle schools, be in the first year of secondary schooling. Pupils aged 16 are beyond the age of compulsory schooling, and are generally in the first year of the Sixth Form in secondary schools. Some movement of pupils between schools can be expected at that point as young people select those schools offering preferred post-compulsory courses.
However, the major point of Figure 5 is that 15 year olds were least likely of any age group to be newly admitted to their current school. Figure 6 shows the number of pupils living in London in 2005 who had no 2004 LPD record, and is consistent with Figure 5. Fifteen year olds are the least likely of the compulsory age groups to be newly admitted to a school in 2005, and the least likely to lack a 2004 LPD record. Percentages aside, in 2005 1,646 London pupils aged 15 had no 2004 record, compared with 3,842 14 year olds in the largely London-based 2004 LPD who had no 2005 records. Even if we assume that all newly arrived pupils in 2005 simply had missing records for 2004, but were actually in London in that year, and that all 15 year olds on roll in PRUs in 2005 were newly enrolled in that year (both of which are highly unlikely), the combined numbers are still not sufficient to account for the 3,842 14 year olds pupils who had an LPD record in 2004, but had no record in 2005.
would, typically, be unable to afford private education. There is a strong likelihood that some children of compulsory school age are simply ‘dropping through the net’.
Figure 3 pointed to a particularly large gap between the number of 15 year olds on roll in maintained schools and the number of 15 year olds in the population as a whole. In line with that, the main focus of this section so far has been on children ‘missing’ from the last year of compulsory schooling. Nonetheless, while the last year of compulsory schooling is a peak year for children to ‘go missing’ from state education, it is not the peak year. The peak year is at the point of secondary transfer.
[image:20.595.77.503.399.614.2]Figure 4 shows that 5,638 pupils aged 10 in 2004 had no LPD record in 2005, and Figure 6 shows that 3,999 11 year olds in 2005 had no 2004 record. Even if we assume that all of those 3,999 pupils were on roll in London in 2004, but that their 2004 record was lost at secondary transfer, the number is still too small to account for the number of 10 year olds in 2004 who had no record in the LPD one year later. These children ‘go missing’ from state schooling at the point of secondary transfer, and the numbers shown may reflect a decision by some parents to opt for private schooling. If this were so, then it would be reasonable to ask why state primary schools should be acceptable to these parents when state secondary schools are not.
Figure 5. Percentage in each age group in 2005 on roll in their current
school for less than a year
Source: merged 2002 2003 2004 2005 LPD
9 9 .2 9 0 .2
6 5 .9
1 2 .6 9 .8 3 2 .7
1 0 .0 9 .3 7 .2 9 7 .1
6 .6 6 .2 4 .5 2 .6
1 9 .6
5 .0
0 .0 1 0 .0 2 0 .0 3 0 .0 4 0 .0 5 0 .0 6 0 .0 7 0 .0 8 0 .0 9 0 .0 1 0 0 .0
2 3 4 5 6 7 8 9 1 0 1 1 1 2 1 3 1 4 1 5 1 6 1 7 A g e g ro u p
Figure 6. Pupils with a 2005 LPD record who lived in London. Number
with no record of being on roll in a maintained school in 2004
Source: 2002 2003 2004 2005 LPD
4. Affluence, poverty and ‘missing’ children
Section 2 used PayCheck information at ward level, linked to individual pupil records in the LPD, and national census data to chart the relationship between affluence and the propensity for children to be missing from state education. This section uses equivalised PayCheck10 income data for the much smaller 2004 full postcode areas, which has also been linked to individual pupil home postcode records in the LPD. The aim here is to review the characteristics of pupils, in their individual 2004 age groups, who were missing from the 2005 LPD record. Approximately 75 per cent of pupil home postcodes were matched to this PayCheck database. While not a complete match, the sample is, as Table 4 shows, large.
PayCheck income data have been grouped into 6 categories; to identify intermediate income groups as well as high and low income groups. All pupils entitled to free school meals have been allocated to the lowest income group. Table 4 shows the number of pupils aged 5 to 14 in 2004 in three of the six income groups, divided into those who had a 2005 LPD record and those who did not; again the aim is to show information for high income, low income and
intermediate income groups.
1,082
2,140 1,646
2,589 2,648
2,723
3,999 3,007
2,980 3,052
3,454 3,468
4,715
0 500 1,000 1,500 2,000 2,500 3,000 3,500 4,000 4,500 5,000 17
16 15 14 13 12 11 10 9 8 7 6 5
Age group
Table 4. Pupils aged 5 to 14 in 2004. Pupil age by three of the six
PayCheck groups in 2004 and roll status in 2005. (Excludes pupils whose
postcodes could not be matched with the PayCheck dataset)
FSM or mean income less than
£18,000 (60% of median) Mean income £25,300 to 32,400 and no FSM Mean income £39,800 to £53,900 and no FSM
No 2005 record
Has 2005
record Total No 2005 record
Has 2005
record Total No 2005 record
Has 2005
record Total Pupil age at start of 2003/4 school year
Number
5 689 23,883 24,572 575 16,380 16,955 542 10,720 11,262 6 706 24,607 25,313 535 16,820 17,355 625 10,496 11,121 7 673 24,280 24,953 490 16,524 17,014 471 10,106 10,577 8 639 23,944 24,583 489 16,458 16,947 446 9,991 10,437 9 624 23,844 24,468 478 16,649 17,127 418 10,006 10,424 10 1,234 22,895 24,129 1,050 16,171 17,221 1,212 8,785 9,997 11 641 22,295 22,936 417 17,138 17,555 271 9,610 9,881 12 681 22,094 22,775 442 17,195 17,637 293 9,398 9,691 13 719 21,506 22,225 415 17,401 17,816 255 9,454 9,709 14 1,466 19,491 20,957 683 17,286 17,969 297 9,192 9,489 Total 8,072 228,839 236,911 5,574 168,022 173,596 4,830 97,758 102,588
Percentage
5 2.8 97.2 100.0 3.4 96.6 100.0 4.8 95.2 100.0 6 2.8 97.2 100.0 3.1 96.9 100.0 5.6 94.4 100.0 7 2.7 97.3 100.0 2.9 97.1 100.0 4.5 95.5 100.0 8 2.6 97.4 100.0 2.9 97.1 100.0 4.3 95.7 100.0 9 2.6 97.4 100.0 2.8 97.2 100.0 4.0 96.0 100.0 10 5.1 94.9 100.0 6.1 93.9 100.0 12.1 87.9 100.0 11 2.8 97.2 100.0 2.4 97.6 100.0 2.7 97.3 100.0 12 3.0 97.0 100.0 2.5 97.5 100.0 3.0 97.0 100.0 13 3.2 96.8 100.0 2.3 97.7 100.0 2.6 97.4 100.0 14 7.0 93.0 100.0 3.8 96.2 100.0 3.1 96.9 100.0 Total 3.4 96.6 100.0 3.2 96.8 100.0 4.7 95.3 100.0 Source: merged 2002 2003 2004 2005 LPD
Table 5. Numbers in income groups as percentage of all pupils shown in
Table 4, and numbers in each income group with missing 2005 record as
a percentage of all pupils with missing 2005 records
Number in each income group as
percentage of all pupils in Table 4 Number in each group with no 2005 record as a percentage of all pupils in Table 4 with no record
Lowest income group 46.2 43.7
Intermediate income group 33.8 30.2
Highest income group 20.0 26.1
Source: merged 2002 to 2005 LPD
PayCheck equivalised income at postcode level could not be matched with approximately 25 per cent of pupil records. Totals in Tables showing PayCheck information will differ from totals based on the full LPD
The percentage of pupils within each age group and selected income group who were ‘missing’ from the 2005 record is shown in Figure 7, and the number of pupils these reflect are shown in Table 4. Amongst pupils aged 5 to 14 in 2004, 8,072 pupils in the lowest income group, 5.574 pupils in the intermediate income group and 4,830 pupils in the higher income group had no LPD record in 2005.
There is a marked difference between the pattern for pupils of primary school age and the pattern for pupils of secondary school age. There is a particularly large difference between the pattern for pupils aged 10 in 2004, who would have transferred to secondary school by 2005, and the pattern for pupils aged 14 in 2004, who would have been in the last year of compulsory education in 2005.
Amongst pupils of primary school age, those in the high income group had the highest
propensity to be missing from the 2005 record. This is particularly so for pupils who were aged 10 at the start of the 2003/4 school year, and who would have transferred to secondary school at the start of the 2004/5 school year (N. ‘missing’=1,212). In the secondary phase, pupils in the least affluent group had the highest propensity to be missing from the 2005 record in most age groups. The propensity for low-income group pupils to be missing from maintained
schooling is especially marked amongst fourteen year olds on roll in 2004 who would (or should) have been in the last year of compulsory schooling in 2005 (N. ‘missing’=1,466).
Figure 7. Percentage within selected income groups on roll in 2004 but
with no 2005 record, by age
Source: 2002 2003 2004 LPD
PayCheck equivalised income at postcode level could not be matched with approximately 25 per cent of pupil records. Totals in Tables showing PayCheck information will differ from totals based on the full LPD
2.8 2.8 2.7 2.6 2.6
5.1
2.8 3.0 3.2
7.0
3.4 3.4
3.1 2.9 2.9
2.8
6.1
2.4 2.5 2.3
3.8
3.2 4.8
5.6
4.5 4.3
4.0
12.1
2.7 3.0 2.6 3.1
4.7
0.0 1.0 2.0 3.0 4.0 5.0 6.0 7.0 8.0 9.0 10.0 11.0 12.0 13.0
5 6 7 8 9 10 11 12 13 14 Total
Pupil age in 2004 FSM or mean income less than
£18,000 (60% of median)
Mean income £25,300 to 32,400 and no FSM
5. Affluence and attainment, and affluence, attainment and children
‘missing’ maintained schooling.
Looked at in terms of national performance indicators, there is a relatively straightforward relationship between affluence and educational attainment. As figures 8 to 10 show,
[image:25.595.79.512.270.639.2]differences in attainment11 exist not simply between children from the poorest and the most affluent areas. There are also differences within the range of intermediate groups. Overall, children from progressively more affluent areas are progressively more likely to reach national educational attainment benchmarks. The graphs present a view of attainment as a ‘staircase’ of advantage, rather than a simple two-fold division between the socially advantaged and the social disadvantaged.
Figure 8. All pupils aged 10. Percentage at levels 4+ in 2004 key stage 2
tests
Source: merged 2002 2003 2004 2005 LPD
PayCheck equivalised income at postcode level could not be matched with approximately 25 per cent of pupil records. Totals in Tables showing PayCheck information will differ from totals based on the full LPD
65.7
61.9
74.5 73.7
69.4
81.1 79.3
75.6
86.0 83.4
80.2
88.6 86.3
83.2
90.8 87.4
83.9
90.5
0.0 10.0 20.0 30.0 40.0 50.0 60.0 70.0 80.0 90.0 100.0
English Mathematics Science
Mean income less than £18,000 (60% of median) or FSM
Mean income £18,000 to £25,200 and no FSM Mean income £25,300 to 32,400 and no FSM Mean income £32,500 to £39,700 and no FSM Mean income £39,800 or £53,900 and no FSM
Figure 9. Pupil aged 10 in 2004. Percentage if pupils reaching nationally
expected levels at key stage 2, by equivalised income level in pupil home
postcode and excluding pupils with no key stage 2 record
Figure 10. Pupils aged 15 in 2004. Percentage of pupils achieving 5 or
more GCSE A*-C grades or equivalent by home area income group
Source for Figures 9 and 10: merged 2002 2003 2004 2005 LPD
PayCheck equivalised income at postcode level could not be matched with approximately 25 per cent of pupil records. Totals in Tables showing PayCheck information will differ from totals based on the full LPD
69.6 69.0
77.4
77.8 74.6 83.4
84.7
79.3
89.5
89.692.5 88.392.0 92.995.0
96.0 93.0 97.4
0 10 20 30 40 50 60 70 80 90 100
English mathematics science
Mean income less than £18,000 (60% of median) or FSM
Mean income £18,000 to £25,200 and no FSM Mean income £25,300 to 32,400 and no FSM
Mean income £32,500 to £39,700 and no FSM
Mean income £39,800 or £53,900 and no FSM
Mean income £54,000 and above
39.5 45.9 55.0 63.8 69.8 70.5 0.0 10.0 20.0 30.0 40.0 50.0 60.0 70.0 80.0 Mean income less than £18,000 (60%
of median) or FSM Mean income £18,000 to £25,200 and no FSM Mean income £25,300 to 32,400 and no
FSM Mean income £32,500 to £39,700 and no FSM Mean income £39,800 or £53,900 and no FSM Mean income £54,000 and above
[image:26.595.75.500.453.694.2]However, the relationship between level of affluence, recorded level of attainment and the tendency to be ‘missing’ from the maintained school record one year later, is more complex than the relationship between educational attainment and social advantage shown in Figures 8 to 10. Amongst 10 year olds, higher levels of affluence are positively associated with pupils lacking key stage assessment records and being ‘missing’ from the maintained school record one year later. Amongst 14 year olds, lower levels of affluence are more likely to be associated with pupils lacking key stage assessment records and ‘being missing’ from the maintained school record one year later.
Figures 11 and 12 provide information for pupils aged 10 and 14 respectively in 2004, showing their propensity to have no LPD record in 2005 and taking account of income and key stage assessments. There is a marked difference between the two phases of education, and the trend in primary schools is virtually the opposite of the trend in secondary schools. Figure 11 is based on appendix Table B4, which shows that that pupils in the lowest of the three income groups were least likely to reach nationally expected levels in the 2004 key stage 2 English test, and were most likely to have no record of attainment. Approximately 1 in 5 pupils in the lowest income group had no record of attainment in that test, compared with (approximately) 1 in 20 pupils in the highest of the three selected income groups. Pupils in the intermediate income group have an intermediate level of missing key stage test records.
At the end of primary schooling, affluence is associated with the likelihood that pupils on roll in 2004 would be missing from the record in 2005. The most affluent group of pupils had the highest propensity to be missing from the maintained school record after the point of secondary transfer, and this applies regardless of the level of attainment in key stage 2 tests. Given what we know about the association between affluence and attainment, and affluence and pupils attending independent secondary schools, this is what we would expect to see. What might be less expected is the relationship between affluence, missing key stage assessment records, and ‘being missing’ from the maintained school record one year later. Amongst the more affluent group of 10 year olds, 291 pupils lacked a key 2 stage 2 English test result, and of these 75 (25.8 per cent) were ‘missing’ from the 2005 LPD record. By contrast, in the lowest income group, 1,938 pupils had no 2004 key stage 4 English test result. Of these, 250 (12.9 per cent) were missing from the 2005 LPD record. There is a distinct possibility that a minority of more affluent parents decide to withdraw their children from the maintained sector at a fairly early stage, and simply withdraw their children from key stage 2 tests.
Figure 12 shows similar information for children ‘missing’ the last year of compulsory education, taking account of income group and educational attainment. The differences shown in Figures 11 and 12 are marked. The propensity to “be missing” from state education immediately after secondary transfer increases with level of affluence, but decreases with level of affluence in the last year of compulsory schooling. Table B3 shows that 3,522 pupils aged 14 who lived in London in 2004 had no matched record of being on roll in 2005. There will, once more, be numbers of pupils from more affluent households who transfer to private education for the final year of compulsory schooling and those transfers go part of the way to explaining the total number of ‘missing’ children. However, those pupils are clearly not typical of all children ‘missing’ the last year of compulsory schooling in state schools.
[image:28.595.75.501.388.642.2]While there are differences between the tendency to be missing from the maintained school roll after the end of primary school and during the last year of compulsory education, there is an area of common ground. Pupils with an incomplete key stage assessment record, and pupils with a low level of attainment in a key stage test, are more likely than other pupils to ‘go missing’ from state education. Where advance notice of that risk is needed, missing key stage assessments records may be one of the factors which could usefully be taken into account.
Figure 11. Pupils aged 10 in 2004. 2004 ks2 English tests in selected
income groups and propensity to be 'not on roll' in 2005
12.9
20.2
25.8
4.4 4.2
6.9
4.4 5.8
12.3
0.0 5.0 10.0 15.0 20.0 25.0 30.0
FSM or mean income less than £18,000 (60% of median) or
FSM
Mean income £25,300 to 32,400 and no FSM
Mean income £39,800 to £53,900 and no FSM
%
'not on roll' in 2005
Figure 12. Pupils aged 14 in 2004. 2003 ks3 English tests in selected
income groups and propensity to be 'not on roll' in 2005
18.4
15.8 15.8
7.4
5.6 5.5
2.9
1.5 1.5
0.0 2.0 4.0 6.0 8.0 10.0 12.0 14.0 16.0 18.0 20.0
Mea n income les s tha n £18,000 (60% of media n)
of F S M
Mea n income £25,300 to 32,400 a nd no F S M
Mea n income £39,800 or £53,900 a nd no F S M
% 'not on rol' in 2005
No record, a bs ent or dis a pplied P upil a s s es s ed a t below level 5
P upil a t level 5+
6. Children ‘missing’ the final year of compulsory schooling, overall raw
score performance in the schools they once attended, and children’s prior
attainment
Section 5 pointed to the relationship between pupil prior attainment and the propensity to be missing from the record of maintained schooling. This section adds to that by taking average pupil attainment in the school attended into account, and by pointing to a substantial range in the percentage of children missing from the final year of compulsory education in different schools.
School improvement has been a key theme in education policy for a considerable period of time and yet, as Figures 8 to 10 showed, there is still a clear association between pupils’ level of social advantage and their level of educational attainment. Pupils with different levels of social advantage also vary in the type of school attended. More particularly, the disadvantage faced by numbers of pupils in the last year of compulsory schooling may both contribute to, and follow from, the circumstances of schools working in challenging circumstances.
Figures 13 and 14 group schools in terms of the average raw score performance at key stage 2 and in public examinations respectively. Raw score performance is measured in point scores, where higher key stage 2 levels, and higher grade public examination passes receive higher point scores.12 The total point score of each pupil in the assessment cohort in each school is totalled to calculate an average total point score for pupils in the school, and schools have then been allocated to one of four groups (quartiles), ranging from the quartile with the highest level of average raw score attainment to the quartile with the lowest level of average raw score attainment.
The percentages shown in Figures 13 and 14 are the percentage in each income group attending a particular type of school. For example, amongst children from the lowest income areas, 28.3 per cent attended schools in the lowest quartile of attainment at key stage 2, 38.7 attended schools in the next to lowest key stage 2 quartile, 23.1 attended schools in the next to highest key stage 2 quartile, and 9.9 per cent attended schools in the highest key stage 2 attainment quartile. The numbers on which Figures 13 and 14 are based are shown in appendix Tables B6 and B7.
Pupils from high income areas are most likely to attend primary schools in the highest raw score key stage 2 attainment quartile, and proportionally more pupils from the lowest income areas than from any other type of income area attend schools in the lowest raw score key stage 2 attainment quartile. A different version of the ‘staircase’ model applies.
intermediate income areas are in an intermediate position in terms of the type of school attended. They are for example, less likely to be found in the highest attaining schools than the pupils from high income areas, but more likely than pupils from the lowest income areas to be found in those schools.
Figure 13. 2004 school average ks2 pupil total point scores in schools
attended by 10 year old pupils from equivalised income groups
Source: merged 2002 2003 2004 2005 LPD See table B6 for related information
28.3
22.3
15.0
8.5 6.9 7.9
38.7
35.7
29.2
21.8
17.7
12.7
23.1
26.4
30.6 32.2
27.3 27.5
9.9
15.6
25.2
37.5
48.1
51.9
0.0 10.0 20.0 30.0 40.0 50.0
M e a n in c o m e le s s th a n £ 1 8 ,0 0 0 (6 0 %
o f m e d ia n ) o r F S M
M e a n in c o m e £ 1 8 ,0 0 0 to £ 2 5 ,2 0 0 a n d
n o F S M
M e a n in c o m e £ 2 5 ,3 0 0 to 3 2 ,4 0 0 a n d n o
F S M
M e a n in c o m e £ 3 2 ,5 0 0 to £ 3 9 ,7 0 0 a n d
n o F S M
M e a n in c o m e £ 3 9 ,8 0 0 o r £ 5 3 ,9 0 0 a n d
n o F S M
M e a n in c o m e £ 5 4 ,0 0 0 a n d
a b o v e
School average total pupil point s
core
Schools in the low est quartile (<73.7143 points)
Figure 14. 2004 school average Section 96 pupil total point scores in
schools attended by pupils aged 15 in selected equivalised income groups
Source: merged 2002 2003 2004 2005 LPD See Table B7 for related information
Figures 15 and 16 provide information for pupils who had a 2004 LPD record but no 2005 record, and in this instance the percentage figures refer to the proportion of pupils with missing 2005 records who had attended schools in different attainment quartiles in 2004. The two age groups are those who were aged 10 and those aged 14 in 2004. The numbers on which the graphs are based are shown in Tables 6 and 7 respectively.
Table 6 Pupils age 10 in 2004. Roll status in 2005 by average total key
stage 2 point scores quartile of school attended in 2004
School 2004 k2 quartile, pupils' average total point score
Lowest quartile <73.7143 Next to lowest quartile >=73.7143 & <79.7586) Next to highest quartile >=79.7586 & <84.6716 Highest quartile
>=84.6716 Total
Number
Pupil on roll in 2004 but not in 2005 969 1,391 1,576 1,702 5,638 2004 pupil with 2005 record 13,094 22,210 21,295 18,963 75,562 Total 14,063 23,601 22,871 20,665 81,200
Percentage
Pupil on roll in 2004 but not in 2005 17.2 24.7 28.0 30.2 100.0 2004 pupil with 2005 record 17.3 29.4 28.2 25.1 100.0
Total 17.3 29.1 28.2 25.4 100.0
Source: Merged 2002 2003 2004 2005 LPD
3 . 5 2 . 7
1 . 4 4 8 . 4
3 3 . 1
2 0 . 4 3 7 . 3 3 8 . 9
3 5 . 8
1 0 . 9
2 5 . 4
4 2 . 4
0 . 0 5 . 0 1 0 . 0 1 5 . 0 2 0 . 0 2 5 . 0 3 0 . 0 3 5 . 0 4 0 . 0 4 5 . 0 5 0 . 0
M e a n in c o m e le s s t h a n £ 1 8 , 0 0 0 ( 6 0 % o f m e d ia n ) a n d / o r F S M
M e a n in c o m e £ 2 5 , 3 0 0 t o 3 2 , 4 0 0 a n d n o F S M
M e a n in c o m e £ 3 9 , 8 0 0 o r £ 5 3 , 9 0 0 a n d n o F S M
Sc hool av er age p up
il total p
oint s
core
S c h o o ls in t h e lo w e s t q u a r t ile < 1 7 4 . 9 6 2 5 p o in t s
S c h o o ls in t h e n e x t t o lo w e s t q u a r t ile > = 1 7 4 . 9 6 2 5 & < 2 6 5 . 3 6 0 9 p o in t s S c h o o ls in t h e n e x t t o h ig h e s t q u a r t ile > = 2 6 5 . 3 6 0 9 & < 3 1 7 . 3 6 9 7 p o in t s
Figure 15. School average total key stage 2 point score per pupil, 2004,
by roll status in 2004 and 2005
[image:33.595.74.502.105.343.2]Source: merged 2002 2003 2004 2005 LPD
Table 7. Pupils aged 14 in 2004. Roll status in 2005 by average total
pupil Section 96 point scores of 15 year olds in school attended in 2004
School quartiles 2004 Sec 96 total pointsLowest quartile <174.9625
Next to lowest quartile >=174.9625 & <265.3609
Next to highest quartile >=265.3609 & <317.3697
Highest quartile
>=317.3697 Total Pupil on roll in 2004 and 2005
Pupil on roll in 2004 but not in 2005 144 2,135 1,186 338 3,803 2004 pupil with 2005 record 2,153 25,445 27,392 19,543 74,533
Total 2,297 27,580 28,578 19,881 78,336
Pupil on roll in 2004 but not in 2005 3.8 56.1 31.2 8.9 100.0 2004 pupil with 2005 record 2.9 34.1 36.8 26.2 100.0
Total 2.9 35.2 36.5 25.4 100.0
Source: Merged 2002 2003 2004 2005 LPD
17.2
24.7
28.0
30.2
17.3
29.4 28.2
25.1
0.0 5.0 10.0 15.0 20.0 25.0 30.0
Schools in the lowest average raw score quartile
(<73.7143)
Schools in the next to lowest average raw score
quartile (>=73.7143 & <79.7586)
Schools in the next to highest raw score quartile (>=79.7586 & <84.6716)
Schools in the highest raw score quartile
(>=84.6716)
School average total
point score per pupil
Figure 16. School average Section 96 total point score per pupil in 2004
12,
by 2005 roll status of pupils aged 14 in 2004
Source: merged 2002 2003 2004 and 2005 LPD
Pupils who had attended primary schools in the highest key stage 2 raw score attainment quartile were more likely than pupils in other primary schools to be missing from the LPD record after the point of secondary transfer. The majority of pupils who were missing from the final year of compulsory schooling had attended schools with comparatively low levels of raw score attainment in public examinations.
However, comparatively few pupils had either been on roll in, or were missing from, schools in the lowest raw score attainment quartile. This reflects the position of pupils in special schools, who are less likely than pupils in mainstream schools to take public examinations. Table 10 confirms that the majority (59.6 per cent) of pupils aged 14 attending schools with the lowest raw score attainment in 2004 were attending special schools. By contrast, the overwhelming majority (99.9 per cent) of pupils aged 14 in 2004 attending schools in the next to lowest quartile of raw score attainment were attending mainstream schools. Allowing for the number of pupils involved, the position is consistent with the view that pupils missing from the last year of compulsory schooling are most likely to have been on the roll of mainstream schools with low levels of raw score attainment compared with other mainstream schools. Schools in the lowest quartile aside, pupils ‘missing’ from the last year of compulsory schooling in 2005 were least likely to have been on roll in schools with high levels of raw score attainment.
3 . 8
5 6 . 1
3 1 . 2
8 . 9 2 . 9
3 4 . 1 3 6 . 8
2 6 . 2
0 . 0 1 0 . 0 2 0 . 0 3 0 . 0 4 0 . 0 5 0 . 0 6 0 . 0
L o w e s t q u a tile (< 1 7 4 . 9 6 2 5 p o in ts )
N e x t to lo w e s t q u a r tile (> = 1 7 4 . 9 6 2 5 &
< 2 6 5 . 3 6 0 9 p o in ts )
N e x t to h ig h e s t q u a r tile (> = 2 6 5 . 3 6 0 9 & < 3 1 7 . 3 6 9 7 p o in ts )
H ig h e s t q u a r tile (> = 3 1 7 . 3 6 9 7 p o in ts )
Per
centage of pupils in each gr
oup of schools
Table 8. Pupils aged 14 attending mainstream and special schools in
2004, by school average total 2004 Section 96 point score in 2005
Lowest quartile (<174.9625 points)
Next to lowest quartile (>=174.9625 & <265.3609 points)
Next to highest quartile
(>=265.3609 & <317.3697 points)
Highest quartile (>=317.3697
points) Total
Number
Secondary, including
Academies and CTCs 928 27,553 28,574 19,875 76,930
Special 1,369 27 4 6 1,406
Total 2,297 27,580 28,578 19,881 78,336
Column percentage
Secondary including
Academies and CTCs 40.4 99.9 100.0 100.0 98.2
Special 59.6 0.1 0.0 0.0 1.8
Total 100.0 100.0 100.0 100.0 100.0
Row percentage
Secondary including
Academies and CTCs 1.2 35.8 37.1 25.8 100.0
Special 97.4 1.9 0.3 0.4 100.0
Total 2.9 35.2 36.5 25.4 100.0
Source: merged 2002 2003 2004 2005 LPD
Table 9 provides further information on the number of pupils missing from the final year of compulsory education in different types of school, excluding schools in the lowest raw score attainment quartile at the end of compulsory schooling. This is cross-referenced with pupil attainment at key stage 3 in 2003, which has also been grouped in quartiles. Figures are for all pupils with an LPD record, some of who would have attended a school outside London.
Nearly two out of three pupils (62.5 per cent) missing from the last year of compulsory schooling were in the lowest key stage 3 attainment quartile, and four out of every 10 pupils (40.1 per cent) missing from the final year of compulsory schooling had attended a school which itself had comparatively low levels of raw score attainment in public examinations in 2004. Seventy per cent of the pupils missing from the final year of compulsory education in ‘low attaining’ secondary schools were themselves in the lowest attaining quartile at key stage three.
Overall, children missing from the final year of compulsory schooling are more likely than other pupils to have had low levels of attainment at key stage 3, and are more likely to have attended schools in the lower quartile of attainment in public examinations. Additionally, children with low levels of attainment at key stage 3 were more likely to be missing from the roll of low attaining secondary schools than similar pupils attending schools in the two highest attainment quartiles in public examinations.
Table 9. Pupils aged 14 in 2004 not on roll in 2005, by attainment at
key stage 3 and school average total point score per pupil in 2004.
All pupils with a 2004 LPD record
2004 secondary school public examination quartile
Next to lowest highest Next to Highest quartiles Total 3 Total number of pupils 27,459 28,384 19,727 75,570 Number on roll in 2004 but not 2005 2,132 1,186 335 3,653 Percentage not on roll in 2005 7.8 4.2 1.7
Number of pupils in lowest pupil quartile at
ks3 10,887 6,204 2,050 19,141
Pupils in lowest pupil quartile at ks3 as a percentage of 14 year olds in each type of
secondary school 39.6 21.9 10.4
Number of pupils in lowest ks3 quartile not on
roll in 2005 1,492 670 121 2,283
Pupils in lowest pupil ks3 quartile not on roll in 2005 as a percentage of all pupils not on roll in
each type of secondary school 70.0 56.5 36.1
Schools have been grouped in quartiles based on the average total Section 26 point scores in 2004 public examination for pupils at the end of the final year of compulsory schooling in each school. Pupils attending schools in the bottom quartile were mainly attending comparatively small special schools, and have been excluded from this Table. Pupil attainment at key stage 3 is measured as the average point score across English, mathematics and science, and pupils have been grouped in quartiles ranging from the highest to the lowest levels of attainment. A point score of zero has been attributed where there is no record of attainment at key stage 3. Schools in the lowest quartile are mainly comparatively small special schools, and have been excluded from this Table
Source: merged 2002 2003 2004 2005 LPD
Table 9 provides a ‘staircase’ view of children missing from the final year of compulsory schooling, which echoes the ‘staircase’ picture of attainment given in Figures 8 to 10. The highest number and proportion of pupils missing from the final year of compulsory schooling had attended schools with comparatively low levels of raw score attainment in public
examinations, and themselves had comparatively low levels of performance at key stage 3.
Schools in highest quartile of raw score attainment in public examinations tended to have fewer pupils, both in total and proportionally, missing from the final year of compulsory schooling. Schools in that quartile also tended to have fewer pupils with comparatively low levels of attainment at key stage 3, and of these a lower proportion than in schools with low raw score attainment was missing from the final year of compulsory education in 2005. Schools with raw score public examination performance in between those two quartiles tended to have
intermediate rates and numbers of pupils with low attainment at key stage 3 or pupils missing the last year of compulsory education.
schooling in 2005, who attended schools maintained by London boroughs in 2004 (that is, on this occasion pupils are grouped by the maintaining authority of the school attended rather than by home borough).
Table 10. Pupils aged 14 in 2005 by maintaining London local authority of
the special or mainstream school attended in 2004. Roll status in 2005
Pupil on roll in 2004 but with no 2005 record
2004 pupil with
2005 record Total
% missing 2004 School maintaining LA
Camden 57 1,450 1,507 3.8
Hackney 124 1,309 1,433 8.7
Hammersmith and Fulham 94 1,146 1,240 7.6
Haringey 117 2,071 2,188 5.3
Islington 132 1,371 1,503 8.8
Kensington and Chelsea 26 582 608 4.3
Lambeth 121 1,403 1,524 7.9
Lewisham 177 2,194 2,371 7.5
Newham 283 3,263 3,546 8.0
Southwark 205 2,229 2,434 8.4
Tower Hamlets 166 2,436 2,602 6.4
Wandsworth 160 1,854 2,014 7.9
Westminster 58 1,357 1,415 4.1
Barking and Dagenham 170 1,929 2,099 8.1
Barnet 85 3,357 3,442 2.5
Bexley 134 3,224 3,358 4.0
Brent 121 2,621 2,742 4.4
Bromley 113 3,485 3,598 3.1
Croydon 210 3,698 3,908 5.4
Ealing 111 2,604 2,715 4.1
Enfield 144 3,530 3,674 3.9
Greenwich 176 2,491 2,667 6.6
Harrow 61 2,171 2,232 2.7
Havering 90 3,017 3,107 2.9
Hillingdon 98 2,910 3,008 3.3
Hounslow 134 2,624 2,758 4.9
Kingston upon Thames 36 1,455 1,491 2.4
Merton 83 1,531