Submitted27 June 2016
Accepted 6 August 2016
Published31 August 2016
Corresponding author
Laura Taillebois,
Academic editor
Robert Toonen
Additional Information and Declarations can be found on page 14
DOI10.7717/peerj.2418
Copyright
2016 Taillebois et al.
Distributed under
Creative Commons CC-BY 4.0
OPEN ACCESS
Characterization, development and
multiplexing of microsatellite markers
in three commercially exploited reef
fish and their application for stock
identification
Laura Taillebois1,2, Christine Dudgeon3, Safia Maher3, David A. Crook1,
Thor M. Saunders4, Diane P. Barton1,4, Jonathan A. Taylor4, David J. Welch5,
Stephen J. Newman6, Michael J. Travers6, Richard J. Saunders7,8and
Jennifer Ovenden3
1Research Institute for the Environment and Livelihoods, Charles Darwin University, Darwin, Northern Territory, Australia
2North Australia Marine Research Alliance, Arafura Timor Research Facility, Darwin, Northern Territory, Australia
3Molecular Fisheries Laboratory, School of Biomedical Sciences, University of Queensland, Brisbane, Queensland, Australia
4Fisheries Research, Northern Territory Department of Primary Industries and Fisheries, Berrimah, Northern Territory, Australia
5C
2O Fisheries, Cairns, Queensland, Australia
6Western Australian Fisheries and Marine Research Laboratories, Department of Fisheries, Government of Western Australia, North Beach, Western Australia, Australia
7Centre for Sustainable Tropical Fisheries and Aquaculture, James Cook University, Douglas, Queensland, Australia
8Animal Science, Queensland Department of Agriculture and Fisheries, Brisbane, Queensland, Australia
ABSTRACT
Thirty-four microsatellite loci were isolated from three reef fish species; golden snapper
Lutjanus johnii, blackspotted croakerProtonibea diacanthusand grass emperor Lethri-nus laticaudis using a next generation sequencing approach. Both IonTorrent single reads and Illumina MiSeq paired-end reads were used, with the latter demonstrating a higher quality of reads than the IonTorrent. From the 1–1.5 million raw reads per species, we successfully obtained 10–13 polymorphic loci for each species, which satisfied stringent design criteria. We developed multiplex panels for the amplification of the golden snapper and the blackspotted croaker loci, as well as post-amplification pooling panels for the grass emperor loci. The microsatellites characterized in this work were tested across three locations of northern Australia. The microsatellites we developed can detect population differentiation across northern Australia and may be used for genetic structure studies and stock identification.
SubjectsAquaculture, Fisheries and Fish Science, Genetics, Genomics
INTRODUCTION
Microsatellites are hypervariable, nuclear-encoded and codominant-inherited markers used for a variety of aquaculture and fisheries applications, including determining the spatial extent of fisheries stocks and other important applications of population genetics.
De novodiscovery of microsatellites is required for analyses in the laboratory with each non-model species studied; however the costs are high and the procedure involving cloning is time-consuming (Peters et al., 2009). The alternative tode novodevelopment is cross-species amplification where existing microsatellite loci of related species are used on the target species; but this is often hampered by the lack of conserved flanking sequences of microsatellites or the lack of data on related species. The adoption of Next-Generation Sequencing (NGS) by researchers using microsatellite loci has made the discovery of microsatellite markers easier (Gardner et al., 2011) and is becoming the preferred method for developing microsatellites (Abdelkrim et al., 2009;Castoe et al., 2010;Fernandez-Silva et al., 2013). Once the microsatellites are identified, major cost and time reductions in the laboratory are achieved through polymerase chain reaction (PCR) multiplexing. The challenge of PCR multiplexing is to combine several microsatellite primers into one PCR cocktail to amplify several microsatellite loci at the same time.
Herein, we describe the discovery, characterization, development and multiplexing of microsatellite loci of three reef fish species of commercial and recreational significance: golden snapper (Lutjanus johnii, Lutjanidae), blackspotted croaker (Protonibea diacanthus, Sciaenidae) and grass emperor (Lethrinus laticaudis, Lethrinidae).Lutjanus johnii,is a highly prized sport and food fish and is harvested in the commercial, recreational, charter and indigenous sectors of northern Australia and many other fisheries worldwide (Allen, Swainston & Ruse, 1997). The catch ofL. johniihas been declining in the Northern Territory since 1997 and this species is considered overfished (Grubert et al., 2013;Saunders et al., 2014a). Sciaenids form the basis of commercial and recreational fisheries of tropical and temperate regions worldwide (Lenanton & Potter, 1987;Rutherford et al., 1989) and several large species are considered threatened or vulnerable due to over-fishing (Rao et al., 1992;
Saunders et al., 2014b;True, Loera & Castro, 1997). Among Sciaenid species,P. diacanthus
is vulnerable to over-exploitation because of its predictable aggregating behavior (Bowtell, 1995;Bowtell, 1998;Phelan, Gribble & Garrett, 2008).Lethrinus laticaudisis considered an excellent eating fish and is targeted by commercial fishers and recreational anglers across northern Australia (Coleman, 2004). AlthoughL. laticaudisis considered robust to fishing pressure (Grubert, Kuhl & Penn, 2010) due to its high reproductive capacity (i.e., serial batch spawners, high spawning frequency, high batch fecundity) (Ayvazian et al., 2004), it is heavily exploited in some areas. These three fish species are of high economic value and the sustainability of the fisheries they support is potentially threatened by over harvesting and thus requires the development of suitable management programs. The development of genetic tools is necessary to further investigate their population genetics and assess stock structure.
discovery using genomic sequencing and multiplexing. Finally, we explore the relevance of the described microsatellite markers for further population genetics by looking at the genetic differences found between two locations in the Northern Territory for the three study species. This will inform us on the potential to use these markers for the identification of stocks for management purposes. This is the first report of the nuclear genomes of the three study species and provides useful baseline information for future genetic studies of these important species.
MATERIALS AND METHODS
Sample and extraction
Samples selected for the production of the microsatellite loci were derived from muscle tis-sue collected by the Northern Territory Department of Primary Industries and Fisheries and the Western Australian Department of Fisheries under Charles Darwin University Animal Ethics permit A13014. TheL. johniisample was a 210 mm male caught at 6 m depth in Dar-win Harbour, Northern Territory, Australia (Middle Arm, 130◦5800.2400E, 12◦3900.9700S) in 2013. The P. diacanthus sample was a 890 mm male caught in Fenton patches, Northern Territory, Australia (130◦42.0840E, 12◦10.6640S) in 2013. The L. laticaudis
sample (WAM16-001) was a 419 mm male collected from East of the Lacepede Islands, Western Australia, Australia in 2013. Genomic DNA fromL. johniiandP. diacanthuswas extracted using Qiagen DNeasy Blood & Tissue columns (Qiagen, Germantown, MD, USA) following the manufacturer’s instructions.Lethrinus laticaudisgenomic DNA was extracted using a salting-out method as described inBroderick et al. (2011). Genomic DNA from all samples for testing the loci and further genotyping was extracted using ISOLATE II Genomic DNA Kit (Bioline) following the manufacturer’s instructions. This resulted in 100µL of eluted DNA for each sample. All the DNA extracts were quantified using the Qubit v3 (ThermoFisher) fluorometric method.
Next-generation sequencing and primer selection
The purified genomic DNA ofL. johniiandP. diacanthuswas prepared for direct shotgun sequencing using the Iron ExpressTM fragment library kit and sequenced on an IonTorrent Personal Genome Machine using an Ion318 chip (Life Technologies Corporation, Grand Island, NY, USA). The purified genomic DNA of L. laticaudis was sequenced on an IlluminaR
MiSeq as part of a 2×300 bp run at the Australian Genome Research Facility. Because two different NGS platforms were used to scan the genomes of the three species we were able to compare their performance for microsatellite design and to assess whether equivalent results were obtainable from each platform.LutjanusandLethrinusgenera and Sciaenidae are known to have genome size comparable to other fish species (average size for
Lutjanus=1,066 Mb,Lethrinus=1,192 Mb, Sciaenidae=753 Mb, Perciformes=919 Mb;
Gregory, 2001). The paired-end reads obtained with the MiSeq run were merged using FLASH source code (Magoč & Salzberg, 2011) and their quality was checked in FastQC (Andrews, 2010); the first 10 bp were trimmed in Geneious v 9.0 (Kearse et al., 2012).
for microsatellite motifs and forward and reverse primers were designed using the software QDD2 beta (Meglécz et al., 2010). Sequences with target microsatellites and primers were then filtered according to the following criteria: only pure repeats were selected; all dinucleotide repeats were excluded; repeats greater than eight were selected; loci with a predictive target sequence length above 300 bp were selected; primers with a distance less than 20bp from the repeat sequence were excluded; and the PCR primers with a PCR_PRIMER_ALIGNSCORE equal or above 6 were excluded to discard primers with high alignment scores to the amplicon. A unique pair of primers was selected for each locus. The PCR predicted sequences for all the loci were imported into Geneious v 9.0 and blasted (MEGABLAST) against the NCBI GenBank database to check if the microsatellites fell into coding regions. Sequences that would be homologous to any other NCBI sequence likely to be functional were excluded. All the primers were blasted against their original genomic database built using the NGS reads. Only microsatellites with primers that had one hit across the whole genome were kept for further steps to increase the chance of each primer to amplify a unique sequence. As a final check point before wet laboratory work and to make sure each pair of primers bound to the 50and 30ends of a unique sequence containing a microsatellite we selected, containing microsatellites sequences and pairs of primers were mappedde novo. For each species, we selected the 48 microsatellites that contained the best quality repeats with the highest number of tri- tetra- or penta-nucleotide repeats possible and with no small dinucleotide repeats between the primer and the microsatellite sequence to avoid any noise that may interfere with scoring genotypes.
Forward primers were tagged on the 50 end with the universal CAG sequence (50 -CAGTCGGGCGTCATCA-30). Inclusion of the 50-tail will allow use of a CAG-tagged universal primer in the PCR that is fluorescently labeled for detection on the sequencing machine (Schuelke, 2000). Additionally, a pig-tail (50-GTTTCTT-30) was added to the 50end of the reverse primers to increase the accuracy of genotyping and ensure the consistency of the amplicon size (Brownstein, Carpten & Smith, 1996). The resulting 48 pairs of primers were synthetized by Integrated DNA Technologies (www.idtdna.com).
Loci and primers testing
set down by the manufacturer. Chromatograms were analysed using Geneious v 9.0 (Kearse et al., 2012).
Criteria used to select the best loci among the 48 tested for each species included the amplification success rate, peak intensity, the presence or absent of stutter peaks, the polymorphism of the loci, the number of alleles and heterozygosity. The best loci were individually tested against a further 23 samples of the target species.
Multiplex optimization of PCR
In order to reduce the cost and time of genotyping for further genetic studies, the newly designed microsatellites were combined into multiplex panels of 2–4 loci. The panels were set up based on the microsatellite allele-size range. The primers for all the loci of each panel were combined in a single PCR to allow the amplification of several microsatellite loci at the same time. When allele-size ranges overlapped, alternate dyes were employed to allow the discrimination of each locus on the chromatograms. Each of the four ABI dyes FAM, VIC, NED and PET were tailed with a unique M13 primer: M13F (50-TTTCCCAGTCACGACGTTG-30), M13V (50 -GCGGATAACAATTTCACACAGG-30), M13N (50-TAAAACGACGGCCAGTGC-30) and M13P (50-CACAGGAAACAGCTATGACC-30). The 50 end of the forward primer for the locus was synthetized with the corresponding M13 tail to allow fluorescent labeling of PCR product using a 3-primer PCR protocol as described above (Schuelke, 2000). Several multiplex trials were conducted to find the best combination of loci with the optimal concentration of primers and PCR parameters. Primer pairs that failed to amplify within a multiplex were removed from the panels and further optimization focused on the remaining primer pairs. For each species, the multiplex trials were all evaluated against eight samples that were the same for those used in the 23 samples above, allowing the consistency to be checked across the templates.
Genetic variability and population genetics
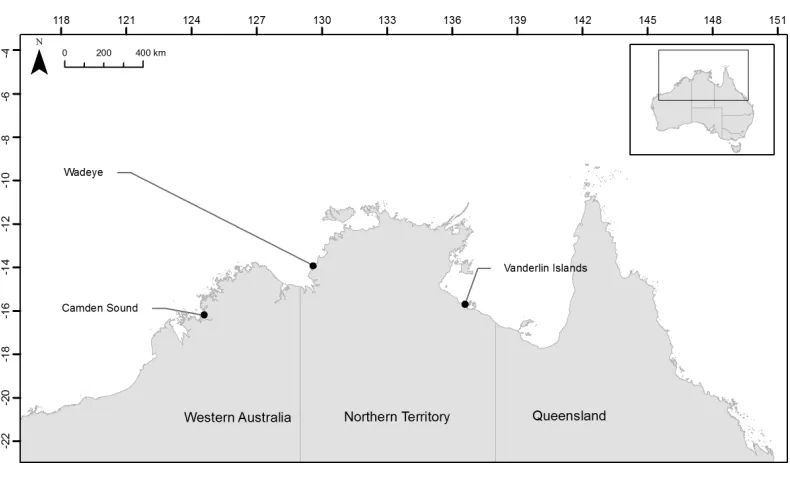
In order to test if the herein developed microsatellites would be useful to discriminate fish stocks across northern Australia we collected samples from two locations in the Northern Territory and one location in Western Australia and assayed their population structure. For each of the three species, samples were collected from Camden Sound (Western Australia, Australia), Wadeye (Northern Territory, Australia) close to the Western Australia border and Vanderlin Islands in the bottom of the Gulf of Carpentaria (Northern Territory, Australia) (Fig. 1). FourteenL. johnii, eighteenP. diacanthusand twenty-eightL. laticaudis
Figure 1 Location of the three sampling sites across northern Australia.
primers were adjusted to obtain homogenous PCR products revealed by similar intensity chromatogram peaks for each of the dyes within each panel. The heating cycle parameters, sizing of the alleles and chromatogram analyses were conducted using the same method as stated above.
The obtained datasets were statistically evaluated. The potential for null alleles, large allele dropout and stuttering to interfere with scoring accuracy was evaluated for each microsatellite locus in each sample using Microchecker v.2.2.3 (Van Oosterhout et al., 2004). The software Arlequin 3.5.2.2 (Excoffier & Lischer, 2010) was used to calculate the number of alleles (A), expected (He) and observed (Ho) heterozygosity and conduct exact tests of conformance of genotypic proportions to Hardy–Weinberg equilibrium expectations. Estimation of probability values (PHW) employed a Monte Carlo Markov Chain (MCMC) of 105 steps and 5×10⁴ dememorization. Genotypic equilibrium between pairs of microsatellites (linkage disequilibrium) was tested in Arlequin with 10,000 permutations. Fixation indices (FST) between pairs of sample localities were estimated as implemented in Arlequin to identify possible spatial boundaries among sample locations.
RESULTS AND DISCUSSION
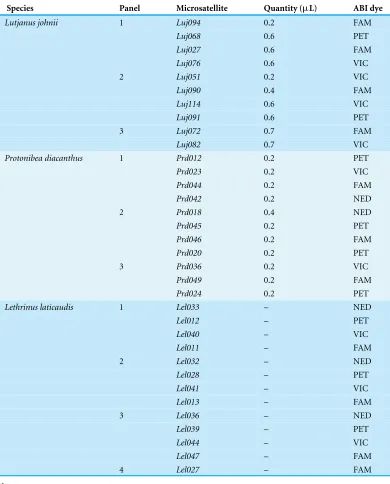
Table 1 Technical details on the multiplex polymerase chain reaction (PCR) and post-PCR pooled products of microsatellite loci inLutjanus johnii,Protonibea diacanthusandLethrinus laticaudis. Included in the table are the multiplex PCR panels forL. johnii,P. diacanthusand post-PCR pooled products panels forL. laticaudis, primer mix quantities per reaction (µL) within each multiplex and fluorescent dye labels used for each locus in the PCR reactions.
Species Panel Microsatellite Quantity (µL) ABI dye
Lutjanus johnii 1 Luj094 0.2 FAM
Luj068 0.6 PET
Luj027 0.6 FAM
Luj076 0.6 VIC
2 Luj051 0.2 VIC
Luj090 0.4 FAM
Luj114 0.6 VIC
Luj091 0.6 PET
3 Luj072 0.7 FAM
Luj082 0.7 VIC
Protonibea diacanthus 1 Prd012 0.2 PET
Prd023 0.2 VIC
Prd044 0.2 FAM
Prd042 0.2 NED
2 Prd018 0.4 NED
Prd045 0.2 PET
Prd046 0.2 FAM
Prd020 0.2 PET
3 Prd036 0.2 VIC
Prd049 0.2 FAM
Prd024 0.2 PET
Lethrinus laticaudis 1 Lel033 – NED
Lel012 – PET
Lel040 – VIC
Lel011 – FAM
2 Lel032 – NED
Lel028 – PET
Lel041 – VIC
Lel013 – FAM
3 Lel036 – NED
Lel039 – PET
Lel044 – VIC
Lel047 – FAM
4 Lel027 – FAM
Notes.
IonTorrent reads showed that the quality of the sequencing decreased with length meaning that the end of the longer reads (>325 bp) had a lower quality then at their start. QDD Pipe1 detected between 110,000 and 170,000 sequences containing a microsatellite sequence depending on the species (Table 2). This number was independent of the type of NGS platform used. From those sequences QDD Pipe2 removed the low complexity sequences (no BLAST to itself), putative minisatellites (short sequences of repeated nucleotides) and sequences that had BLAST hit to other sequences to only keep the singletons and unique consensus sequences. QDD Pipe3 designed primers for all QDD Pipe2 output reads. The resulting number of sequences that contained a microsatellite sequence and the corresponding primers were given in the final output of QDD pipeline, and varied between 20,000 and 30,000 depending on the species (Table 2). After applying the filtering criteria described previously, 97 potentially amplifiable microsatellite reads were found for P. diacanthus, 121 forL. johnii and 103 forL. laticaudis. From those microsatellite reads, we selected the ones with the smallest number of repeats but greater than eight and eliminated those with small repeats between the primer and the microsatellite to reach 48 microsatellite loci per species being ultimately tested in the laboratory.
The testing of 144 primer pairs resulted in the selection of 34 polymorphic loci that could be reliably scored and showed consistent amplification success. We selected a final set of 10 loci forL. johnii, 11 loci forP. diacanthusand 13 loci forL. laticaudis(Table 3). Multiplex panels of microsatellites were developed for the two speciesL. johniiandP. diacanthus, and the optimization of each panel resulted in the efficient assay and unambiguous scoring of microsatellites in the two species. Although the M13 labeling system worked very well forL. johniiandP. diacanthusit did not amplify successfully as part of PCR multiplexes for L. laticaudis. The reasons why it did not work well for this species are still unclear as the quality of the DNA was even across the three species and the same protocol was followed. However, in-house experiments showed that lengthening the labeled forward primer might facilitate the PCR reaction when multiplexing several loci. Direct labeling of the forward primer may also be another option for multiplexing a large number of loci. For
L. laticaudis, the loci were all amplified in individual PCR with the CAG labeling system as described above. The resulting PCR products were then pooled according to the panels described inTable 1before the ABI run.
Genotypes from 10 microsatellites were obtained from multiplexed PCR for 68 individuals ofL. johnii. There was 1.91 % missing data and the number of alleles for each locus varied between 4 and 23 (Table 3). Microchecker indicated the possible occurrence of null alleles at location Wa for locusLuj012and at CS for locusLuj018with possible stuttering or scoring errors for the latter. There were only 3/45 significant tests for linkage disequilibrium between pairs of loci (Luj094 ×Luj051,Luj051 ×Luj091 andLuj076 ×Luj082) and there was no deviation from Hardy–Weinberg equilibrium (HWE) detected.
Table 2 Next-generation sequencing and bioinformatics details obtained from FastQC software (Andrews, 2010) and QDD pipeline (Meglécz et al., 2010) forLutjanus johnii, Protonibea diacanthusandLethrinus laticaudis.
Lutjanus johnii Protonibea diacanthus Lethrinus laticaudis
Genomic DNA extraction Qiagen DNeasy Qiagen DNeasy Salting out
NGS Technology IonTorrent|Ion318Chip IonTorrent|Ion318Chip IlluminaR
MiSeq
Library preparation Iron ExpressTM Iron ExpressTM
Type of reads Single reads Single reads Paired-end reads
Number of reads 1,374,891 1,587,789 2,800,640
Merged reads – – 1,169,198
Reads length 8–620 8–618 300
Merged reads length – – 300–575
FASTQC
% GC 41 42 39
Sequence quality<Phred 20 yes at positions>325 bp yes at positions>350 bp no
Per sequence quality—Phred score 29 29 36
Sequence length distribution peak at 350 bp peak at 350 bp plateau at 520–540 bp
QDD2
QDD2 pipe 1—Sequence preparation and microsatellite detection
Number sequence length≥80 bp 1,235,685 1,405,082 1,169,198
Number sequence with microsatellite 109,641 (8.9%) 167,702 (11.9%) 130,269 (11.1%)
QDD2 pipe 2—Sequence similarity detection
Total # input sequences 109,641 167,702 130,269
Numer of unique consensus sequences 18,978 N/A N/A
Number of singleton sequences 49,122 N/A N/A
Number of reads in output 68,100 63,789 69,714
QDD2 pipe 3—Primer design
Total number of input sequences 68,100 63,789 69,714
Total number of sequences with target MS 67,461 63,785 69,714
Total number of sequences with primers 29,485 20,233 19,867
Filtering QDD output
Total # input sequences 29,485 20,233 19,867
Total # sequences after filtering criteria 121 97 103
null alleles at location CS for locusPrd068and at VI for locusPrd012. There were only 3/55 significant tests for linkage disequilibrium between pairs of loci (Prd046 ×Prd018,
Prd020 ×Prd018 and Prd018×Prd045) and overall deviations from Hardy–Weinberg equilibrium (HWE) were detected at two lociPrd023(p-value=0.034) andPrd018(p-value =0.008). Heterozygosity was variable and with an overall mean lower than forL. johnii
(0.673±0.185). Genotypes from 10 microsatellites were obtained from pooled post PCR products for 84 individuals ofL. laticaudisas three of our developed microsatellites did not amplified consistently in all the samples. There was 2.61% missing data and the number of alleles for each locus varied between 9 and 22 (Table 3). Microchecker indicated the possible occurrence of null alleles at location CS for lociLel033andLel012.There were 6/78 significant tests for linkage disequilibrium between pairs of loci (Lel040 ×Lel012,
Table 3 Characteristics of the 34 microsatellite markers developed inLutjanus johnii,Protonibea diacanthusandLethrinus laticaudis.
Species Locus Primer sequences (50
–30
) (fluorescent label) Repeat motif
GenBank accession no.
n Allele size range (bp)
#A HO HE PHW
Lutjanus johnii Luj027 F: CTGGGCCACACTGATAAAGC (FAM) (AGC)9 KX387441 68 152–179 8 0.309 0.306 0.606
R: GGCTCTGAACCTGGGAGATT
Luj094 F: TCTCAGAGGGTTTGATGCAG (FAM) (AATC)9 KX387437 68 223–239 4 0.426 0.470 0.205
R: CTTTGGCGCTTTCTATCAGC
Luj076 F: CGGGTCGAGTCTGTTTGTGT (VIC) (AAG)15 KX387436 66 200–233 10 0.818 0.811 0.289
R: CTTCAGACGGATTAGCAGCA
Luj068 F: CCTAGGGTGTCAGTGTCAGTCA (PET) (AAAG)20 KX387435 68 174–258 18 0.882 0.936 0.212
R: TGCCTGTATGTTCTCTTGAGC
Luj090 F: ATCCTAATGCATCGTGCTTG (FAM) (AGC)17 KX387444 68 194–278 23 0.868 0.922 0.146
R: GGCATGTTCTATTGAGGTTGG
Luj051 F: TGCAGAGCAACAGAACAACAC (VIC) (ACTG)10 KX387440 67 172–192 6 0.687 0.596 0.377
R: CACCTTGCGTTTGCAGTCT
Luj114 F: CCATAACTGCTGTTCTGTATCTGG
(VIC)
(AGC)9 KX387442 68 276–314 11 0.794 0.739 0.725
R: AATACGGCAGATCTCGGGTT
Luj091 F: TCATTCCCAGGAGCTCAAAT (PET) (ACAG)12 KX387438 64 219–279 12 0.813 0.782 0.499
R: AATCGTCACTTTCGACCCAC
Luj072 F: ACTCGAAGAACACAGCCCAC (FAM) (AGC)9 KX387443 65 192–204 5 0.738 0.675 0.052
R: CACATTTGAATCCTTGCTGG
Luj082 F: AAGTACATCGGAGGGCTGAG (VIC) (ACGAT)12KX387439 65 220–275 12 0.800 0.833 0.548
R: TGTTATCAAAGTTCACCGATACAAA
Protonibea diacanthus Prd044 F: ACAAAGTTTCCTCCTCTGGC (FAM) (AAG)13 KX387452 71 181–211 11 0.746 0.804 0.324
R: CACGTTCCATCTTTATTTATTTGC
Prd023 F: TCGTGTGAACACTTTGATGC (VIC) (ATC)11 KX387448 72 292–316 9 0.875 0.847 0.034
R: CTCGTCTCTGCTCTTGGTCC
Prd042 F: TACCTTTGAGATGCGAGCG (NED) (AGC)12 KX387451 72 230–248 7 0.694 0.698 0.526
R: GTCAAAGCCATCAATCCAGC
Prd012 F: AGGCTGTTTGAACTGCAGGG (PET) (AAAG)20 KX387445 64 195–271 19 0.828 0.898 0.324
R: CATGCTGAGCAATATGTGGG
(continued on next page)
T
aillebois
e
t
al.
(2016),
P
eerJ
,
DOI
Table 3(continued)
Species Locus Primer sequences (50
–30
) (fluorescent label) Repeat motif
GenBank accession no.
n Allele size range (bp)
#A HO HE PHW
Prd046 F: TCATCCTGAGTTTGTGCTGG (FAM) (AGC)9 KX387454 72 224–236 5 0.347 0.351 0.693
R: CATGAGTAAGCAGAGCGTGG
Prd018 F: ATGAACGGCATCAGTCAGC (NED) (ACAG)9 KX387446 68 179–207 8 0.662 0.784 0.008
R: CGTCTGATAAACAGCACTGCC
Prd020 F: CAATGTTCTGCAAGAGCTGC (PET) (ATC)11 KX387447 71 189–216 10 0.746 0.713 0.837
R: TCAAATGTCAAAGTCCAGTCC
Prd045 F: GTCTATCCATGTTCCAGCCC (PET) (ATCC)11 KX387453 64 279–309 8 0.672 0.639 0.400
R: TCATCCCAAAGTGACCAACC
Prd049 F: CCTTGTCCTCCTTTCAGGC (FAM) (ACC)9 KX387455 72 216–234 5 0.278 0.316 0.280
R: GGGTCATTAAACATGGCAGC
Prd036 F: TCACGTGAAGCGTCTACAGC (VIC) (AAG)12 KX387450 72 227–257 9 0.653 0.677 0.746
R: AAAGGAGGAAACACAGAGCC
Prd024 F: AGAGTGTCCGAGTCCAGAGG (PET) (AAG)11 KX387449 72 199–217 6 0.736 0.683 0.892
R: CAGTACCTGGTGATGGGAGC
Lethrinus laticaudis Lel011 F: CTGTCGGAGGTAAAGTGCG (FAM) (AGC)9 KX387422 84 237-285 11 0.655 0.660 0.251
R: CTCATGGTGTTGAGGATGGG
Lel040 F: TGGTTGCAGACAACTGCC (VIC) (AGC)9 KX387431 84 171–216 14 0.821 0.825 0.367
R: CTTAAGAGCAGTGATCCAGGC
Lel033 F: AGTGCGACAAAGAAATGGC (NED) (AGAT)16 KX387428 84 167–143 20 0.893 0.926 0.438
R: CATTTGTCAGTTATGAAACTTGGC
Lel012 F: GCGAGGGTCTGCTACTATAGGG (PET) (AAT)9 KX387423 76 246-334 22 0.711 0.846 0.005
R: TGTAAAGTGTAAACCACGTCCC
Lel013 F: CCTGAACCTGGAGAACTCGG (FAM) (ATC)12 KX387424 82 242–287 10 0.744 0.829 0.150
R: ACTGAGGGAGGAGATAAAGGG
Lel041 F: CTGCTGTTCTGGGTTGCC (VIC) (AAT)19 KX387432 – – – – – –
R: CAACAAGCTGTTGGTGTCCC
Lel032 F: AAATCTGCATTATGAAATTGGC (NED) (AAAG)16 KX387427 83 173–233 16 0.867 0.883 0.209
R: CAGCTCCTTGAGTTTAGTCCC
Lel028 F: CAGTAGCTTTAATAGTTAGGCACCC
(PET)
(AAAG)13 KX387426 83 200–244 14 0.843 0.877 0.954
R: GGCTGTCCAGAGTGAGGC
Lel047 F: AAAGAATGGGAAGAATGACCC (FAM) (AGAT)11 KX387434 – – – – – –
R: AAGCCAAGTGATTAAGAAACCC
Lel027 F: CACTAAGGGTCCATGTTGCC (FAM) (AAT)22 KX387425 79 196–238 15 0.911 0.914 0.480
T
aillebois
e
t
al.
(2016),
P
eerJ
,
DOI
Table 3(continued)
Species Locus Primer sequences (50
–30
) (fluorescent label) Repeat motif
GenBank accession no.
n Allele size range (bp)
#A HO HE PHW
Lel044 F: TTCTACTTGACCCTGGTAGGC (VIC) (ATCC)11 KX387433 83 151–199 11 0.759 0.816 0.268
R: AATGTAATGCCATAAGCGGG
Lel036 F: TCCAATTTACACCAAACTAGGC (NED) (AAAG)15 KX387429 – – – – – –
R: CCGGAATGATCTGCAGGC
Lel039 F: CTTGTAGAGTGTCAACGAGGG (PET) (AAT)11 KX387430 80 196–214 9 0.700 0.764 0.747
R: CATGATGCAATAACCATCCC
Notes.
nis the sample size, #Ais the number of alleles at each loci,HEis the expected heterozygosity,HOis the observed heterozygosity andPHWis thep-value of the exact tests of conformance of genotypic pro-portions to Hardy-Weinberg equilibrium expectations.
T
aillebois
e
t
al.
(2016),
P
eerJ
,
DOI
Table 4 Pairwise FST estimates forLutjanus johnii,Protonibea diacanthus, andLethrinus laticaudis
for three locations. Estimates are based on 10 microsatellite data from 68 individuals ofL. johnii, 11 mi-crosatellite data from 72 individuals ofP. diacanthusand 10 microsatellite data from 84 individuals ofL. laticaudisamong the three sampling locations Camden Sound (CS), Wadeye (Wa) and Vanderlin Islands (VI). The comparisons that differed significantly from zero (p<0.05) are shaded in grey.
Lutjanus johnii Protonibea diacanthus Lethrinus laticaudis
FST p-value FST p-value FST p-value
Wa-CS 0.001 0.308 0.009 0.090 0.017 0.000
Wa-VI 0.007 0.043 0.007 0.069 0.007 0.069
CS-VI 0.006 0.148 0.014 0.013 0.009 0.017
and overall deviations from Hardy–Weinberg equilibrium (HWE) were detected at a single locusLel012(p-value=0.005). Heterozygosity was high and with an overall mean higher than for the two other species (0.834±0.078).
A pattern of genetic differentiation with low but significant population-pairwise FST (range 0.007–0.017) was observed in the three species (Table 4). These levels of differentiation are similar in magnitude to those reported for other marine fish species with potentially high gene flow (O’Reilly et al., 2004). The three species also presented different patterns of structure between the three locations.L. laticaudispresented pairwise differentiation between Western Australia location (CS) and the two other Northern Territory locations (VI and Wa). Similarly,P. diacanthuspresented a structure between the two most distant populations of CS and VI whereas CS and Wa remained undifferentiated. By contrast,L. johniidid not present structure between Western Australia and Northern Territory. However, VI and Wa in the Northern Territory had a significant pairwise FST. Pairwise FSTvalues were low in all comparisons for the three species (range 0.001–0.017) as commonly reported in marine species and, 4 out of 9 pairwise comparisons were significant meaning the microsatellites we developed can accurately detect population differentiation across Northern Australia and may be used for genetic structure studies and stock identification.
CONCLUSION
ACKNOWLEDGEMENTS
The authors thank staff from the Western Australian Department of Fisheries and the Northern Territory Department of Primary Industries as well as Indigenous rangers for sample collection. We extend our thanks to Samuel Williams at the Molecular Fisheries laboratory and Sean Corley at the Animal Genetics Laboratory for their assistance with laboratory work.
ADDITIONAL INFORMATION AND DECLARATIONS
Funding
This research was supported by the Fisheries Research and Development Corporation (Project 2013/017); LT received additional funding support from the North Australia Marine Research Alliance (NAMRA—AIMS/ANU/CDU/NT Government) Postdoctoral Fellowship. The funders had no role in study design, data collection and analysis, decision to publish, or preparation of the manuscript.
Grant Disclosures
The following grant information was disclosed by the authors: Fisheries Research and Development Corporation: 2013/017. North Australia Marine Research Alliance.
Competing Interests
The authors declare there are no competing interests. David J. Welch is an employee of C2O Fisheries, Cairns, Queensland, Australia.
Author Contributions
• Laura Taillebois conceived and designed the experiments, performed the experiments,
analyzed the data, contributed reagents/materials/analysis tools, wrote the paper, prepared figures and/or tables, reviewed drafts of the paper.
• Christine Dudgeon performed the experiments, reviewed drafts of the paper.
• Safia Maher performed the experiments.
• David A. Crook, Diane P. Barton, Jonathan A. Taylor, David J. Welch and Richard J.
Saunders reviewed drafts of the paper.
• Thor M. Saunders, Stephen J. Newman and Michael J. Travers contributed
reagents/materials/analysis tools, reviewed drafts of the paper.
• Jennifer Ovenden conceived and designed the experiments, performed the experiments,
analyzed the data, contributed reagents/materials/analysis tools, reviewed drafts of the paper.
Animal Ethics
The following information was supplied relating to ethical approvals (i.e., approving body and any reference numbers):
DNA Deposition
The following information was supplied regarding the deposition of DNA sequences: GenBank
Lel011KX387422 Lel012KX387423 Lel013KX387424 Lel027KX387425 Lel028KX387426 Lel032KX387427 Lel033KX387428 Lel036KX387429 Lel039KX387430 Lel040KX387431 Lel041KX387432 Lel044KX387433 Lel047KX387434 Luj068KX387435 Luj076KX387436 Luj094KX387437 Luj091KX387438 Luj082KX387439 Luj051KX387440 Luj027KX387441 Luj114KX387442 Luj072KX387443 Luj090KX387444 Prd012KX387445 Prd018KX387446 Prd020KX387447 Prd023KX387448 Prd024KX387449 Prd036KX387450 Prd042KX387451 Prd044KX387452 Prd045KX387453 Prd046KX387454 Prd049KX387455.
Data Availability
The following information was supplied regarding data availability:
Laura Taillebois, Thor Saunders and Ovenden, Jennifer R. (2016): Next-generation sequencing data of grass emperor Lethrinus laticaudis. The University of Queensland. Dataset. Available athttp://espace.library.uq.edu.au/view/UQ:390575.
Laura Taillebois, Thor Saunders and Ovenden, Jennifer R. (2016): Next-generation sequencing data of golden snapperLutjanus johnii. The University of Queensand. Dataset. Available athttp://espace.library.uq.edu.au/view/UQ:390574.
REFERENCES
Abdelkrim J, Robertson BC, Stanton J-AL, Gemmell NJ. 2009.Fast, cost-effective development of species-specific microsatellite markers by genomic sequencing.
Biotechniques46:185–192DOI 10.2144/000113084.
Allen GR, Swainston R, Ruse J. 1997.Marine fishes of tropical Australia and south-east Asia. Perth: Western Australian Museum.
Andrews S. 2010.FastQC: a quality control tool for high throughput sequence data.
Available athttp:// www.bioinformatics.babraham.ac.uk/ projects/ fastqc.
Ayvazian S, Chatfield B, Gaughan D, Keay I, Nowara G. 2004.The age, growth, repro-ductive biology and stock assessment of grass emperor,Lethrinus laticaudisin Shark Bay, Western Australia. Final report 2000/189. Fisheries Research and Development Corporation, Deakin, 82p.
Bowtell B. 1995. Heed jewfish warnings. In:Fish and boat, 4.
Bowtell B. 1998. Huge schools of black jew about. In:Fish and boat, 11.
Broderick D, Ovenden J, Buckworth R, Newman S, Lester R, Welch D. 2011.Genetic population structure of grey mackerelScomberomorus semifasciatusin northern Australia.Journal of Fish Biology79:633–661 DOI 10.1111/j.1095-8649.2011.03055.x.
Brownstein MJ, Carpten JD, Smith JR. 1996.Modulation of non-templated nucleotide addition by Taq DNA polymerase: primer modifications that facilitate genotyping.
Biotechniques20:1004–1006.
Castoe TA, Poole AW, Gu W, Jason de Koning A, Daza JM, Smith EN, Pollock DD. 2010.Rapid identification of thousands of copperhead snake (Agkistrodon contortrix) microsatellite loci from modest amounts of 454 shotgun genome sequence. Molecu-lar Ecology Resources10:341–347DOI 10.1111/j.1755-0998.2009.02750.x.
Coleman APM. 2004.The national recreational fishing survey: the Northern Territory. Fishery Report 72. Department of Business Industry and Resource Development.
DeWoody J, Avise J. 2000.Microsatellite variation in marine, freshwater and anadro-mous fishes compared with other animals.Journal of Fish Biology 56:461–473 DOI 10.1111/j.1095-8649.2000.tb00748.x.
Excoffier L, Lischer HE. 2010.Arlequin suite ver 3.5: a new series of programs to perform population genetics analyses under Linux and Windows.Molecular Ecology Resources10:564–567DOI 10.1111/j.1755-0998.2010.02847.x.
ecologists: a post-sequencing bioinformatics pipeline.PLoS ONE8:e55990 DOI 10.1371/journal.pone.0055990.
Gardner MG, Fitch AJ, Bertozzi T, Lowe AJ. 2011.Rise of the machines– recommendations for ecologists when using next generation sequencing for microsatellite development.Molecular Ecology Resources11:1093–1101 DOI 10.1111/j.1755-0998.2011.03037.x.
Gregory TR. 2001.Animal genome size database.Available athttp:// www.genomesize. com.
Grubert MA, Kuhl PJ, Penn JW. 2010.Ecological risk assessment. Northern Territory coastal line fishery. Fishery Report 103. Northern Territory Department of Re-sources, Palmerston City.
Grubert M, Saunders T, Martin JM, Lee H, Walters CJ. 2013.Stock assessments of selected Northern Territory fishes. Fishery Report 110. Northen Territory Govern-ment, Darwin.
Kearse M, Moir R, Wilson A, Stones-Havas S, Cheung M, Sturrock S, Buxton S, Cooper A, Markowitz S, Duran C, Thierer T, Ashton B, Mentjies P, Drummond A. 2012.
Geneious Basic: an integrated and extendable desktop software platform for the organization and analysis of sequence data.Bioinformatics28:1647–1649.
Lenanton R, Potter I. 1987.Contribution of estuaries to commercial fisheries in temperate Western Australia and the concept of estuarine dependence.Estuaries
10:28–35DOI 10.2307/1352022.
Magoč T, Salzberg SL. 2011.FLASH: fast length adjustment of short reads to improve genome assemblies.Bioinformatics27:2957–2963
DOI 10.1093/bioinformatics/btr507.
Meglécz E, Costedoat C, Dubut V, Gilles A, Malausa T, Pech N, Martin JF. 2010.QDD: a user-friendly program to select microsatellite markers and design primers from large sequencing projects.Bioinformatics26:403–404
DOI 10.1093/bioinformatics/btp670.
O’Reilly P, Canino M, Bailey K, Bentzen P. 2004.Inverse relationship betweenFST, and microsatellite polymorphism in the marine fish, walleye pollock (Theragra chalcogramma): implications for resolving weak population structure.Molecular Ecology 13:1799–1814DOI 10.1111/j.1365-294X.2004.02214.x.
Peters MB, Ovenden JR, Broderick D, Lance SL, Hagen C, Glenn TC. 2009.Fifteen microsatellite loci for the jungle perch,Kuhlia rupestris.Molecular Ecology Resources
9:1467-1469DOI 10.1111/j.1755-0998.2009.02735.x.
Phelan M, Gribble N, Garrett R. 2008.Fishery biology and management ofProtonibea diacanthus(Sciaenidae) aggregations in far Northern Cape York Peninsula waters.
Continental Shelf Research28:2143–2151.
Rao TA, Mohan RL, Chakraborty S, Murty VS, Nair KS, Vivekanandan E, Raje S. 1992.
Stock assessment of sciaenid resources of India.Indian Journal of Fisheries39:85–103.
Saunders T, Newman S, Keag M, Errity C. 2014a.Golden SnapperLutjanus johnii. Status of key Australian fish stocks reports 2014. Fisheries Research and Development Corporation, Canberra, 523–529.
Saunders T, Roelofs A, Newman S, Errity C. 2014b.Black jewfishProtonibea diacanthus. Status of key Australian fish stocks reports 2014. Fisheries Research and Develop-ment Corporation, Canberra, 344–350.
Schuelke M. 2000.An economic method for the fluorescent labeling of PCR fragments.
Nature Biotechnology18:233–234DOI 10.1038/72708.
True CD, Loera AS, Castro NC. 1997.Technical notes: acquisition of broodstock of totoaba macdonaldi: field handling, decompression, and prophylaxis of an endangered species.The Progressive Fish-Culturist 59:246–248
DOI 10.1577/1548-8640(1497)059<0246:TNAOBO>2.3.CO;2.
Van Oosterhout C, Hutchinson WF, Wills DP, Shipley P. 2004.MICRO-CHECKER: software for identifying and correcting genotyping errors in microsatellite data.