Abstract— In data mining, the decision tree learning has seen to be one of the valuable classifying techniques that were found very useful to a wide range of data primarily to academic data. Monitoring of students’ academic performance is one of the main topics of educational data mining especially if a given course has a licensure examination¬. In the Philippines, licensure examination is one serious aspect in the field of education. However, still very few researches have been carried out concerning predictions of licensure examination performance. Most researches focus on academic retentions and developing dropout models. With this, the study is aimed to extract predictive model using Decision Tree Algorithm. The study aims to compare the performance of the decision tree growing methods in predicting student licensure examination using Confusion Matrix Test. These methods consist of Chi-squared Automatic Interaction Detection (CHAID), Classification and Regression Trees (CRT) and Quick and Unbiased Efficient Statistical Tree (QUEST). The extracted rule sets from the algorithm will be embedded in a decision support system that could early predict and identify who will fail in the nursing licensure examination so proper academic support programs can be formulated.
Index Terms—— Information System, Decision Tree Algorithm, Education Data Mining, Decision Support System
I. BACKGRO UND O F THE STUDY
The goal of the academic analytics is to extract hidden patterns from students’ academic performance and behavioral datasets. Many researchers have already developed models for retention and student behavioral analysis. However, there are still very few researches that have been carried out concerning prediction of licensure examination performance. One of the hardest licensure examinations is the nursing examination.
There are multiple factors that can be attributed in the performances of students in the licensure examination (Besinque et al, 2000). These factors can be categorized in the following (i) pre-college dataset (ii) study habits (iii) academic data and mock board examination. The researchers aimed to use the feature selection technique to determine the variables that will significantly affect the licensure examination results. With this, the researchers aim to combine data mining and decision support system in educational setting, creating a predictive nursing licensure examination decision support system. The model to be generated will be beneficial to a college or university.
Revised Manuscript Received on April 15, 2019.
Rolando R. Fajardo, Far Eastern University, University of the East, Philippines. (Email: [email protected])
John Paul P. Miranda, Don Honorio Ventura Technological State University, Philippines. (Email: [email protected])
A decision tree algorithm is one classification algorithm usually used for predictive modelling. Centered on a tree classification model produced by a decision tree with a tree like formation which usually uses a flow chart. It consists of internal and leaf nodes in which they are represented by rectangles, and ovals respectively. An internal node may have more than one child which contains splits. Its function is to test the value of an expression of the attributes. The researchers aimed to process all academic grades and demographic profile of the students using different growing methods of decision algorithm in determining the best method using confusion matrix. The main goal of the research is to develop decision support system that can early predict students who may fail licensure examination so the necessary academic support program can be formulated and be given by the academic institution.
A. Research Questions
1. What are the attributes in predicting the performance of students in nursing licensure examination?
2. How can feature selection technique identify significant forecasters in licensure examination? 3. What subjects are interrelated to one another using
Pearson R Coefficient?
4. How may the best decision tree methods predict licensure examination?
5. What data model can be derived and be used in decision support system?
6. How effective is the developed system decision support system in terms of FURPS Model?
B. Research Objectives
1. To determine the attributes in predicting nursing licensure examination
2. To use feature selection technique that can identify significant predictors in licensure examination 3. To determine the subjects that are interrelated to one
another using Pearson R Coefficient
4. To determine the best decision tree methods in predicting licensure examination
5. To generate a data model which can be derived and be used in decision support system
6. To determine the acceptability of the developed system in terms of FURPS Model
Developing Predictive Decision Support
System for Nursing Licensure Examination
Results using Decision Tree Growing
Methods
C. Scope and Limitation
The study analyzed data coming from admission, entrance examination and academic grades of the students. The admission data consisted of pre-college variables such as demographic and high school credentials of the students. The entrance examination is the entrance examination results of the students prior to admission in college level. The academic grades pertain to academic ratings of students to the core and professional courses of nursing degree. The dataset also includes the mock board examination and study habits of the students. A feature selection technique such as attribute importance will be used to determine which among the attributes are significant in respect to its target variable.
The decision tree algorithm was used to extract predictive model. The growing methods of the decision tree model will be compared using confusion matrix tables. The purpose of the comparison is to determine the best growing tree method suited in the datasets. The growing methods consisting of Chi-squared Automatic Interaction Detection (CHAID), Classification and Regression Trees (CRT) and Quick and Unbiased Efficient Statistical Tree (QUEST). The two parts of the datasets were training and testing datasets. Both training and testing datasets are historical datasets. The training set is a set of data to be used in producing extracted model.
To determine the accuracy of the growing method, the model will be tested using testing data sets. The data had to undergo pre-processing in which it was converted into a format readable by the data mining tool and any personal information was also deleted in the process to ensure data confidentiality. The study adopted the KDD process in the pursuance of the study. Its goal is to discover the key elements that will achieve the realization of the objectives in relation to the intended output. The tools used to process the data include WEKA (Waikato Environment for Knowledge Analysis) and SPSS. These tools were used to prevent the researchers from making mistakes or even forgetting something on computations. The extracted rule sets were programmed to a system. The system was evaluated using ISO 9126 quality software assessment tool
D. Significance of the Study
To Higher Educational Institutions. The framework may be utilized by different academic institutions in identifying potential students who have higher chances of not passing the licensure examination. The study would function as a foundation in determining student who are at chance to experience difficulty and drawback in pursuing their studies. To Researchers. The outcome of this investigation may help the faculty members procure a more profound comprehension of what should be centered around on instruction so as to draw out the intrinsic capability of every student. The discoveries of this investigation will enable them to perceive the qualities and shortcomings of each students.
II. LITERATURE REVIEW
A. Education Mining
Educational data mining (EDM) concentrated on the student understanding aspect that uses data mining
techniques in academic domain. Both Educational Data Mining (EDM) and Knowledge Discovery in Databases (KDD) are effective on mining and discovering useful patterns and knowledge from the educational information systems, such as, admissions and registration systems, other educational systems dealing with students at different levels of education, from primary schools, to colleges and universities (Amjad, 2016).
B. Feature Selection
Gareth et al (2013) discussed that in machine learning and in model construction, feature selection is used to as a variable decision mechanism to examine critical and significant attributes or predictors.
C. Classification Algorithm
Decision trees can manage both numerical and categorical data without requiring any area of learning to arrange the information. The information is allocated best by splitting and this thusly makes another second segment rule. The procedure goes on until there are no more division. The final tree is known as a maximal tree. (Kesavulu, Reddy, & Rajulu, 2011)
D. Decision Trees Algorithm
1. Classification Rules
In the study by (Han et al, 2016), once a decision tree is generated, the classification rules can be formulated by tracing the path from root node to each leaf node in the tree. Each splitting node is logically AND to form rule antecedent and each leaf node represents the class value for the prediction.
E. Growing Methods
According to IBM Knowledge Center, the following growing methods of decision tree algorithm are defined as follows:
• CHAID. Chi-squared Automatic Interaction Detection. In every step, CHAID will pick the independent (predictor) variable that has the strongest interaction with the dependent variable. Categories of each predictor are combined if they are not significantly different with respect to the dependent variable.
• CRT. Classification and Regression Trees. CRT separate the data into segments that are as uniform as possible with regards to the dependent variable. A terminal node in which all cases have the same value for the dependent variable is a uniform, "pure" connection.
F. Performance Accuracy of Algorithm
a) Ten Fold Cross Validation
The way toward separating the whole dataset into fundamentally unrelated sets is known as tenfold cross validation. Nine (9) out of ten (10) sets are utilized as training dataset to construct models and the data is run until the last dataset. For the main model, a classification error rate is determined for the model and put away as independent test error rate. Cross validation technique can provide enhanced accuracy rate in light of the fact that the mean of the error rate is much better than a doing a single test. Moreover, it prevents overfitting and underfitting of data sets. (Nisbet, Elder, Mider 2009).
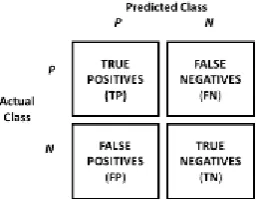
b) Confusion Matrix Test
The confusion matrix is helpful tool for breaking down how the classifier will perceive tuples of various classes. A confusion matrix for two classes is given by m classes that is a table of at least size m by m.
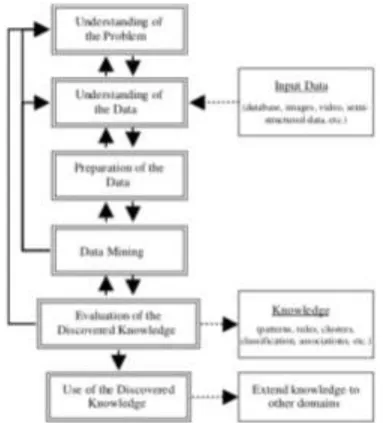
[image:3.595.331.523.239.451.2]G. Conceptual Model
Figure 1. Conceptual Model of the Study
Figure 1 shows the datasets which are necessary in predicting nursing licensure examination. This includes admission data, entrance examination, academic grades, clinical grades, mock board examination and study habits. To determine the significant attributes feature selection technique will be used. The purpose of the feature selection technique is to identify the attributes that significantly predict the board examination results. Those significant attributes will be processed using decision algorithm growing methods. To determine the best method of the decision tree algorithm, confusion matrix will be used. The extracted rule sets or classification rules form the model will be used and embed to a decision support system that early predicts students will pass the nursing licensure examination.
III. METHODOLOGY
The development of the project will entail two aspects (i) Knowledge Discovery in Databases and (ii) development of
decision support system that embeds the extracted rule set processed by the algorithm.
A. Knowledge Discovery in Databases
In this section, the traditional KDD procedure was used. The procedure begins from information accumulation and information preprocessing, next was classification model construction and ends with interpretation and assessment of the model.
The KDD was modified to go well with the goals of the study. The modified variation is provided on Fig. 1 the following approach from cleaning and incorporation, selection and modification, data mining, and interpretation and analysis for better understanding of the newly acquired knowledge.
Figure 2. The six-phases KDD model (Pal & Jain, 2005)
Figure 2 show the six phases of KKD model that incorporate understanding the problem, understanding the data, preparation of the data, data mining, evaluation of the discovered knowledge and use of the discovered knowledge. 1. Problem Understanding. This phase involves in-depth awareness and definition of the goal of the end users. Producing a predictive model for nursing licensure examination is the main goal of the research.
2. Data Understanding. Selection of attributes based from goals happens in this phase. Researchers need to produce predictive model based from the academic pre-admission variables, academic grades, and demographic using decision tree algorithm.
3. Data Preparation. Reliability of the data were improved in this phase. Data preparation involves data clearing by managing the missing values to generate better data. A data mining tool will be used to transform this data into proper format.
[image:3.595.77.259.307.518.2]a p value should be less than the significance level. The p value is the probability of observing an effect given that the null hypothesis is true whereas the significance of alpha (α) level is the probability of rejecting the null hypothesis given that it is true. Significance level is normally set to 0.05 before data is collection.
4. Data Mining. To generate a data model, an application of machine learning algorithms is to be employed. The data model generated is used for predictive model, using decision three algorithm, and profiling data sets. To produce an if then else rule statements from the datasets data mining is required. Derivation of rule sets from the educational data: Entropy
Equation 1 shown how to compute Entropy. Entropy
H(S), is the amount of uncertainty in the dataset S.
( ) ∑ ( ) ( )
Equation 1. Entropy wherein,
S refers to the current dataset for which entropy is being computed.
X refers Set of classes in S.
p(x) refers to the proportion of the number of elements in class x to the number of elements in set S.
When H(S) = 0, the set S is perfectly classified wherein all elements in S are of the same class.
Information gain
Equation 2 below is used to compute for Information gain represented by IG(A). It is computed as the difference in entropy from before to after the set S is split on a given attribute.
( ) ( ) ∑ ( ) ( )
Equation 2. Information gain wherein,
H(S) refers to Entropy of set S
T refers to the subsets created from splitting set S by attribute A such that ⋃
P(t) refers to the proportion of the number of elements in t
to the number of elements in set S H(t) refers to theEntropy of subset t
5. Evaluation of Discovered Knowledge. Evaluation of the models happens in the model building stage wherein their performances on the test datasets is verified. The method of evaluating the models can be accomplished by observing the number of correct predictions to the total number of predictions. Model comparison is often used in order to illustrates its accuracy. Model evaluation is considered as an iterative process in which all competing models are evaluated based on accuracy. According to (Nisbet, Elder, & Miner, 2009), the model is underfit if the accuracy of the model is too low while the model is overfit if the accuracy is too high.
Figure 3 shows two types of classification, the true positive (TP) and true negatives (TN). The true positive rate (TP) is computed by dividing the total number of positives which is represented by TP + FN; the false positive rate (FP)
[image:4.595.364.494.111.211.2]is computed by dividing the total number of negatives, FP +TN. To determine the overall success rate, the number of correct classifications is divided by the total number of classifications.
Figure 3. The Reviewer Operating Characteristic (ROC)
Accuracy = (TP + TN) / (TP + TN + FP + FN) Error Estimation = 100 – Accuracy
Equation 3. Error Estimation
6. Use of Discovered Knowledge. Utilizing the discovered classification rules as a guide to develop the decision support system suited to students with learning difficulty. The key benefit of the system is an early identification of students who will have academic learning difficulty based on rules so necessary academic programs can be given.
B. Software Development Methodology
[image:4.595.315.540.490.546.2]In this section, the researchers used RAD (rapid application development). RAD is an idea that products can be created quicker and of higher quality through prototyping procedure. After the researchers determines the rule sets, this will be programmed in a software prototype that can predict students’ probability to pass a nursing licensure examination. To develop the prototype the following steps will be implemented.
Figure 4. Rapid Application Development Model
Figure 4 shows the different stages under rapid application development. The steps include analysis and quick design, prototype development, testing and initial deployment.
1. Analysis of the Design. The objective of the analysis and quick design is to establish a general understanding of the problems that surround its developmental operations. The study aims to establish the sets of parameters to be used in building rule sets model.
3. Testing. In this step, it desires to create and experiment the application that implements the proposed procedure. The testing stage determines quality product by incorporating some software testing strategies which include white box, black box testing and user acceptance test.
4. Implementation. In this step, the product is ready for implementation. All necessary functions and modules are all working to accurately meet the needs of the software requirements.
5. Evaluation. To evaluate the acceptability of the prototype, the researchers will be using the ISO 9126 metrics which consist of six criteria (i) functionality (ii) reliability (iii) usability (iv) portability (v) efficiency (vi) maintainability. The instrument used in the prototype will be based on quality characteristics of the ISO 9126 software quality model consisting of criteria which include functionality, reliability, usability, maintenance and efficiency.
Figure 5. ISO 9126 Software Quality Model
The ISO 9126 quality model will be used in assessing the acceptability of the software based on the expert response.
IV. FUTURE WORKS
The study aims to create the following as future works a. To create a decision support system that can
determine the students who will not pass the nursing licensure examination so a proper academic support program can be given.
b. To use other classification algorithms in extracting data models. The researchers will again determine the best algorithm based on accuracy results.
c. To increase the number of datasets to be processed by the algorithm.
d. To modify existing growing methods of the algorithm in predicting nursing board results.
REFERENCES
1. Agresti, A. (1990). Categorical Data Analysis. Wiley, New York. Amjad A. (2016). Educational Data Mining & Students’ Performance Prediction. International Journal of Advanced Computer Science and Applications, Vol. 7, No. 5, 2016 212
2. Baker, R. S. J. D. (2010). Data mining for education. International encyclopedia of education, 7, 112-118. 3. Besinque, K.; W. Wong,W. Louie, and J. Rho 2000
Predictors of success rate in the California State Board of Pharmacy Licensure Examination. American Journal of Pharmaceutical Education. Vol. 64, Spring 2000
4. Gareth James; Daniela Witten; Trevor Hastie; Robert Tibshirani (2013). An Introduction to Statistical Learning. Springer. p. 204.Ishitani, T., & Snider, K. Longitudinal effects of college preparation programs on college
5. Han J., Kamber M. and Pie J. (2006). Data Mining Concepts and Techniques James Gareth (2013). An introduction to Statistical Learning with Application in R. Springer p. p. 176. ISBN 978 -1461471370
6. Kesavulu, E., Reddy, V., & Rajulu, P. (2011). A Study of Intrusion Detection in Data Mining. World Congress on