Abstract: Wireless sensor networks (WSNs) have become increasingly important in the informative development of communication technology. The growth of Internet of Things (IoT) has increased the use of WSNs in association with large scale industrial applications. The integration of WSNs with IoT is the pillar for the creation of an inescapable smart environment. A huge volume of data is being generated every day by the deployment of WSNs in smart infrastructure. The collaboration is applicable to environmental surveillance, health surveillance, transportation surveillance and many more other fields. A huge quantity of data which is obtained in various formats from varied applications is called big data. The Energy efficient big data collection requires new techniques to gather sensor-based data which is widely and densely distributed in WSNs and spread over wider geographical areas. In view of the limited range of communication and low powered sensor nodes, data gathering in WSN is a tedious task. The energy hole is another considerable issue that requires attention for efficient handling in WSN. The concept of mobile sink has been widely accepted and exploited, since it is able to effectively alleviate the energy hole problem. Scheduling a mobile sink with energy efficiency is still a challenge in WSNs time constraint implementation due to the slow speed of the mobile sink. The paper addresses the above issues and the proposal contains four-phase data collection model; the first phase is the identification of network subgroups, which are formed due to a restricted range of communication in sensor nodes in a wide network, second is clustering which is addressed on each identified subgroup for reducing energy consumption, third is efficient route planning and fourth is based on data collection. The two time-sensitive route planning schemes are presented to build a set of trajectories which satisfy the deadline constraint and minimize the overall delay. We have evaluated the performance of our schemes through simulation and compared them with the generic enhanced expectation-maximization (EEM) mobility based scenario of data collection. Simulation results reveal that our proposed schemes give much better results as compared to the generic EEM mobility approach in terms of selected performance metrics such as energy consumption, delay, network lifetime and packet delivery ratio.
Keywords: Wireless Sensor Network, Internet of Things, Mobile Sink Scheme, Big Data, Grouping, Clustering.
I. INTRODUCTION
R
ecent progress and advancements in technology have added to innovations in the area of communications that areRevised Manuscript Received on November 05, 2019.
* Correspondence Author
Tanuj Wala*, Department of Computer Science and Engineering, NIT Hamirpur, India. Email: [email protected]
Narottam Chand, Department of Computer Science and Engineering, NIT Hamirpur, India. Email: [email protected]
Ajay K. Sharma, Department of Computer Science and Engineering, NIT Jalandhar, India. Email: [email protected]
transiting to the Internet of Things (IoT). Considering this province, wireless sensor networks along with that act as one of those independent sensing devices that enable the monitoring of physical and environmental conditions for widespread applications [1]. Smart city depicts one of the applications that is of such networks and is very important, where numerous sensors are deployed to make the city smarter and effective. With the passage of time a large population is shifting towards urban living leading to the increasing trend of applicability of sensors. As reported by IDC [2], in 2030 more than 60% of the population will drift towards the urbanized environment. The system that supports smart city concept will efficiently handle the challenges of the increased population. The idea of smart city notion in the dynamic urban world will incorporate several infrastructures, technology for human behavior, social, political and the economic structure leading to a complex integrated environment where all the factors will contribute and work in collaboration to achieve the smart city concept. A smart city is an effective way to handle the essential components of basic necessities to dwell and develop. The components include transportation, safety, power, homes, buildings and the environment. These components will generate the data through wireless sensors that are incorporated into the various environments for industrial and customized uses. Sensor nodes in association with the different smart city solutions produce enormous data. Fig. 1 gives the view of various components such as a smart hospital, smart home, smart grid, intelligent transportation and smart mobility [3]. These contribute to major components of smart city architecture.
Fig. 1. Smart city components [3].
Efficient Data Collection using Mobile Sink
Scheme in IoT
Efficient Data Collection using Mobile Sink Scheme in IoT
Today we have various infrastructure systems that connect our world through various smart applications. The vision provided by such systems is associated with the IoT paradigm where an enormous amount of sensors are embedded into multiple devices which work in collaboration with physical infrastructure. The coupling of information and communication technology provide intelligent monitoring and management by using embedded devices in the network [4]. The sensor nodes integrated into each smart city domain are the main source of variable and voluminous data generation. As illustrated in Fig. 2, numerous sensors are deployed in various fields to collect different kinds of data, such as environmental data, transportational data, healthcare data and so forth, which is quite huge in volume and has different formats since it is originated from different sources [5]. Therefore, it is highly anticipated that the huge quantity and diverse range of data will be generated via sources containing sensors, which will have densely distributed WSNs with hundreds to thousands of nodes.
[image:2.595.57.281.358.556.2]The data generated by numerous sensors are very large and comes in a different format which is known as big data [6]. It means the sensor applications are responsible for the generation of big volume of data which is heterogeneous in nature.
Fig. 2. Big data model [5].
Fig. 2 describes the big data which contains information having high volume, velocity and variety commonly called as 3 Vs of the big data. Variety addresses the heterogeneous structure of data, the velocity indicates the high speed of processes and the analysis of the gathered data and the volume refers to the huge amount of data collected for processing. Though current services in use, like social media, machine-to-machine (M2M) applications, peer-to-peer (P2P) applications, etc. are responsible for the generation of the huge volume of data. It is predicted that numerous amount of data will be generated by the sensors or RFID devices which are designed in collaboration with body sensors, road-aside sensors, building sensors, motion sensors and so forth. As per the report, generated by ORACLE [7], the data volume, which is being generated by the sensors and RFID devices may reach the order of petabytes. The emergence of networked sensor technology (e.g., wide and densely distributed wireless sensor networks, body sensor networks, vehicular networks) has led
to the interpretation that the data produced by the devices from such types of systems will be used in the next generation big data systems. IBM estimation says that there will be an increase in the percentage of device-generated big data sources from 11 percent to 42 percent of all data by 2020 [8]. The sensors integrate the data sources such as wide WSNs will produce enormous machine generated data. Fig. 2 describes that the sensors are responsible for the huge volume of heterogeneous big data. The unsolved problem in the area of big data is inefficiency in data gathering from different resources. So, many researchers are working to find solutions to solve these issues [5, 7, 8]. As the distributed wireless sensor networks generate the big data, hence it is also a potential candidate for research.
The geographically widespread WSNs contain so many sensor nodes, which need new efficient energy data gathering techniques. The large scale WSN applications produce a huge amount of sensory data which is a challenge for efficiency in the collection, transmission, storage, and data analytics [9- 11]. This challenge is exaggerated since each wireless sensor has different certain strict constraints of hardware resources in a restricted environment controlled by the energy perspectives. As a result, in reference to the sensory processing, dealing with the storage and transmission of the big data emerges out to be a challenging aspect. An example of the same is the occurrence of natural errors and incomplete collection processes. The battery life of the sensors is another problem to be resolved as it triggers data collection and transmission inability over long intervals of time [12]. As a result, the errors are incorporated into underlying data, leading to uncertain data representation. There are two important issues to be taken as a challenge for data collection, first is the data monitoring in wide geographic areas with non-connected and distributed regions and second is sensor nodes based data collection that is highly energy inefficient [13,14]. The former is related to divide the network problem where there is no physical communication among the sensory nodes in distributed regions. In this case, the data collector cannot be use same in the first and second region [15]. The second major challenge is related to the optimization of the lifetime of sensory nodes that work with the power of battery that has a limited supply of energy [16]. These kinds of nodes cannot be recharged after deployment. To deal with these challenges, the mobile sink scheme (MSS) has received great attention in the literature.
The MSS techniques outperform the traditional methods using static sink since the data collection can be handled efficiently from isolated networks. The mobile sink is one of the best possible approaches to resolve the problem of inaccessible static sink, thus enhancing the connectivity of the network, and needs less energy for node consumption as the collection overheads over sensor nodes are adequately transferred to the mobile sink. However, this scheme suffers from the high latency issue. Due to the slow speed of the mobile sink, the coverage time for the widely spread sensing area is more that cannot address the delay requirements of
various time-sensitive
Data collection methods for sensor nodes are important for design consideration in WSNs. Therefore, the objective of the work is the development of highly efficient mobile sink data collection approaches that can reduce energy consumption and address the delay issues in WSN based multi-group sensor nodes.
So, the current work aims to investigate a plan of incorporating the efficient mobile sink movement with delay requirements. The sink periodically collects data from the head nodes in the network. In the proposed model four-phase data gathering approach is used for data collection. Identification of subnetworks is done using Spectral Graph Partitioning (SGP) technique and to minimize the energy consumption for data transmission enhanced EM clustering algorithm is applied in which the responsibility factor value parameter is used to form clusters. Thereafter, we propose two distance sensitive trajectory scheduling approaches to solve the route planning problem of mobile sink. The sink moves towards the subnetworks for the collection of sensed data and the trajectory of the sink is based on two proposed trajectory schemes. The first is the Cluster Head Distance Sensitive based Trajectory Scheduling Scheme (CHDS-TSS) that formed routes by considering the distance between the cluster head nodes. If this distance is less than the double of communication range, then the sink moves towards a particular point and collects data simultaneously. It helps in the reduction of sink movement. Further to reduce the sink movement, the second scheme is proposed i.e. Group Head Distance Sensitive based Trajectory Scheduling Scheme (GHDS-TSS). There is fixed initial point for the movable sink and movement goes along in a well-planned trajectory that covers the whole network, collects data from network head nodes containing sensors for the task and finally reverts to the initial point. We compare the performance of CHDS-TSS and GHDS-TSS with generic EEM mobility approach of data collection where the sink moves towards every cluster head for data collection. The simulation results reveal that our schemes improve the energy consumption, delay, packet delivery ratio, and network lifetime issues.
The rest of the paper is organized as follows. Section II provides a brief overview of some related research work. The proposed approaches are discussed in Section III. Performance evaluation is presented in Section IV. Finally, conclusion and future scope of the work is described in Section V.
II. RELATEDWORK
Many researchers have used the mobile sink scheme for data gathering in WSNs [8, 11, 13, 19]. This section provides a short overview of the work carried out in this field.
Rahul C. Shah et al. [17] suggested a three tier design strategy to MULEs (Mobile Ubiquitous LAN Extensions) for the collection of data from scarce sensor networks. Sensor nodes are divided into grids and access the grids through the mobile entities. The mobile entities move randomly among the grids for gathering data from the sensor nodes, buffer it and deliver to the wired access points when comes in the proximity. Random walk between the grids proves to be a major drawback because if every sensor node in the grid
collapse, then visiting the empty grid will result in wastage of time and energy.
Jun Luo et al. [18] addressed the overloading of the sensor nodes close to the sink as they transmit the traffic of all other nodes in the network, which leads in energy depletion of these sensor nodes and disconnection from the network. To address these problems, a portable sink system was proposed to collect sensed information from the source sensors. An assumption was made regarding sensors, which says that sensors have a circular area of distribution. According to assumed features overall energy consumption was reduced to a minimum value when the mobile sink has a cycle trajectory. The optimal position and radius were calculated. Sensed area was divided into two parts by mobile sink, an internal circle and an external circle. External circle nodes do round routing scheduling, while internal circle nodes use the shortest path scheduling.
Vijayalaxmi et al. [19] proposed a portable sink system to collect information from the wireless sensor network. Clustering was done using K-medoid algorithm where the nodes were split into K-medoid based clusters. The portable sink tour each cluster and gathered the data from various sensor nodes.
Amar Kaswan et al. [20] proposed two algorithms RkM (reduced k-means) and DBRkM (delay bound reduced k-means) for defining the path of the mobile sink. The experiments concluded that both the mentioned algorithms showed an efficient selection of a path for the mobile sink. The algorithms were affected by various factors such as increasing the range of one-hop members, minimizing the average trip length and reducing the desired RPs (rendezvous points) distance. RkM determined the path by connecting sensor nodes via single-hop communication. Parallelly DBRkM followed the same method and generated a time limited route. The algorithms assumed that each node has an equal burden for the creation of information and negligible period of stay for the mobile sink. Both the proposed algorithms outperformed WRP and CB and showed efficient results for counting hops, energy consumed, counting active nodes and determining network lifetime. Authors also proposed an information collection scheme for portable sink. The scheme can be pursued in each information collection round to minimize packet loss.
K. R. Remesh Babu et al. [21] explored the difficulties of collecting large information produced by the distribution of wireless sensor networks. The challenges were addressed by focusing on clustering scheme which utilized the Expectation-Maximization (EM) algorithm based mobile sinks varying from one to eight in number. The paper experimentally showed the effective importance of the number of mobile sinks in efficient data collection through wireless sensor networks. It also led in derivation of a relationship that the total percentage of movable sinks with n sensor nodes is roughly equivalent to √n.
Janpeng Du et al. [22] came out with Time High-Overflow Based Dominating (THD) algorithm for clustering. The algorithm partitioned the nodes into various clusters depending on the rate of the
Efficient Data Collection using Mobile Sink Scheme in IoT
proposal of Temporary Caching Mechanism (TCM) was raised for solving the buffer overflow problem of the sensor nodes and the ideal route choice for the mobile base station was based on Dominating Based Minimum Weighted Sum (DMWS) algorithm. This algorithm identified the cluster heads (CHs) depending on the buffer overflow interval, the degree of importance of the data and source-destination range, where the mobile sink will move for data collection.
Ant colony optimization and genetic algorithm are used by Yaqiang Zhang et at. [23] to maintain balance among the energy consumption of the mobile sensors.
Chirihane Gherbi et al. [24] came forward with a proposal of a Distributed Energy Efficient Adaptive Clustering Protocol abbreviated as DECAP. Assuming that DECAP is well distributed and the energy restricted sensor network benefits have been attained. The protocol utilized the gap between cluster heads to achieve all the distributions of clusters. Load balancing was added as an effective enhancement to DECAP. The traffic load is distributed among cluster nodes with the objective of reducing the drop probability that may occur due to the overflow of the node queue. Therefore sharing traffic inside the cluster was considered more reasonable, since nodes within the same cluster showed the same trend of movement thereby enhancing the capacity to deliver data. The simulations carried out to support DECAP generated well balanced clusters. However the achievement of other requirements for WSN such as the complete representation of the supervised region, real time applications of WSN and security were still left out as future research areas.
Jan Wan Kim et al. [25] presented an efficient IAR (Agent-based routing) data collection approach to the mobile sink. Authors addressed that the approach helps in the delivery of almost every packet towards the sink, results in the reduction of signal overheads and improves the triangle routing problem. The agent selection in this approach depends upon the described procedures; hello request (HREQ) message is broadcasted from the sink, those nodes who receives HREQ message respond back by unicasting HELLO message to sink. The HELLO packet unicasted to the sink contains the information about the sender that helps sink in the identification of the closest node.
Charalampos Konstantopoulos et al. [26] proposed MobiCluster, a protocol that uses city buses to carry mobile collectors to collect data from remote areas. MobiCluster primary seeks to optimize communication, data transmission and allows balanced energy consumption among the sensor nodes. Basically, the mobile collectors were employed to collect the data from an isolated urban sensor island to achieve connectivity objective. The prolonging lifetime of selected peripheral RNs (rendezvous sensors) that were under the range of passing mobile collectors was also contributed to addressing the connectivity issue. RNs were also used to store and send sensor data extracted from remote sources. The increase in data throughput was assured by regulation of a number of RNs, so that adequate time could be allowed to provide the buffered data by avoiding the data loss.
Liang He et al. [27] proposed a CSS
(Combine-Skip-Substitute) scheme on the basis of progressive optimization strategy. With the use of mobile
elements (MEs), CSS reduced the travel duration and the data gathering latency for WSN. The proposal included the ME-CSS scheme that took the benefits and the reality of modern wireless communication. The extensive simulation resulted in depicting correctness and difficulty of the suggested systems with their performance evaluation. The results obtained were within a limited range of lower bound that was not possible to achieve by any practical approximation algorithms.
Chuan Zhu et al. [28] investigated recent typical literature relating to the data gathering and data classification on the basis of the sensed data upload path. The results of comparative analysis paved a way to propose a tree oriented data gathering algorithm for WSN together with a mobile collector. The whole network traffic load has been balanced as the collector node was allowed for a certain duration to travel around the network to obtain the information and to prevent the use of the same hot spot in an attempt to extend the network lifetime. For tree construction, the work is proposed on weight based tree building procedure, where the weight is calculated by using the various parameters, such as, the remaining energy of the sensor node, the distance to the base station and node density. The tree construction is followed by the selection of rendezvous points (RPs). Authors also proposed a tree decomposition approach that took into account the hop count and data volume of each node for the selection of sub rendezvous points (SRPs). This enhanced the balance of energy consumption. An adaptation approach for RPs and SRPs reselection was also introduced to reduce the neighboring burden.
Amany Abu Safia et al. [29] proposed a Hilbert Collection Strategy (HCS) that utilizes a mobile collector, such as drone, to obtain data from a movable network and identify natural occurrences. The mobile nodes were designed to organize themselves to adapt the diverse topology. By embracing two optimization techniques throughout data transmission, the drop of packets and energy costs in this method is reduced.
From the preceding discussions, it can be concluded that it is more realistic and efficient to move the sink to make data collection easier and suitable for wide and densely distributed network topology. The efficient data collection using a mobile sink from widely distributed wireless sensor networks is the core motivation for this work.
III. PROPOSEDWORK
The current research aims to optimize the problem of gathering huge amounts of data on wide scale WSNs. The paper puts forward the proposal of robust single mobile sink based data gathering scheme with high energy efficiency. The aim of this scheme is to use a mobile sink that will robustly gather data from various distributed nodes and eliminate the contention issues to optimize overall efficiency in communication. This approach significantly reduces the signaling overhead to improve the computing effectiveness of the network and eliminates security related adversaries. Initially, the paper discusses SGP to identify subnetworks and reduce energy exhaustion.
collection. The EM algorithm is used for clustering within the groups. The proposal addresses the issues of energy and data loss in forwarding the nodes, thereby reducing the channel burden, contention and computational complexity. The portable sink moves towards the head nodes to collect data, hence eliminating the limitation of a static sink in wide WSNs. The WSN transmission delay is noted as a key constraint by using a single portable sink. The delay is the difference of waiting period between the generation and transmission of data among various sensor nodes and is computed to be high because unlike the static sink, the mobile sink or collector will travel towards the sensor nodes to accomplish the data gathering task. In comparison to the electrical communication between the sensor nodes, the velocity of the movable sink is relatively less due to which there can be longer delay considering a single mobile sink node. Considering the problem of delay, the alternative is to reduce the trajectory (i.e., traveling distance) that allows the sink to achieve head nodes quickly in the process of collecting its data from connected sensor nodes. The proposed model applies two schemes, first is the Cluster Head Distance Sensitive Trajectory Scheduling and second is Group Head Distance Sensitive Trajectory Scheduling Scheme to estimate optimal path for the mobile sink.
A. Considered Network Model
In attempt to assess the performance of the considered data collection model, the paper considers a network consisting of multiple sensor nodes spread within the area of interest. The mobile sink node is initially situated at one edge of the network. The Mobile sink moves in the target locations based on the traveling salesman problem (TSP) to collect data. The mobile sink is assumed to have infinite memory, power and other computing assets. Initially, every sensor node is positioned with the same amount of energy E0 and uses localization technology to know its location. The sink knows the position of all nodes. The node has a limited sensor range R regardless of the source or sink and effective communication is done among them within the premises of R.
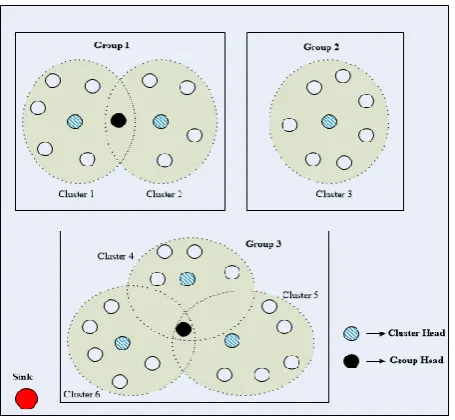
The sink node makes a tour of the head nodes that are selected to minimize latency for data transmission and collection. Sensor nodes have a buffer memory and hold the data locally until the head node is approached by the mobile sink. The paper assumes a wide and densely distributed WSN in widely spread cities, urban communication scenarios etc. The assumptions divide the overall network into subnetwork regions due to limited communication range. Fig. 3 describes the considered network model. The circles distributed in the target area denotes N sensor nodes and K cluster centers shown by filling circles corresponding to the visit points of the mobile sink. A solid rectangular region and a shaded circle represent groups and clusters respectively. In this paper, the term group contains those nodes that are willing to interact on multi-hop basis with each other and the nodes belong to one group are not able to communicate with nodes of another group due to long distance communication reason.
[image:5.595.316.544.49.259.2]The field comprises with G number of groups, where Ng and Kg are the corresponding nodes and clusters in the particular group.
Fig. 3. Considered network model. B. Identification of Subnetworks Using SGP
The graph partitioning technique deals with the division of the network into subnetworks. SGP is a technique that provides the organizational characteristics of the graph by applying the concept of eigenvalues and eigenvectors that is calculated by forming the Laplacian matrix of the graph. The work is influenced by the key observation that the number of lowest eigenvalues or trivial values are used to identify the number of separated regions of the network and their respected lowest eigenvector values that shows step function like curves helps to easily identify the number of nodes corresponding to every separated region of the network. Steps to be followed:
1) Construct the graphic representation of the considered WSNs.
2) Evaluate the Laplacian matrix to represent the network graph.
3) Evaluate the eigenvalues and eigenvectors corresponding to every sensor node.
4) Check the lowest eigenvalues to identify the number of separated network regions. If more than one zero eigenvalues are found that mean separated regions are present in the network and multiplicity of zero specifies the number of separated regions of the network.
5) Check the eigenvectors corresponding to zero eigenvalues to identify the number of nodes. Same non-zero values of nodes with respect to every eigenvector specify all the nodes that come in the proximity of particular disconnected segment.
C. EM Algorithm for Clustering
In large scale WSNs, the lifespan of the sensor nodes is very less. This is because each node transmits an enormous amount of data produced by another node in the network. The energy needed during the transmission of data is proportional to the distance of transmission. The issue is addressed by following the EM clustering approach, which reduces the sum of the square of the distance
Efficient Data Collection using Mobile Sink Scheme in IoT
clustering scheme maximizes the expected gain by implementing distance property to effectively lower the amount of energy consumed by reducing the communication distance. As result clusters are formed by closest nodes.
EM is a clustering algorithm relying on a probabilistic model. It is a generic method of discovering the highest probabilistic values of estimating parameters from inadequate information which might have uncertain values. Basically, the algorithm is performed in two phases; 1) Expectation phase and 2) Maximization phase. The algorithm begins with an initial estimation of about three parameters such as covariance matrix, cluster centroid and mixing coefficient and performs these phases in an iterative manner.
The Expectation phase utilizes the initially estimated parameters to calculate the estimation of likelihood or responsibility factor value and is calculated by (1)
Where x corresponds to the position of the sensor node and µ, ℼ and ∑ are the clustering parameters that denote the centroid, mixing coefficient and covariance matrix of kth cluster respectively.
Maximization phase calculates the maximum probability by recalculating the parameters by using (2), (3) and (4) which are relying on the estimated probability computed in the expectation phase. This procedure is continued until convergence is identified. Equation (6) is used to evaluate the log likelihood value.
(2)
=1/ (3)
(4)
where
(5)
(6)
where
(7)
(8)
Algorithm 1: Enhanced EM Clustering
Input: Number of sensor nodes N
Output: Cluster heads, Group heads, Covariance matrix and list of nodes connected to a specific cluster 1. Select some node as a cluster head (μk) at random places 2. Evaluate the clustering parameters: covariance matrix (Σk)
mixing coefficient (πk), distance (Dnk) and log likelihood value (P)
3. while (P – Pnew) < ϵ do
Perform Group (g) selection on the basis of higher Sg value”
for k
Kgdo for n
Ng doCalculate the RF value of every node, end for
Identify the total number of nodes with respect to the cluster, Nk
Update the parameters μk, Σk and πk using Nk end for
4. Evaluate the differential RF value of every sensor node with respect to every cluster head
5. Perform Group Head (GH) selection on the basis of minimum differential RF (DRF) value
6. Estimate log likelihood Pnew end while
7. Return CHs, GHs, covariance matrix and the nodes assigned to each cluster
In the first step, mobile sink select cluster centroids, μ, at random locations. Thereafter, the value of communication distance of each node to cluster centroids (Dnk), covariance matrix and mixing coefficient are obtained. Once the clusters are initialized, the proposed method does the selection of a group g. The group selection depends upon the ratio of a number of clusters to the number of nodes as specified in equation (7). After selecting the group with the highest value of Sg, responsibility factor (RF) value or dependency value of each node is computed. The RF value spectrum is between 0 and 1 and displays the proximity of each node equivalent to each cluster head. Cluster heads, µ and covariance matrix are recalculated by using updated responsibility values, and the number of nodes corresponding to a particular cluster are further calculated using (5).
In the next step, differential responsibility factor (DRF) value of each node with respect to every cluster head within each group is evaluated by (8) and one node whose DRF value is minimum, selected as a group head. Finally, the log-likelihood value (P) is calculated and these steps are carried out constantly until the value of log likelihood converges.
D. Route Planning and Data Collection Procedure The data from connected sensor nodes is transmitted to the mobile sink through cluster head. The prime limitation with a single mobile sink is transmission delay in WSN.The relative difference between the speed of movement of the mobile sink and speed of electric communication between the sensor nodes can cause significant delay to a single mobile sink node, since the random sink movement cannot guarantee to collect all the data and also meets the deadline requirements of the time sensitive applications. So, efficient route planning of sink movement is necessary for large scale wireless sensor networks. The path trajectory or
considered vital since it helps a mobile sink to reach CH early and do the data collection from connected sensor nodes. The section describes the problem of efficient route planning for the movable sink.
To achieve this, our model proposes two schemes, first is Cluster Head Distance Sensitive based Trajectory Scheduling Scheme (CHDS-TSS) and second is based on Group Head Distance Sensitive Scheduling Scheme (GHDS-TSS). (1)CHDS-TSS Algorithm
In CHDS-TSS, the number of cluster heads and their respective cluster head locations is the initial input information to the sink. The transmission range of the sensor node is 75m. The calculation of the distance between multiple cluster heads is made and further considered. Either the calculated distance between cluster heads is less than double of the communication range (i.e. 150m) or vice versa. In the first case, the intermediate point between the two least distance cluster head nodes is calculated which provides the target movement point for the sink. The sink is made to move towards the intermediate point for data collection from both the cluster head nodes that are adjacent in a single move. Otherwise, if the distance between the adjacent cluster head nodes is more than the double of the communication range, the sink movement takes place sequentially towards less distant cluster head first and then towards second.
Algorithm 2: CHDS-TSS
Input: I = , i = {1, 2, …, n}, the number of cluster heads Output: R = , i = {1, 2, …, n}, the number of routes
1. R=ϕ, = , k=1
// Finding least distance cluster head node 2. for all cluster head nodes i in do 3. Compute the distance .
4. Select two least distance cluster head nodes ( ) // Finding route
5. Compute the distance between dlm 6. if ( <= 2R)
Find intermediate point (P), by taking mean of l and m. Compute route = {sink, P}, update sink at P
= - {l}{m}, R=R U , = , k= k+1
7. else
Select least distance cluster head node i Compute route = {Sink, i}, update sink at i
= - {i}, R=R U , = , k=k+1
8. goto line 2, until =ϕ 9 return R
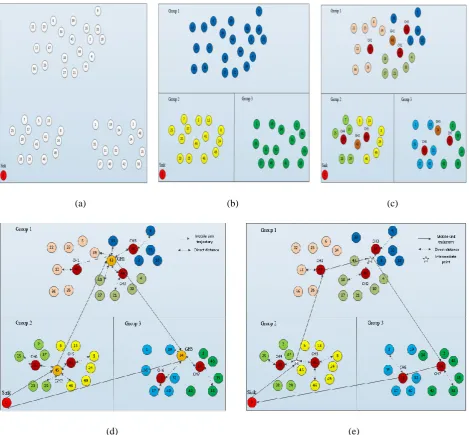
As shown in Fig. 5(d), node 0 represents the sink and node 47, 44, 16, 20, 41, 11, and 14 are the cluster head nodes denoted by the node id from CH1 to CH7 in the network. The CHDS-TSS algorithm first computes the distances from sink to every cluster head (d01, d02, d03, d04, d05 and d06)i.e. 280,
290, 367, 89, 130, 284 and 375. The next step is the selection of two least distance cluster head nodes from the sink. The CH4 and CH5 are selected because they have the smallest value and the distance between both the cluster heads is 82 i.e. less than 150m. So, the intermediate point is calculated by getting the average of both the cluster head coordinates. This is the first movement point for the sink. The same procedure is repeated until sink visits all the cluster head nodes.
(2) GHDS-TSS Algorithm
In GHDS-TSS, the cluster head transmits data towards the group head and then the group head transmits all the aggregated data to the mobile sink directly when the sink is nearby. This approach is best for the delay sensitive applications because in this case the sink will take less time to collect all data by reducing unwanted traversal but it consumes slightly more energy in comparison to scheme one as the number of hop count increases. So, in this work, this approach is further improvised by considering the distance between sensor nodes and CHs as well as sensor nodes and GHs and try to minimize the energy consumption to some extent. After receiving the request transmission message, each sensor node calculates the distance from the cluster head and the group head and whatever distance is minimum, the sensor node directly sends data to that head node.
Algorithm 3: GHDS-TSS
Input: I = , i = {1, 2, …, n}, the number of group heads Output: R = , i = {1, 2, …, n}, the number of routes
1. R=ϕ, = , k=1
//Finding least distance group head node 2. for all group head node i in do 3. Compute the distance .
4. Select least distance group head node i // Finding route
5. Compute route = {Sink, i}, update sink at i
6. = - {i}, R=R U , = , k=k+1
7. goto line 2, until =ϕ 8 return R
The algorithm 3, specifies that the number of group heads are the initial input information to the sink. The routes are evaluated by calculating the distance from the sink to every group head and the least distance group head node is selected. This will be the movement point for the sink. The same process is repeated until sink visits every group head.
Efficient Data Collection using Mobile Sink Scheme in IoT
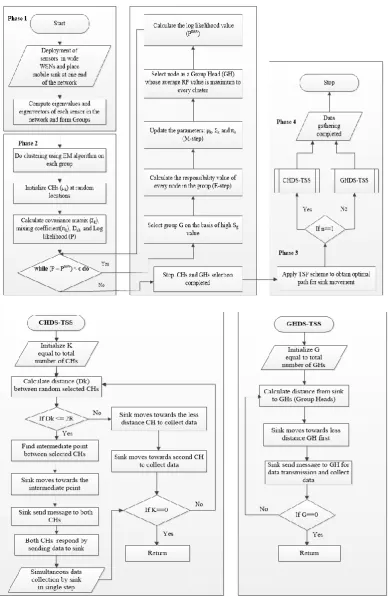
Fig. 4. Flowchart of the proposed methodology.
Fig. 4 illustrates a flow chart which demonstrates the four phase data collection procedure. The first phase identifies the disconnected portion of the network that occurs in wide WSN due to limited communication range and form groups or subnetworks. The second phase takes groups as an input and performs clustering within each identified group. Third phase
(a) (b) (c)
(d) (e)
Fig. 5. (a) Deployment of sensor nodes (b) Groups formation (c) Clusters formation (d) Data collection using CHDS-TSS (e) Data collection using GHDS-TSS.
Fig. 5 describes the overall situation of the suggested methodology as mentioned in this paper. Fig. 5(a) shows the initial allocation of sensor nodes. Here, each sensor node contains necessary resources and the buffer memory to hold the sensed information until the sink visits to the specified target area for data collection. Communication between the sensor nodes is applicable only when they are close to the defined communication range R. At first sink is located at one end of the network. Sensor nodes suffer from limited communication range issue, so in case of large WSNs, interaction among the nodes is not always feasible which leads to network division in several subnetworks. Group identification is very essential because it enables a sink to cover the entire network region and retrieve information from every sensor node. Therefore, in this paper SGP technique is taken into consideration to identify subnetworks or groups. After implementing the SGP technique, the nodes that have the same eigenvector values construct the group. Fig. 5(b),
[image:9.595.70.540.48.483.2]International Journal of Innovative Technology and Exploring Engineering (IJITEE) ISSN: 2278-3075, Volume-X, Issue-X, July 2019
IV. PERFORMANCEEVALUATION
The overall performance of the proposed model is evaluated by using NS2 (Network Simulator version 2) simulator. The effectiveness of the algorithm is assessed at different network by simulating various number of nodes over a network area of 1000*1000 square meter (m2). Each sensor node is fixed with 2J in its initial energy and no energy restriction is available for the mobile sink node. The mobile sink speed is supposed to be 2 m/s. The complete simulation parameters of the proposed model are summarized in Table 1.
Table-1: Parameters summary
In the proposed model, to reduce the energy consumption we have enhanced the EM clustering algorithm to group head formation. Further, to reduce sink delay problem in data collection throughout the network, the proposed model is based on two sink movement schemes.
The performance of the proposed approaches referred as CHDS-TSS and GHDS-TSS is compared with the generic EEM mobility based data collection approach in which data is transmitted from cluster nodes to cluster head and then sink moves towards every cluster head for data collection. The main difference between proposed approaches and generic EEM approach lies in the context to minimize the total time of the mobile sink tours which is not considered in the generic EEM mobility approach.
A. Metrics for Performance Analysis
In this paper, the comparison between generic mobility approach for data collection and proposed schemes is made on the basis of widely adopted performance metrics such as packet delivery ratio, average energy consumption, delay and network lifetime.
Packet delivery ratio (PDR): This metric defines the ratio between the total numbers of packets received by the receiver to the total sent by the sender. Basically, it shows the success rate of packet reception at the destination. PDR is calculated using (7).
(7)
Where Preceived and Pgenerated correspond to a number of packets received and generated respectively and n stands for the number of sensor nodes.
Energy consumption: It gives the average consumption of energy at each sensor node that occurs due to transmission, reception and processing of data while simulating the network.
Delay: This network performance metric defines the mean time length between the creation and reception of packets at the sink. D(n) indicates the mean time lag of n sensor nodes. It is determined by using (8).
(8)
Where I received corresponds to the time taken by the data packet to reach at sink node and Ttransmitted denotes the time taken by each sensor node to transmit the data.
Network lifetime: It gives fully functional duration time of the network. The lifetime of a network can be estimated as following time spans; either one sensor dies or some of the sensors die, all or network portioning.
B. Results and Discussion
The section details the results of simulation obtained by implementing proposed approaches comparing it with generic EEM mobility approach of data collection.
Delay
Fig. 6, presents the result for the average delay. As the simulation reveals that the average delay with CHDS-TSS and GHDS-TSS is better than a generic EEM approach. The reason is that in a generic EEM approach the sink moves towards every cluster head for data collection. So, it has a maximum delay in wide and large network area because the sink movement speed is slower as compared to communication among sensor nodes which results in taking more time to reach a particular cluster head. But in proposed CHDS-TSS the relative distance between CHs is used to find the exact position for sink movement that reduces the number of traversals and helps in the reduction of delay.
Further to reduce delay up to some extent, GHDS-TSS approach is used that shows better results than CHDS-TSS as shown in Fig. 6, because in GHDS_TSS we have managed to reduce the unwanted traversal and higher traveling time as the sink visits only the defined GHs as opposed to all CHs.
Number of nodes
25 50 75 100 125 150 175 200
A
ve
ra
ge
d
el
ay
(
se
c)
0.00 0.02 0.04 0.06 0.08 0.10 0.12 0.14 0.16 0.18 0.20
[image:10.595.309.542.589.750.2]Generic EEM Approach CHDS-TSS GHDS-TSS
Fig. 6. Average delay for Generic EEM Approach, CHDS-TSS and GHDS-TSS under different number of
nodes.
Parameter Value
Network area size 1000×1000m2
Range of sensor nodes 25, 40, …, 200
Size of data packet 512 bytes
Size of control packet 32 bytes
Initial energy of nodes 2J
Sink speed 2m/s
Eelec 50nJ/bit
εfs 10pJ/bit/m2
εmp 0.0013pJ/bit/m4
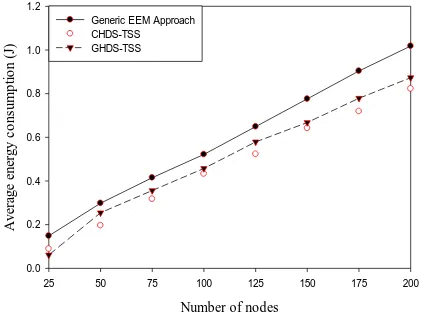
Energy consumption
The simulation trend seen in Fig. 7 for average energy consumption reveals that CHDS-TSS performs best than the generic EEM approach. This is because it based on the enhanced EM clustering algorithm with optimal sink movement that reduces the distance between sensor nodes to cluster heads and from cluster heads to sink that significantly reduces energy consumption at sensor nodes. This behavior is so because we have tried to exploit communication distance as much as possible. In enhanced EM clustering the nodes selection for a particular cluster is based on its responsibility value, distance and covariance matrix parameters. Due to this all the nodes in the cluster come within the communication radius and reduce multi-hop transmission. Fig. 7 reveals the same simulation trend for energy consumption with regard to GHDS_TSS. As shown in Fig. 7, energy consumption is slightly increased with respect to CHDS-TSS.
Number of nodes
25 50 75 100 125 150 175 200
A v er ag e en er g y c o n su m p ti o n ( J) 0.0 0.2 0.4 0.6 0.8 1.0 1.2
[image:11.595.316.545.182.354.2]Generic EEM Approach CHDS-TSS GHDS-TSS
Fig. 7. Average energy consumption for Generic EEM Approach, CHDS-TSS and GHDS-TSS under different
number of nodes.
Packet delivery ratio
In terms of PDR, proposed schemes showed the best results in comparison to the generic EEM approach. For PDR, results can be seen in Fig. 8. Results depict that GHDS-TSS increase PDR in comparison to CHDS-TSS and generic EEM approach. This improvement in PDR comes from a significant reduction in data traffic, contention and computational complexities over network head nodes and sink. GHDS-TSS reduces the maximum possibility of packet loss by reaching at the destination in appropriate time and control the buffer overflow problem.
Number of nodes
25 50 75 100 125 150 175 200
P ac ke t d el iv er y ra tio ( % ) 60 65 70 75 80 85 90 95 100
[image:11.595.61.274.277.433.2]Generic EEM Approach CHDS-TSS GHDS-TSS
Fig. 8. Packet delivery ratio for Generic EEM Approach, CHDS-TSS and GHDS-TSS under different number of
nodes.
Network lifetime
The lifetime of the network is affected by various parameters such as long distance transmission, imbalance load distribution, network obsoleting etc. The network lifespan outcome for various network scenarios is shown in Fig. 9, where proposed CHDS-TSS outperforms the others and the reason behind this is the reduction in delay, in a number of hop counts and due to balanced energy consumption among sensor nodes.
Simulation time (sec)
50 100 150 200 250 300
N u m b er o f n o d es a li v e 0 50 100 150 200
Generic EEM Approach CHDS-TSS GHDS-TSS
Fig. 9. Network lifetime for Generic EEM Approach, CHDS-TSS and GHDS-TSS under different simulation
time.
V. CONCLUSION
The collaboration of WSNs is the key component in IoT architecture. Wirelessly connected IoT sensing devices are creating a noble inescapable smart environment and altering the way we live and interact with the environment. Static WSNs have limited support for domain applications while the mobile sink improves the efficiency of task achievement in data gathering and processing. Mobile sink moves towards pre-specified locations for data collection from all the sensing nodes and thus, solves the problem of energy exhaustion and improves the lifetime of wide and densely distributed WSNs. The wide coverage of the network region without delay is a major challenge. The paper proposes a method to mitigate this challenge. The current work addresses the problems related to widely generating big data collection through WSNs. Due to the restricted range of communication, the network is split into subnetworks and the wireless transmission consumes a lot of energy of the sensor nodes. The paper provides the solution for the same by following four phase approach that implements two techniques. SGP technique is used to determine the disconnected segments of the network and then the mobile sink scheme with network clustering based on the Expectation-Maximization (EM) is used for efficient collection of data from the disconnected networks. For the efficient movement of the sink, two trajectory schemes, such as CHDS-TSS and GHDS-TSS are presented in this paper. Simulation results show that proposed schemes can provide considerable energy saving,
[image:11.595.65.272.615.743.2]International Journal of Innovative Technology and Exploring Engineering (IJITEE) ISSN: 2278-3075, Volume-X, Issue-X, July 2019
least sink movement time compared with existed generic EEM mobility based data collection approach.
This work is restricted to a single mobile sink and in the future the work can be enhanced to multiple mobile sinks for prolonging the lifetime of the network.
REFERENCES
1. Z. Sheng, C. Mahapatra, C. Ghu and V.C.M. Leung, “Recent
Advances in Industrial Wireless Sensor Networks Toward Efficient Management in IoT,” IEEE Access, Vol. 19, No. 3, pp. 622-637, May 2015.
2. E.P.K. Gilbert, B. Kaliaperumal and E.B. Rajsingh, “Research Issues
in Wireless Sensor Network Applications: A Survey,” International Journal of Information and Electronics Engineering, Vol. 2, No. 5, pp. 702-706, September 2012.
3. D.J. Cook and S.K. Das, Smart Environments: Technologies,
Protocols and Applications. John Wiley, 2004.
4. D.J. Cook and S.K. Das, “How Smart are our Environments? An
Updated Look at the State of the Art,” Journal of Pervasive and Mobile Computing, Vol. 3, No. 2, pp. 53-73, March 2007.
5. K.L.M. Ang, J.K.P. Seng and A.M. Zungeru, “Optimizing Energy
Consumption for Big Data Collection in Large-Scale Wireless Sensor Networks With Mobile Collectors,” IEEE Systems Journal, Vol. 12, No. 1, pp. 616-626, March 2018.
6. I.A.T. Hashem, N.B. Anuar, A. Gani and E. Ahmed, “The Role of Big
Data in Smart City,” Article in International Journal of Information Management, Vol. 36, No. 5, pp. 748-758, October 2016.
7. S. Boubiche, D.E. Boubiche and B. Azzedine, “Integrating Big Data
Paradigm in WSNs,” International Conference on Big Data and Advanced Wireless Technologies, November 2016.
8. A. Siddiqa, I.A.T. Hashem, I. Yaqoob, M. Marjani, S. Shamshirb, A.
Gani and F. Nasaruddin, “A Survey of Big Data
Management:Taxonomy and State-of-the-Art,” Journal of Network and Computer Applications, Vol. 71, pp. 151-166, August 2016.
9. L.G. Rios and J.A.I. Diguez, “Big Data Infrastructure for Analyzing
Bata Generated by Wireless Sensor Networks,” IEEE International
Congress on Big Data, pp. 816–823, July 2014.
10. N. Chand, R.C. Joshi and M. Misra, “A Zone Co‐operation Approach for Efficient Caching in Mobile Ad Hoc Networks,” International Journal of Communication Systems, Vol. 19, No. 9, pp. 1009-1028, January 2006.
11. A. Kumar, V. Kumar and N. Chand, “Energy Efficient Clustering and Cluster Head Rotation Scheme for Wireless Sensor Networks,” International Journal of Advanced Computer Science and Applications, Vol. 3, No. 5, pp. 129-130, December 2011.
12. M. Ma, Y. Yang and M. Zhao, “Tour Planning for Mobile
Data-Gathering Mechanisms in Wireless Sensor Networks,” IEEE Transactions on Vehicular Technology, Vol. 62, No. 4, pp. 1472-1783, May 2013.
13. N. Chand, “Cooperative Data Caching in WSN,” World Academy of
Science, Engineering and Technology, Vol. 6, No. 3, pp. 90-94, 2012.
14. S.S. Jawaligi and G.S. Biradar, “Reliability and Load Sensitive Data
Gathering Protocol for WSNs Using Single Mobile Sink Node,” International Conference on Emerging Technological Trends, pp. 1-10, October 2016.
15. S. Soni and N. Chand, “Energy Efficient Multi-Level Clustering to
Prolong the Lifetime of Wireless Sensor Networks,” Journal of Computing, Vol. 2, No. 5, pp. 158-165, May 2010.
16. R.N. Sharma, N. Chand, V. Sharma and D. Yadav, “Decision Support
System for Operation, Scheduling and Optimization of Hydro Power Plant in Jammu and Kashmir Region,” Renewable and Sustainable Energy Reviews, Vol. 43, No. 1, pp. 1099-1113, January 2015.
17. R.C. Shah, S. Roy, S. Jain and W. Brunette, “Data MULEs: Modeling a
Three-Tier Architecture for Sparse Sensor Networks,” IEEE Conference on Sensor Network Protocols and Applications, pp. 215-233, June 2003.
18. J. Luo and J. Hubaux, “Joint Mobility and Routing for Lifetime
Elongation in Wireless Sensor Networks,” IEEE Conference on
Computer and Communication Societies, pp. 1735- 1746, March
2005.
19. V. laxmi, “An Efficient Way to Gather Big data in WSN using Mobile
Sink Routing,” International Journal of Advanced Research in Computer and Communication Engineering, Vol. 4, No. 8, pp. 43-45, August 2015.
20. A. Kaswan, K. Nitesh and P.K. Jana, “Energy Efficient Path Selection
for Mobile Sink and Data Gathering in Wireless Sensor Networks,”
International Journal of Electronics and Communications, Vol. 73, No.
1, pp. 110-118, March 2017.
21. K.R.R. Babu, G.J. Suja, P. Samuel and S. Jos, “Performance Analysis
of Big Data Gathering in Wireless Sensor Network Using an EM Based Clustering Scheme,” International Conference on Advances in Computing and Communications, pp. 109-113, September 2015.
22. J. Du, H. Wang and Y. Wu, “A Data Collection Approach Based on
Mobile Sinks for Heterogeneous Sensor Networks,” International
Conference on Wireless Communications & Signal Processing, pp. 1-6,
October 2016.
23. Y. Zhang, Z. Zhou, D. Zhao, M. Barhamgi and T. Rahman,
“Graph-Based Mechanism for Scheduling Mobile Sensors in
Time-Sensitive WSNs Applications,” IEEE Access, Vol. 5, pp.
1559-1569, February 2017.
24. C. Gherbi, Z. Aliouat and M. Benmohammed, “ Distributed Energy
Efficient Adaptive Clustering Protocol with Data Gathering for Large Scale Wireless Sensor Networks,” IEEE International Symposium on Programming and Systems, pp. 1-7, April 2015.
25. J.W. Kim, J.S. In, K. Hur, J.W. Kim and D.S. Eom, “An Intelligent
Agent-based Routing Structure for Mobile Sinks in WSNs,” IEEE Transactions on Consumer Electronics, Vol. 56, No. 4, pp. 2310-2316, November 2010.
26. C. Konstantopoulos, G. Pantziou, D. Gavalas, A. Mpitziopoulos and B.
Mamalis, “A Rendezvous-Based Approach Enabling Energy-Efficient Sensory Data Collection with Mobile Sinks,” IEEE Transaction on Parallel and Distributed Systems, Vol. 23, No. 5, pp. 809-817, May 2012.
27. L. He, J. Pan and J. Xu, “A Progressive Approach to Reducing Data
Collection Latency in Wireless Sensor Networks with Mobile Elements,” IEEE Transaction on Mobile Computing, Vol. 12, No. 7, pp. 1308-1320, July 2013.
28. C. Zhu, S. Wu, G. Han, L. Shu and H. Wu, “A Tree-Cluster-Based
Data-Gathering Algorithm for Industrial WSNs With a Mobile Sink,” IEEE Access, Vol. 3, No.1, pp. 381-396, May 2015.
29. A.A. Safia, Z. Aghbari and I. Kamel, “Efficient Data Collection by
Mobile Sink to Detect Phenomena in Internet of Things,” Information, Vol. 8, No. 4, pp. 123-140, October 2017.
AUTHORSPROFILE
Tanuj Wala is Ph.D. scholar in Department of Computer Science and Engineering at National Institute of Technology Hamirpur, India. She received her M.Tech. and B.Tech degrees (with Honors) in Computer Science and Engineering from Himachal Pradesh University Shimla, India. Her areas of interest include wireless sensor network and Internet of Things.
Dr. Narottam Chand is Associate Professor at Department of Computer Science and Engineering, NIT Hamirpur. He received his PhD Degree from IIT Roorkee in Computer Science and Engineering. Previously, he received M.Tech. and B.Tech. degrees in Computer Science and Engineering from IIT Delhi and NIT Hamirpur, respectively. His current research areas of interest include mobile computing, mobile ad hoc networks, wireless sensor networks and IoTs. He has published more than 170 research papers in journals and conferences. He is Fellow, Institution of Engineers, India and Senior Member of IEEE.
Prof. Ajay K. Sharma is Vice Chancellor at IK Gujral Punjab Technical University Kapurthala, Punjab. He is professor of Computer Science & Engineering at National Institute of Technology Jalandhar. He received his PhD degree from NIT Kurukshetra in
Electronics Communication and Computer
Engineering. His current research areas of interest include optical communication systems: performance analysis and dispersion compensation for broadband optical systems and networks (linear and non-linear), radio-over-fiber, optical networks and wireless communication systems. He has published more than 280 research
![Fig. 2. Big data model [5]. Fig. 2 describes the big data which contains information](https://thumb-us.123doks.com/thumbv2/123dok_us/8160523.249502/2.595.57.281.358.556/fig-big-data-model-fig-describes-contains-information.webp)