Ames Laboratory ISC Technical Reports Ames Laboratory
6-1953
Aluminum-vanadium system
D. J. KenneyIowa State College H. A. Wilhelm Iowa State College O. N. Carlson Iowa State College
Follow this and additional works at:http://lib.dr.iastate.edu/ameslab_iscreports Part of theCeramic Materials Commons, and theMetallurgy Commons
This Report is brought to you for free and open access by the Ames Laboratory at Iowa State University Digital Repository. It has been accepted for inclusion in Ames Laboratory ISC Technical Reports by an authorized administrator of Iowa State University Digital Repository. For more information, please [email protected].
Recommended Citation
Aluminum-vanadium system
Abstract
The nature of the aluminum-vanadium system has been reported on the basis of thermal, microscopic, chemical and X-ray evidence. The system contains six different solid phases at ambient temperatures: the four intermediate phase being peritectic in nature. Phase properties are summarized in Table 1.
Keywords Ames Laboratory Disciplines
Ceramic Materials | Engineering | Materials Science and Engineering | Metallurgy
l
..
UNITED STATES ATOMIC ENERGY COMMISSION
' )} .. (.' 1 ' ISC-353
ALUMINUM-VANADIUM SYSTEM
By
D. J. Kenney H. A. Wilhelm 0. N. Carlson
June 1953
2
METALLURGY AND CERAMICS
This report has been reproduced direct from cop,y as submitted to the Technical Information Service.
Work performed under Contract No. W-7405-eng-82.
Arrangements for reproduction of this document in whole or in part should be made directly with the author and the organiza-tion he represents. Such reproducorganiza-tion is encouraged by the
United States Atomic Energy Commission.
I.
II.
III.
ISC-353
TABLE OF CONTENTS
ABSTRACT . . .
.
.
• 0 {I • INTRODUCTION.REVIEW OF LITERATURE.
A. Historical Survey . . .
B.
c.
1.
2.
Metallography: . . . . Commercial applications . . Discussion of Reported Work Summary of Pertinent Facts.
0 • C) 0 C)
. .
3
Page 5 7 8 8 8 11 13 13IV. SOURCE OF MATERIALS •
14
14
15
15
v.
A. B.c.
A 1 urn in urn • • • • • • • • •
vanadium . . . . • • • . A 11 oy s . o • o o • • • o
APPARATUS AND METHODS • 21
A. Obtaining Thermal Data. o • • 21
B. Annealing the Alloys. . . 23 C. Preparat ion of Samples for Microscopic
Examination . . . 24 1. P o l i s h i n g . . . .. . . . 24 2. Etching. . . • . . . 25 D. Preparation of Samples for X-Ray Analysis 26
1. Powder specimens .
2. Solid samples . .
3.
Single crystals.E. Chemical Analysis . .
1. 2.
Volumetric . . .
Spectrophotometric
.
.
.
27 27 30 31 31 31
VI. EXPERIMENTAL RESULTS . . . 31
31 A. Macroscopic Nature of the System.
1. Density . • • . o • • • o • • 31
20 Hardness . o • o o • • • o o • o o o 32
4 ISC-353
Page
B. Microscopic Nature of the System
.
. .
•.
36 1. Introduction..
0. .
.
0. .
0 0 362. Phase properties.
.
.
.
.
0.
0 0 0.
37lil
(Al). o.
0 0 0.
0 37~!Al-Vl
0 0.
0 0 0 0.
0.
37j9 Al-V 0
.
.
0.
.
0.
37o
Al-V 0 0. .
0 0.
.
.
.
0 0 39~
'
~~
cF(Al-V.
0 0 0 0.
0.
.
.
.
.
39 (V) . o 0.
0. .
0 0.
423o Phase relations 0 0 0 0 0 0 0 0
.
45c.
Atomic Nature of the System..
0. .
0 0 601. Introduction.
.
0.
. .
.
.
60(a~
fAl-Vl.
.
.
0.
.
.
66(b Al-V .
. . .
.
.
.
.
68~~~
?Al-V .. . .
.
. .
.
71Al-V .
. .
.
.
722. Phase transitions
.
.
.
75VII. DISCUSSION AND SUMMARY
.
•.
.
.
76ISC-353 5
*
ALUMINUM~VANADIUM SYSTEM
by
D. J. Kenney~ H. A. Wilhelm~ and 0. N. Carlson
I. ABSTRACT
The nature of the aluminum-vanadium system has been
reported on the basis of thermalj microscopic, chemical and
X-ray evidence. The system contains six different solid
phases at ambient temperatures: the four intermediate phase
being peritectic in nature. Phase properties are summarized
in Table l.
The effect of composition upon density can be represented
by a s~ries of straight lines; the phase boundaries of the
aluminum-vanadium system seem to have some correlation with
the discontinuities in slope of these straight lines •. The
addition of 20 weight per cent aluminum has l ittle effect
on the hardness of either as-cast or cold-worked vanadium.
All hardness values observed for alloys containing up to 20
pe~ cent by weight aluminum fell within 10 points of 60 on
the' Rockwell 11A11 scale. On the. other hand~ the addition of
vanadHim to aluminum9 has a profound effect on the hardness
of the metal. The arc-melted alloys were cold pressed
under 50 thousand psi and reduced as much as 50 per cent in
thickness& A surprising feature of these alloys is that
upon annealing in vacuo at 600°C for 24 hours the
cold-worked metal became ha•rder rather than softer.. This is
attributed to the development of a brittle peritectic c
om-pound (such as Al11V) whose formation was suppressed during
the rapid cooling of the arc-melting furnace.
Aluminum will dissolve less than 0.5 per cent vanadium
in solid solut1on9 while vanadium will dissolve up to 25 per
cent aluminum at room temperature . A maximum solid solubility
of 35.3 per cent aluminum in vanadium occurs at 1670°C. Of
the four intermediate phases~ only dr(Al-V) shows an
appreci-able solid solubility range (47 to 55 per cent vanadium at
1360°C) 'i ·this solubility range decreases with decreasing
temperature and is almost negligible at room temperature.
*
This report is based on a Ph.D. thesis by Donald J. Kenney!""'\ 1.1\ !""'\ I 0 tr.l H '-0
<'-Phase (Al)
·Formula
Crystal sym. F~C.C ..
Lattice const.
(i)
a0 • 4.0496a0
=
4.048lbSpace group
Atom/unit cell 4
-Structured Al ~
Peritectic temp. 660°c
a
Melting point of pure vanadium.
Table 1
Summ~J of Phase Properties
~ (Al-V)
Al'V ll
-"
F.c.c ..aa
= 14.5,86'
~: - FD3
h -192 e 685°c {j(ll-V) ~~ Hex .. t
o
(Al-V)Al . 3
v
-F.C,.T ..
cf(AJ...:.TJ)
Al8V5 \
BoC.C.
a0
=
7.718' a0= 5.3434 a
0=
9.207 'c0
=
17.15 c0=
8.3257D
~:
-
-
ob",2c cTit~
"
F 4/l1111111lT~
-Ili:lm
.
56 lq 52,
Do22
' '
735°C _ i360°C.
D82
i670°C
bLattice constants of (V) saturated with (Al-V) and (Al) saturated with
(Al~V).
c- - -~
Highest symmetry group of three possible groups ..
dStrukturbericht designation.
e- ,
No analogous compound reported.
(V)
B.c .. c.
ao "" 3,031
ao =- 3.069b
2·
A2
\.
ISC-353 7
The solid solution phase$ (V) 9 is the primary phase to
crystallize from the melt in all alloys containing more than
50 per cent vanadium.
The crystal structure of each phase was pursued short of
quantitative intensity measurements9 and an unambiguous·
formula is provided for each of the intermediate phases. A
correlation of the various phase structures indicates that
a marked tendency toward super-lattice formation exists in
the aluminum-vanadium system~ An aluminum atom exhibits a
preference for four nearest vanadium neighbors and four
near-est aluminum.neighbors arranged tetrahedrally.
II. INTRODUCTION
With the advent of atomic power~ which is often conceived
as being furnished by a metal furnace burning metal f~el~ a·
major surge of renewed interest has been experienced iri
physi-cal metallurgyo Although there are·many instances where-an
alloy system has been investigated purely out of academic
interest~ research on metals and alloys is enhanced by a
commercial need for useful materials. Accordingly~ the
metal-lurgical literature of the first half of this century is
dominated by alloys of such metals as iron~ copper and
alumi-num. However» the index of usefulness for power generating
materials must now include nuclear as well as other
proper-ties; and so the current literature has been infiltrated with
alloys of such laboratory curiosities as zirconium9 vanadium9
thorium and uranium. Titanium and niobium have also assumed
added significance.
The physical and chemical properties of an alloy are
hard-ly predictable from the nature of the pure components. Th~
has necessarily led to the accumulation of large amounts of
data in the trial and error search for desirable materials.
However from nuclear considerations9 it is strictly true that
an alloy is no better or worse than the sum of its components
since alloying or chemical combination will not effect the
nuclear properties of the elements involved. Hence9 a list
of promising alloys can be quickly compiled from a nuclear
viewpoint9 and the systems may be then eliminated one by one
when experimentation has shown that there is little hope of
improving upon the physical and chemical properties of the
parent metals.
Phase diagrams are useful in summarizing some of the data
8
ISC-353serve a~ a-~ough guide for their treatment and beha~ior. Most
of the phase diagrams of the promising binary systems of light
metals have been'thoroughly investigated with the exception
of the aluminum-variadium·system. This is rather surprising in vi~w of the elementary properties of these two metals.
Of all the commercially important metals which entered the atomic era3 only aluminum has been extensively employed
in the internal structure of atomic reactors. The physical
properties of aluminum are well known; but in addition to
these3 it has a low capture cross section for thermal neutrons (1) and also for fission neutrons (2).
Then» too, vanadium is an excellent structural material for fast reactors
(3).
Its high melting point3 ease of fabrica-tion» and ductility might be sufficient recommendation; butwhat is more significant3 vanadium has an absorption cross-section of about 2.2 millibarns for effective energy neutrons
of 1 mev: the lowest cross-section of any metal in the first transition series.l The ductility of vanadium is such that the pure metal can be formed into bars» sheets3 wires and rods with existing techniques; in addition, it has an elastic modulus-density ratio practically equivalent to that for
steel (4). Finally~ the abundance of vanadium in the earth's crust is equal to that of copper3 zinc and lead combined
(5).
Therefore3 it would appear highly profitable to
investi-gate the phase relations of the aluminum-vanadium system pay-ing particular attention to those alloys which appear to have some significance for the atomic energy program.
III. REVIEW OF THE LITERATURE
A. Historical Survey
1. Metallography
The literature dealing with the aluminum-vanadium system is meager and contradictory. In order to evaluate the reported 1correspondingly, Mg has 0.60 millibrans and Al has 0.40
milli-barns. Be is considered to be too brittle for general use, and Al is the last structural metal to have a harmfu~ moderat-ing effect which diminishes with increasing atomic weight. Hence, aluminum and vanadium suggest an alloy of highest
ISC-353
9
results, it is necessary to refer to a table of the
theoret-ical compositions of possible intermetallic compounds as
shown in Table 2. The system is by no means this complicated,
but most of these formulae have a literary existence or an
analogue in a similar system and hence will be mentioned occasionally below.
In 1902, Matignon and Monnet (6) studied the grain-refinin~ effect of vanadium upon aluminum-copper alloys;
it was mentioned in passing that a residue was isolated by
chemical means from an aluminum-vanadium alloy containing 76.9 per cent vanadiumo This residue had approximately the
composition AlV but the details of this work are not
avail-able.
About ten years later, Czako (7) investigated a series of alloys which were prepared by the alumino-thermic
reduc-tion of vanadium pentoxide. He found that alloys
contain-ing less than 10 per cent vanadium (by weight) were
malleablk. The hardness rapidly increases (20 to 20 per
cent vanadium alloys could be pulverized easily) and
reaches
a
maximum at about 53 per cent vanadium. With theaddition of still more vanadium, the alloys become softer
and the polished sections become free of the troublesome
cavities encountered with the high aluminum alloys.
Czako reported further that an alloy containing 1 per
cent by weight of vanadium in aluminum, contained crystals
of an intermediate aluminum-vanadium phase, the amount of
which increased with increasing vanadium content until the
34.5 per cent vanadium alloy consisted almost entirely of
this new phase. By treatment of this last mentioned alloy
and also a 30 per cent vanadium alloy with dilute
hydro-chloric acid, crystals containing 37o9 per cent vanadium
were isolated. An alloy of 53 per cent vanadium also
proved to be microscopically homogeneous with a second
intermediate phase. From an alloy of 58.3 per cent vanadium,
small crystals with 64.8 per cent vanadium could be isolated.
And finally, the alloy containing 79.3 per cent vanadium
was also a single phase which Czako suggested was Alv2 •
Schirmeister (8) studied the technically important
effects of the addition of some twenty metals, including
vanadium to commercial aluminum. It was reported that an
attempt was made to measure the hardness of these various
alloys, but the original article is not available for
examination. However, the work of Czako and Shirmeister
was incorporated by·corson (9) into the probable phase
10 ISC-353
the work of Schirmeister and quoted him as saying that the
3 per cent vanadium alloy does not shrink or pipe and that
alloys containing more than 3 per cent vanadium swell on
freezing. Schirmeister found it quite difficult to alloy
aluminum with vanadium; this experience was confirmed by
Fuss and also by the present work. In testing the physical
properties of his commercial aluminum-vanadium alloysJ
Schirmeister employed a 2 per cent vanadium sheet which
was annealed at 300-350oc; he reported a tensile strength
of 17,000 to 18J500 psi with an elongation of 27-28 per
cent and a Brinell hardness of 35.
Table 2
Theoretical Phase ~eomposition
Formulae Wt. Per Cent vanadium
14.65
21.23
23.94
27.41
32.08 38.62
45.55 54.25 55.73 61.72 65.40 79.10
In this supplementary investigation» Fuss (10$ p. 152) found that the microstructures of aluminum-vanadium alloys
were similar to aluminum-iron» aluminum-manganese» and
aluminum-molybdenum alloys. vanadium showed no apparent solid solubility in aluminum and a eutectic was found to
exist in the system.
The solid solubility limit has been obtained by an
unknown worker (11) who measured the conductivity of aluminum containing small amounts of vanadium. An abstract of a
research memorandum from the A.F.C. (French Alum!num Company)
ISC-353 11
shows that vanadium lowers the conductivity of aluminum,
the effect being proportional to the amount of vanadium up
to Oo65 per cent vanadium by weight which is the solid
solubil!ty limit. Unfortunately9 no heat-treatment data
are availableo
Roth (12) made a thorough study of the solid solubility
of vanadium in aluminum by employing lattice constant
measurements and conductivity data (Figures 2 and 3)o He found the solubility limit to be Oo37 weight per cent
vanadium at
630°C
9 and this value remained unchanged at500, 350» and 2000Co His alloys were prepared by
melt-ing pure aluminum and a 2.5 per cent master alloy in
graphite; the alloys thus prepared contained as impuriti~
a maximum of 0.006 per cent iron and 0.005 per cent silicon.
The compound Al3
v
was found to have a tetragonal typeof crystal structure and the lattice constants were measured
by Brauer (13). The alloys were prepared by the reduction
of vanadium pentoxide with pure aluminum in cryolyte und~
argon. The crystals were separated from an alloy
contain-ing 10 per cent vanadium by slowly dissolving the alloy
in dilute, warm hydrochloric acid. The crystals so
obtained analyzed to give 36.5 per cent vanadium.
Mondolfo (14) published no experimental data but did
show a micrograph of a commercial aluminum-vanadium master
alloy which contained 2.4 per cent vanadium~ 0.42 per cent
silicon and 0.56 per cent iron. In this picture» he
identified five phases as~ Al V, Al4v~ Al7V» (Al-Fe-Si),
and aluminum solid solution. ~his would indicate that the
~ow-vanadium portion of the system resembled the aluminum-chromium or aluminum-manganese system» but he did not indicate the extent of his experimental work.
2. Commercial applications
There have been a few commercial applications of a
lumi-num-vanadium alloys. Investigation by Clark (15) into the
effect of vanadium in causing resistance to fatigue» inc~ased
elongation» and improved homogeneity in the non-ferrous
field has shown that 2 per cent vanadium in aluminum
mater-ially increases both the hardness and strength of aluminum.
A 4 per cent vanadium alloy is strong enough for structural
purposes; a 10 per cent vanadium alloy is used to stiffen
the framework of airplanes9 piston rings9 gearboxes9 and
electrical equipment (16). Alloys containing up to 10
12 ISC-353
• I 0 X E u ~
.. ..
c: 0-
"' c0 ~ ....
..
..
-(!) . ·;·
"
~~
~\
"
'·> '- <::.~ -;;;:-' ~
'-.
''-. " ' ~
'-.
'-Fig. 1--Probable phas~ diagram of
Al-V system (Corson (8, p. 135)).
4.0420
4.0446
4.044 2
4.0408
4.0404
Gliihtemperatur 630 °
Gliihdauer 14 Taoe
0 0
Vanadium in At.- %
0
Fig. 2--Lattice constants of
alumi-num alloys {Roth (11, p. 358)).
36 N E e34 E
..
~30 J: :o--
..J28..
..
.c:. u "' ~26 ~..
Qj 24 Gliihtemperatur: 630° GIUhdauer: 4: walzhart2:8 Stunden
3: 24 4; 5 Tage
5: 44 "
Vanadium In Gew.-o/0
Fig. 3--Conductivity of aluminum
alloys (Roth (11, p. 357)).
[image:14.566.42.517.125.659.2] [image:14.566.297.518.361.679.2]ISC-353 13
strong» hard~ and corrosion-resistant. Alloys containing
about -63 per cent vanadium are hard and very resistant to
acids.
In addition to the above-mentioned uses Eborall (17)
has shown that vanadium is a powerful grain refiner when
added to aluminum in quantities up to 1.5 per cent;
vana-dium also has a grain-refining effect on aluminum-copper ·
alloys and renders them susceptible to heat treatment (11,
p. 472).
B. Discussion of Reported Work
In summary, it might be pointed out that only in the case
of the high-aluminum porti on of the system has any serious
investigation been undertaken9 and the results are not con-clusive. czako's (79 p. 141) original work showed a
micro-graph of an alloy containing 1 per cent vanadium in which
white crystals were scattered uniformly throughout a grey
matrix. The white crystals, which he identified as Al~V, made up about 15 per cent of the area. This means that
either the picture was not representative of the alloy,
or else the white crystals contained far less vanadium than
Al3V. The reason being~ of course, that th~ white crystals
cannot contain more than the total amount of vanadium in
the sample.
The same criticism can be raised about Roth's (12, p. 357)
micrographs of the alloys used to determine what he assumed
to be the solubility limit of Al 3
v
in aluminum. It isinteresting to note that if Roth annealed his alloys at
630°C for 14 days9 then according to Mondolfo (14, p. 48), his microstructure should have shown crystals of Al7
v
surrounded by a matrix of aluminum solid-solution. Then,
too, Brauer (13, p. 208) obviously had no knowledge of
Mon-dolfo1s work for he slowly cooled a 10 per cent vanadium
alloy from 1200°C in order to obtain single crystals of Al3V.
Perhaps it is pertinent to say that the existence of
Al3V is fairly well established; the existence of Al7
v
andAl4V has been pointedly ignored by all investigators save
Mondolfo9 who published no data and worked with alloys con-taining relatively large amounts of iron and silicon; and
the existence of any further compounds is uncertain.
c. Summary of .Pertinent Facts
14 ISC-353
Melting Points
Al 660o2°C
Al7V 750
Al4V 950
v
1725r935l
v
1780 1949v
1899 1951Density
Al 2o6978 (25°C)
25°C) Al 2o695 (X-ray,
3o68 Al 3V
v
5o96Crystallography Al- FoCoCo' a0 =
=
V - B • C • C o ' ~0Al3V- FoCoT.; a0
=
4o0414 ~o 3.03380Ro
5o344
A;
~Q=
IV. SOURCE OF MATERIALS
A. Aluminum
(1938~
(1935
Because it contains a large amount of iron and silicon»
ordinary commercial aluminum is not suitable as a starting material for equilibrium studieso Since 19259 when
electro-lytically refined aluminum became available (18), many
anomalies appearing in literature of binary aluminum alloys can be credited to the fact that some investigators were using aluminum of extremely high purity while others were not. Hence» a standard has been laid down (19) whereby the minimum purity for aluminum used in equilibrium studies
shall be 99o99 per cent, and the other metals used for the
work shall be the purest obtainableo
Unfortunately, this high purity aluminum was not
avail-able in sufficient quantity for the present work and the
following plan had to be adoptedg Five pounds of massive alumi.num.l> containing a minimum of 99o75 per cent aluminum.$ was obtained from the Aluminum Company of Americao This
metal was used in the practice preparation of alloys9 in
ISC-353
dependent upon purity. One pound of massive aluminum; con..:
taining a minimum of 99.9 per cent aluminum was obtained from
the A. J. Mackay Company. This metal was used in the pre..:
paration of all samples whose physical and chemical
proper-ties are reported below.
B. vanadium
It was not possible to procure any large quantity of pure
commercial vanadium. However9 one pound of 99.5 per cent vanadium was obtained from the Electro-Metallurgical Division
of Union Carbide and Carbon Corporation with an assay as
follows~
0 - O.Q~6%
c -
0.19%H - 0.001~%
All Others - 0.10%
Since vanadium reduced in this laboratory was found to be
superior in certain respects to this commercial metal, the
latter was only employed in a preliminary survey of the
system and in diffusion studies.
The Ames vanadium, which was used in the preparation of
the final series of alloys, was prepared by the calcium
reduc-tion of vanadium pentoxide in a sealed bomb. The method has
been standardized and reported by Long (20) and Powers (21). Pure iodine was used as a booster and the sources of the
materials are as follows~
Vanadium pentoxide·C. P. (Vanadium Corporation of America')
Analysis~ Si029 0.01%; Cl,~.003%; Fe, 0.005%; Alkalies, trace.
Calcium (Ames redistilled)
Analysis~ Fe 9 14 ppm; Mn 9 13 ppm» N, 100 ppm.
Iodine U.S.P. XIV resublimed (Mallinckrodt).
No quantitative purity of the metal thus produced is
avail-able, but the metal gave a hardness value of Rockwell-B-67,
whereas the commercial vanadium gave Rockwell-B-97 under
similar circumstances.
c.
AlloysAs was mentioned above, aluminum-vanadium alloys are quite
difficult to prepare. Solid vanadium dissolves extremely
16
ISC=353slowly in molten aluminumj) and aluminum has a ·tendency·to distill out of·molten vanadium. Then too-above 1000°Cj) contamination-from the crucible -and atmosphere becomes
a formidable problem for vanadium (22)o
It was only logical then9 to turn to arc-melting as
a possible means of avoiding contaminationo In a
labora-tory arc-melting furnacej) a doCo arc is usually struck
between a tungsten electrode and the sample9 which 1~
resting on a water-cooled copper crucibleo The sample is
melted and cooled quite rapidlyj) and the entire operation
can be performed in a purified helium or argon atmosphere&
The product is generally a bright metallic button which has
suffered very little contamination from the furnaceo
However9 in keeping with their seeming incompatibility.~)
aluminum and vanadium still offered great resistance to
alloying by arc-melting~ The piece of solid vanadium in
the puddle of molten aluminum directly beneath the arc
would sink down to the bottom of the crucible where it would
remain relatively coolo If too much power were applied
to the arc9 the aluminum would boil away~ when the button
was turned over and remelted9 the vanadium would again
sink to the bottomo Naturally9 each time the sample was
remelted a little more vanadium would dissolve in the
aluminum and if this alloying by attrition is continued long
enough a homogeneous sample will be producedo
To insure a macroscopically uniform sample9 andj) at the
same timej) to prevent the time consumption from being
exorbi-tant, the following procedure was adopted for the
prepara-tion of the final series of alloysz The aluminum and
vanadium samplesj) not exceeding a combined weight of ten
gramsj) were arc-melted and flipped four or five timeso
The resulting alloys~ in the composition range of 40 to
80 per ce~t by weight vanadiumj) proved to be too brittle to
cold work and were employed in the arc-melted combinationo
The rest of the alloys were cold-pressed after arc-melting
with a reduct1Qn of from 30 to 60 per cento In the
composi-tion range of 0 to
30
per cent vanadiumj) where segregationor the vanadium proved to be unusually troubleaome9 the
arc-melting and cold=working operations were repeatedo Samples
from the entire series of alloys were then cut or broken as
needed for heat treatment9 and X=ray or microscopic
examina-tiono One of the natural disadvantages of melting such small
quantities of metal at a time was that the number of tests
that could be performed on any particular alloy was limitedo
It was found that careful attention to the loss in weight9
ISC-353
17
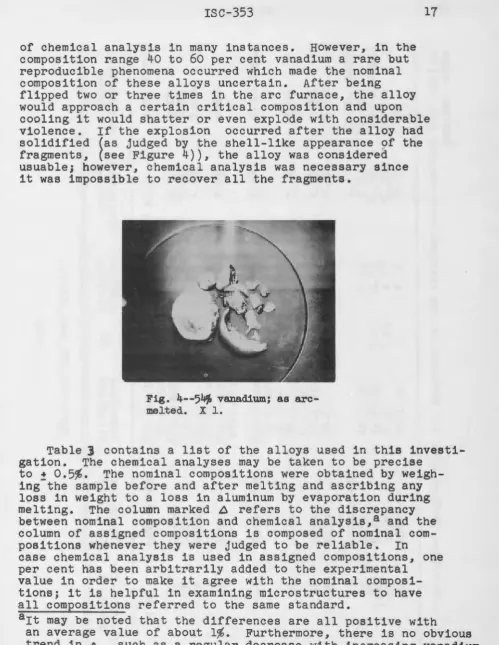
of chemical analysis in many instances. However, in the
composition range 40 to 60 per cent vanadium a rare but reproducible phenomena occurred which made the nominal composition of these alloys uncertain. After being
flipped two or three times in the arc furnace, the alloy
would approach a certain critical composition and upon
cooling it would shatter or even explode with considerable violence. If the explosion occurred after the alloy had
solidified (as judged by the shell-like appearance of the
fragments, (see Figure
4)),
the alloy was consideredusuable; however, chemical analysis was necessary since it was impossible to recover all the fragments.
Fig. 4--5~ vanadium; as arc-melted. X 1.
Table ] contains a list of the alloys used in this
investi-gation. The chemical analyses may be taken to be precise
to ~ 0.5%. The nominal compositions were obtained by
weigh-ing the sample before and after meltweigh-ing and ascribweigh-ing any
loss in weight to a loss in aluminum by evaporation during melting. The column marked ~ refers to the discrepancy
between nominal composition and chemical analysis,a and the
column of assigned compositions is composed of nominal
com-positions whenever they were judged to be reliable. In
case chemical analysis is used in assigned compositions, one
per cent has been arbitrarily added to the experimental value in order to make it agree with the nominal
composi-tions; it is helpful in examining microstructures to have
all compositions referred to the same standard.
art may be noted that the differences are all positive with
an average value of about 1%. Furthermore, there is no obvious
trend in ~ , such as a regular decrease with increasing vanadium
[image:19.565.44.544.48.694.2]Table 3 :-.L'.... l2
Alloys use'dl. Ji~n,-:Th:ts -WOOrk '·-:: ~-- -T I:_":~
Alloy Nominal Chemical A Analyst •s Arc-melting Assigned
designation composition analysis reference reference composition
DJK-2-82-2 9.1%
v
5.4% - -~l . MOB-1~175 BLF-l-Ml93 6%
v
5~4 DJK-3-58
.... 82-3 17.3 17~8 MOB-1-175 -Ml95 19
-82'"-4 31:2 30~6 -l'-175 -M227 32
-82-5 40.4 40~5 -1-175 -Ml97 42
41~3 DJK-3 ... 49
-82-6 50.4 52.5 MOB-1-175 -M226 54
(Y')
53.2 DJK-3-54
I!\
(Y')
I
DJK-2-82-7 65.9 62.5 MOB-1-175 BLF-l-Ml92 66
0
(/)
64.2 DJK-3-55
H
64.8 DK-1-34
-82-8 81.5 81.3 DJK-3-48 -Ml90 82
81.2 DK-1-34
-82-9 86.2 85.4 DJK-3-47 -Ml89 86
-82-10 93.4 93.5 -3-45 -Ml94 94
DJK-2-106-13 21.2 BLF-2-M559 22
-106-16 38.7 37.7 DK-1-34 -M562 39
DJK-4-44-MC 32.7a 32.2 -t0.5 LFB-2-17 -M628 32.7
-Me I
36.3a 35 .. 6 -t0.7 2-17 -M631 36.3
-MC 38.0 37.4 DK-1~30 -M629 38
aAlloys that did not lose material due to breakage and were weighed before and
<X)
after melting •
[image:20.560.72.689.85.487.2]'
" lr
Table
§
(Continued);:~~·· ··;.~:~~-=-:::-::
.
--··
Alloy - Nominal Chemical A Analyst's Arc-melting Assigned designation composition analysis reference reference composition
-··
DJK-4-44-MC 39~4 47o4 DK-1-30 BLF-2-M630 ?
-MC 42~7a ""M633 42.7
-MC 52~4 51 ;4 DK-1-30 -M634 52
-MC 56~2 52~8 1-30 --M646 54
-MC 66)+ 46;2 ·1-30 -M635 ?
51~1 LFB-2-17
-MC 78~7a 75.9 +2.8 DK-1-30 --M632 78~7
-Me 90.7a -M627 90.7
DH:K-4-47-MA 14.3a 12.6 -t-1.7 MEF-2-30 BLF-2-M649 14:3
-MA 17.7a -M654 17;7
=MA 23.8a -M664 23~8
=MA 27.2a -M665 27.2
DJK-4-47-MA 43~8 41.9 DK-1-30 BLF-2--M653 43
~MA 57~6 57.1 DK-1-30 =M651 58
-MA 66.8 65.5 +1.3 1-30 -M652 66
-MA 71.6 50.6 1-30 -M644 52"
-MA 82.2a 81.5 -t-0.7 LFB-2-17 -M662 82;2
-MA 86.1a 84!1 -t2.0 -2-17 -M657 86.1
aAlloys that did not lose material due to bre~kage and were weighed before and
after melting.
H
Ul 0
I w
Vl
[image:21.564.73.643.85.412.2]w
...
(Y") 1.[\ (Y") I 0 U) H 0 (IJ
Alloy - ·Nominal
-designation Composition
DJK-4-46--..MD o:4a
... MD r:-6a
·
:-MD 3~5~
-":'MD 6:3a
-MD 10.1a
D JK-4-46-MD 92:5a
-MD 94~4a
-MD 95.3a
-MD 98.6a
Table 3 (Continued)
-.,._ -" - 4 · · - •
Chemical Analyst's
analysis A reference
0~1 +0~3 MEF-2-30
1.1 "'1'0.5 2-30
2:7 -...0~8 2-30
4:7 ... 1~6 2<-30
7.6 +2.5 2-30
91.5 LFB-2-17
Arc-melting reference BLF-2-M660 -M675 -M661 -M650 -M659 BLF-2-M643 ..,M658 --M656 -M655 :Assigned --composition o:4 1~6 3:5 6:3 10.1 92:5 94~4 95~3 98.6
aAlloys that did not lose material due to breakage and were weighed before and
[image:22.565.72.690.67.303.2]ISC-353 21
V. APPARATUS AND METHODS
A. Obtaining Thermal Data
Since the system covered such a large range of melting
temperatures~ it was inevitable that several different
tech-niques had to be empl6yed for obtaining thermal-data. The
use of a resistance furnace~ quartz vacuum tube; arid
chromel-alumel thermodouple provided the most accurate-dat~;
but this method was prohibited above -1100°C by the structural
limitations of·quartz. The next nat~ral change in techni4u~ ·
came at 1500°C» at which point plat~num-rhodium thermocouples
consistently burn out. The final method» and perhaps the
most inaccurate» was the use of an optical pyrometer for ·
observing visual signs of melting in this system up to 1900°C.
Naturally» overlapping data were obtained by the three
methods» and the results are in good agreement if it is
remembered that an uncertainty of as much as 25°C sometimes
exists in pptical-pyrometer data.
A photograph of the equipment designed spec.ifieally
for the range» 600 to 1100°C3 is shown in Figure~ 5~
The
heating was done by a 2500 watt electrical re&~atance ifurnace which
accommodated a 3 inch outside diameter quartz tube. The power
for the furnace was supplied by a 220 volt powerstat driven
by a Modutrol motor. The system was evacuated by a 60
liter-per-second-capacity» water-cooled» oil diffusion pump
and a Welch Duoseal» "1400".~~ mechanical backing pump. It
was necessary to place a D.P.I. Phillips vacuum gauge behind a liquid nitrogen cold finger since the presence of aluminum
vapor would be harmful to the gauge. The vacuum could
always be maintained below 0.02 microns» even during the
initial heating period.
The procedure was to suspend a 1 inch outside diameter.~~
graphite bucket from a rubber stopper at the top of the
vacuum head. A 1 inch outside diameter thoria crucible
con-taining the alloy and an alumina thermocouple protection tube
was placed inside the graphite bucket.~~ and the whole assembly
was su~pended in a 2! inch outside diameter refractory
cylinder supported from the bottom of the quartz tube. The
usual thermocouple and differential thermocouple connections
were made in accordance to recommended procedure (19.~~ p. 9).
The differential thermocouple made it possible to measure
and» at the same time» control the temperature gradient from
22 ISC-353
Fig. 5--Thermal analysis :f'urnace.
heating and cooling rate and also served to sharpen and magnify
the thermal arrests. This differential thermocouple of
chromel-alumel-chromel was connected to a Brown Electronik circular
scale potentiometer which in turn energized the Modutrol motor
mounted on the powerstat. The thermal emf of the chromel-alumel
thermocouple was measured by a Brown Electronik recording strip chart potentiometer of the print-wheel type; this instrument
could record both the temperature and temperature gradient in
the system. Hence, the thermal arrests could be detected
dur-ing a constant rate of heating or cooling as described above; or else the powerstat could be fixed at a definite voltage,
and the thermalarrests be detected during heating or cooling
at constant power in-put.
It was found convenient to maintain the thermocouple
cold-junctions at 35oc by means of the constant temperature oil
[image:24.564.12.527.56.671.2]ISC-353
23
calibrated with three melting point standards (Al; cu-Ag, and
Ag) furnished by the National Bureau of Standards; arid three · or four duplications of each run showed that the thermal arrest
of a 10 gram sample could be measured precisely to + 1°C.
B. Annealing the Alloys
· The importance of obtaining equilibrium alloys was
accen-tuated by the four peritectic reactions of this system. Everi
if the parent alloy contained no segregation on a macros6opic scale, it
was
safe··to
assume that no alloy in the rangeor-
·
10 to 60 per cent vanadium was ·at microscopic equilibrium in
the as-cast or as-arc-fuelted condition. The removal of
segregation or concentration gradients in the ·parent alloy
was described above in ·the section on alloy preparation; the
method for obtaining equilibrium on the microscopic scale
will be described here.
Only a small portion (1 to 2 grams) of the cold-worked·
parent alloy was used in the hope that any remaining
concen-tration gradient would be removed during the annealing run.
Ten to fifteen samples were placed in two alundum boats
stacked vertically. The samples were vacuum heated in one
of several systems typified by the one shown in Figure 6.
At the end of the prescribed heating period, these samples
were allowed to furnace cool or were quenched in water. Any
change in weight upon annealing was measured with an an
alyti-cal balance; a loss in weight could be attributed to ev
apora-tion of aluminum and a gain was assumed to be due to ox ida-tion of the sample. The loss in weight observed never appreciably altered the composition, and if the specimen
gained more than Oo3 per cent$ it was discardedo Signs of
melting or other irregularities were noted before mounting
the specimen for microscopic examination.
The vacuum systems employed in annealing experiments
(see Figure 6) were composed of a quartz tube within the fur~
nace9 a diffusion pump with cold trap and a mechanical
fore-pumpo The ultimate vacuum attained upon long standing was
of the order of OoOOl microns and the pressure was not allowed
to exceed 0.02 microns during the heating cycle. A
kanthal-wound resistance furnace was regulated by an electronic con~
troller which registered the hot-junction temperature of the chromel-alumel thermocouple inside the quartz tube. Since
it was not possible to place the samples in contact with the
thermocouple, the annealing temperature may not be relied on
24
ISC-353Fig. 6--Typical annealing apparatus.
merely relieve the vacuum with argon gas and quickly shake the contents of the quartz tube into a pan of water.
A heating schedule for the alloys used in this work is presented in Table
4.
In view of the long periods of time involved, power failures constitued a real menace and samples were sometimes discarded because they were too badly oxidized. The total, accumulated, running time for all the specimens was in excess of 35,000 hours; hence, economy dictated that the fullest pos~ible use be made of each sample. The life history of a typical sample might include an investigation of work hardening, annealing and quench-hardening, melting and macro crystal growth, microstructure, and finally, X-ray patterns in either the solid, powder, or single crystalstate.
C. Preparation of Samples for Microscopic Examination
1. Polishing
The specimens for microscopic examination were usually
[image:26.562.17.523.60.694.2]ISC~353 25
The grindirig was ·st~rt~d ori·a 240 grit sanding di~k- and ~~s followed in order by numbers 320.11 500 and 600 grit papers 0 •
Th~ sample was ·theri polished on a sort -cloth wheel by ·using i sdspension of Li~de -A polishing-com~ound "in a ·detergent
solution. · Iri the·ca~e or alloys containirig-lesi-thari
·
ro
per cent vanadium; the grindin~-wheel ~apers w~re"soikediri 'berizene-~araffiri soltit16n and dried~ This pr66edure
prevented an excessive·amount·or cold work and smearing in the high-aluminum alloy range.
a
Table 4
Annealing Time for Various Temperatures
Quenching Temperature
1100°C 1000
900 800 800 750 710 625b 600
Furnace-cooledp not quenched.
Time at Temperature
10 hours 50
100 200 24a
275 325 500
100
bAnnealed 100 hours at 800°C.I1 slowly cooled to 6oo0
c
andquenched.
2. Etching
Several different etching procedures were employed.~> but by far the most versatile was the one which employed immersion
in mixed acids. The proportions are: 1000 cc. H20.11 25 cc. HCl (cone.), 10 cc. HN03 (cone.) and 5 cc. HF (4~). The
sample was immersed for 10 seconds at 25°C and rinsed with
water~ if necessary, this etch was repeated and the progress
26 ISC-353
...
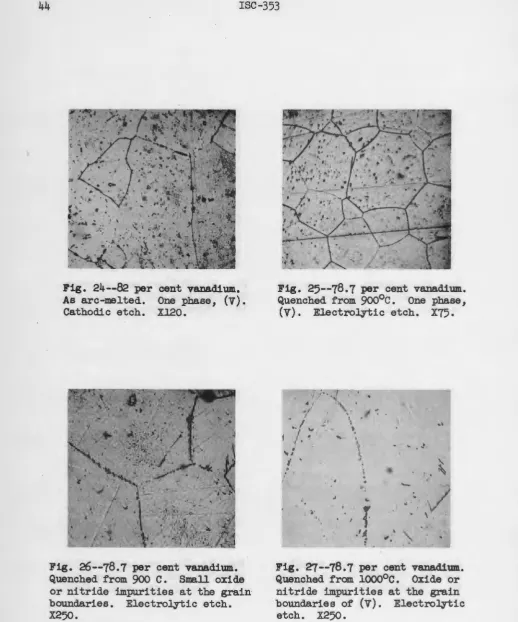
nec_~ .. ~sary ~o ·bring out the grain· boundaries of the pnase; · (V),
o~ cU~tinguish between the phases, (Al) and 0( (Al-V}. · Phase
terminology is -discussed below in the section on the micro-scopic nature of the system.
The best method for bringing out the contrast between (Al) and o<(Al-V) consisted in immersing the sample for 10 seconds in a concentrated solution of KOH at
8o
0c
and rinsing with cold water.Either an el~ctrolytic etching or cathodic etching proved satisfactory for revealing well-defined grain boundaries in the (V) or vanadium solid ~elution phase. The electrolyte · employed in the electrolyt __ ic etching was a 3N HNO':i solution containing 1 per cent by w~ight of KF; a current ~ensity or· about 0.1 amps per square em was found to give good results. The cathodic etching wae mainly done as an experiment to test the universality of th~t method and is described in detail elsewhere (23). The conditions which proved to be the most satisfactory for cathodic etching of aluminum-vanadium alloys were:
Atmosphere -- Argon at 20 microns. Electrode Spacing -- 15 inches.
Voltage. ~- 6000 volts. Current -- 13 milliamps. Time -- 15 minutes.
A Bausch and Lomb Research Metallograph was used to examine and photograph the specimens. Photomicrographs are presented below in four standard magnifications (75X, 120X, 250X and 500X). It was possible to obtain magnifications up to lOOOX but no further information was procured by doing so. Exten-sive use was made of visual examination of the samples under polarized light. Anisotropic crystals exhibit extinctions in polarized light as the metallographic stage is rotated (24), and two of the four intermediate phases in this alloy system proved to be anisotropic.
D. Preparation of Samples for X-ray Analysis
X-ray diffraction data were used to obtain three types of information: phase identification, precision lattice con-stants, and crystal structure~ Three general methods of X-ray analysis were employed with varying degrees of ~uccess to
ISC-353 27
polycrystalline solid specimens gave the most reproducible
l~ttic~ coristants; and ~heri available. sirigle crystals gave
i~formation conc~rning crystal structures.
1. Powder specimens
It was possible to crush ~lloys iri the range 15-to 70
per cent van~dium "with a diamond morta.r without ·noticeably ·.
broadening. th~ X-r~, diffraction lin~s. It is ·necess~ry iri
studies involving malleable alloys to anneal crushed powder at about 600°C to relieve the strain caused by the cold
work-ing. Since thi~ treatment was·not necessary in the case of
these aluminum~vanadium alloys, the possibility of
contamina-tion during annealing was eliminated. This method had the ·
further advantage of giving an X-ray pattern for each observed
microstructure. That is, the specimens used for microscopic
examination were broken out of their bakelite mountings and
given an X-ray analysis without further heat treatment.
The X-ray powder patterns of these alloys at room
tempera-ture were obtained on a 11.4 em diameter Debye-Scherrer
camera using filtered copper radiation. The alloy powder
was screened through a number 300 mesh and mounted in a
thin-wall, glass capillary of approximately 0.04 em diameter. The
back-reflection region of the powder pattern was usually
taken concurrently with the Debye picture ana was used to
calculate precision lattice constants. A symmetrical
self-focusing camera of 12.0 em diameter was employed, and the
calculations were refined by the analytical extrapolation
first proposed by Cohen (25).
In general, visual examination of the Debye pattern of
a two-phase alloy was sufficient to identify the phases
present and also estimate their relative amounts. Lattice
constant measurements were usually hampered however, because
of the frequent superposition of lines from different phases
and the consequent difficulty in indexing these lines.
2. Solid samples
Since alloys at the extremities of the system were too
soft and too reactive to be used as powdered samples, it was
profitable to examine their X-ray spectra in the massive
state. The Phillips X-ray spectrometer embodies essentially
the same principle as that employed in the original Bragg
experimentsj a Geiger counter measures the intensity of the
beam diffracted from the surface of a solid sample for any
given value of the Bragg angle,
e.
The bakelite mounted28
ISC-353
directly in th~ X-ray uriit ~rid a com~l~te phase id~ntification
made in the course of ·an hour: However, this .. method was
limit~d by -th~ fact th~t the relative intensities of "th~-- ·
diffe~erit ~efl~ctiori~ were inherentli -~rratic, and ·no e~timate
of the relative amounts of the different-phases could be
~ade. This ·situation ·became quite critical in the
high-vanaaiu~ portion of the system where the grain size of-the
(V) phase was large and the body-centered cubic vanadium
structure gave only a few reflections.
The effect of grain size upon the intensities of the
reflection measured by the Geiger counter was studied
exten-sively since it was desired to measure the change in ·lattice
constant with composition of the (V) phase. There are ·only
two intensity peaks in the whole back-reflection region of this body-centered cubic phase (copper radiation)» and both
of these reflections had to be sharply resolved to obtain
a precise lattice constant. A schematic drawing·of the ·
Phillips X-ray spectrometer is shown in Figure
7.
The unit is essentially the same as an asymmetrical» self-focusingcamera in that the sourcep the sample,and the Geiger counter
or film all lie on the circumference of the focusing circle.
It can be seen that a sample of finite length should be ·
curved and not planar to lie truly on the focusing circle.
In the front reflection region where 2 e is small and the
focusing circle is large, the plane surface of the sample
closely approximates a segment of the circumference of the
circle. However9 in the back-reflection region where 2
e
is large and the focusing circle is small9 only a small
area of the sample approximates the circumference of the
focusing circle; hence9 for a large grain sample only a few
grains are located in the optimum focusing position.a
A special sample holder was designed to measure the
lattice constant of the (V) phase (Figure
8).
The purposeof this instrument was to affect a translation of the sample
in a tangential direction to the focusing circle at constant
e.
This was done by means of a simple system of gears andracks so that the sample could be remotely controlled while
being exposed to the X-ray beam. The procedure was to fix
the sample at an approximate value of 2 e» translate the
sample to obtain a maximum peak intensity» and then measure
2
e
precisely. It was found that in the critical region of2
e
equal to 140° a translation of only 1 mm would make thedifference between a large intensity peak and no peak at all.
Satisfactory lattice constants were obtained for the vanadium
aThe focusing circle shown in Figure 7 is really the cross
section of a focusing cylinder whose height for this unit
ISC-353 29
"
FOCUSSING CIRCLE_...-\
I
t
DtFFRACTEDI
BEAM.,
__ !lOCAL SPOT "'-..TAKE-OFF ANGL0----"'...,..---~ ...
____ _
DIVERGENCE ANGLE----/ [image:31.564.84.516.228.520.2]30
ISC-353
Fig. 8--solid sample holder ror x-ray spectrometer.
solid solution phase by using the graphical extrapolation proposed by Nelson and Riley (26). These constants are reported in the section on the microscopic nature of the system.
3.
Single crystalsSingle crystals are, of course, invaluable in determin-ing the atomic arrangement in a phase; also, when the powder pattern of a phase is complex, single crystals are often the only means of indexing the pattern and hence, making phase identification. In this investigation, the fullest possible use was made of this phase identification function of single crystals, while crystal structure information was pursued short
of quantitati~e intensity measurements. Single crystal
specimens of oC (Al-V), ;3 (Al-V), and
'?s
(Al-V) were available. The powder photograph of an alloy containing the ~ and !-9 [image:32.566.37.548.50.682.2]I
S
C-
3
53
31
Si~~le cfy~tal dat~ have· be~n ~~th~red 'frb~·rot~tioh, o~riillation, W~is~enb~rg;-and ·p~ec~ision- pictur~i and are presented below in the section on phase structure.
E. Chemical Analysis
1. Volumetric
All of the alloys were analyzed for vanadium, and the aluminum was then determined by difference. This procedure i s not too profitable in the high-vanadium portion of the system, but measured densities when plotted against nominal compositions gave a straight line in this region. The method for volumetri c analysis was based essentially upon that work~d out by Willard and Young (27) who showed that i t was feasible to use ferroin (ferrous o-phenanthroli ne sulfate) as an
oxidation-reduction indicator for the vanadic acid-vanadyl
syst em, provided the hydrogen ion concentration is sufficiently high. The alloys could be dissolved in hot concentrated
nitric acid, and after adding sulfuric acid and fuming the solution, it was possible t o completely oxidize the vanadium to vanadic acid with an excess of sodium bismuthate. The solutions were t hen t itrat ed wi~h standard ferrous sulfate using' the above-mentioned ferroin indicator. The reported chemical composit ion of alloys containi ng more than 10 per cent vanadium may be taken to be precise to 0.5 per cent.
2. Spectrophotometric
Alloys containing less than
5
per cent vanadium were analyzed bl a spectrophotometric method; this determination of vanadium is usually based on the reddish-brown color formed by the P.~ntavalent vanadium and hydrogen peroxide in an acid solution. However, a detailed description of the method used here has been given by Telep and Boltz (28), in which a characterist ic absorption peak of the complex is measured in the ultra-violet region. Standard curves were construc~ed by the analytical section of the Ames Laboratory (29).VI. EXPERIMENTAL RESULTS
A. Macroscopic Nat ure of the System
1. Density
32 ISC-353
in Figure 9o The points have been joined by segments of .
straight-lines in a somewhat arbitrary manrier. These straight
lines may "6r may not have a real ·significance sinde they
-merely serve to emphasize the linearity of certain portions
of the curve and the deviations from average specific volumes
of the elements. The room-temperature phase bound~ries "for
the system are indicated by vertical lines and there seems
to be-some correlation between discontinuities in s16pe
or
··
the specific-volume curve and these phase boundaries. However,
it must be emphasized that these alloys are in the
as-arc-melted and not the equilibrium condition. Whenever the
malleability of the alloy permitted3 the density of the
arc-melted button was measured after it had been compressed under
50 thousand psi to about the shape of a silver dollar.
2o Hardness
The addition of aluminum to vanadium seems to have little
effect on the hardness of either the as-arc-melted or
cold-worked metal. All hardness values observed for alloys
con-taining up to 20 per cent aluminum either in the as-arc- ·
melted or cold-worked condition fell within 10 points of 60
on the Rockwell "A" scale.
On the other hand~ the addition of vanadium to aluminum
has a profound effect on the hardness of the metal (Seef Figure
10). The high-aluminum arc-melted alloys were cold-pressed u~der 50 thousand psi and reduced"up to 50 per cent. A
surprising feature of these alloys is that upon annealing in
vacuo at 600°C for 24 hoursj some of the cold-worked samples
became harder rather than softer. Perhaps this is due to
the presence of the brittle peritectic9 Al11V, whose
forma-tion was suppressed during the rapid cooling of the arc
-melting furnace.
3. ,Ageing
A 0.5 per cent vanadium alloy was cast in graphite under
an argon atmosphere and rapidly cooled in a stream of air.
The alloy was cut up for two test series of ten samples
each; the first series was placed in an oil bath at 50°C
and the second in a bath at 1oooc. Periodically3 a sample
was removed from each series and its hardness was measured
on an arbitrary Rockwell scale. After about 3 hours at
50°Cj the first series show a maximum hardness (Figure 11);
while the series at 100°C exhibited a maximum hardness after
only 40 minutes. In each case the hardness dropped upon
3.2
;¥3.1
~3.0
-;2.9 ~2.8
32.7 0
>2.6 Q2.5
IJ...
(3214
~2.
2.2
2.1
2.0 1.9 1.8
ISC-353
Al11
AJV
SATLJV\TED
SOLID SOUJ1lON
1.7
IS0
~~~~~~k-~~~~~~r-~~~~~~~-,~~d-WEIGHT PER CENT VANADIUM
Fig. 9--Specific volume of arc-melted alloys.
34
ISC-353
150~---~
• :I: •
0 ARC- MELTED
0 COLD-WORKED
l:t. PARTIALLY ANNEALED
10 20 30
WEIGHT PER CENT VANADIUM
ISC-353
35
a
9
c;
¥
~
!
~
...
..Jc
u
.,
~
c
II:
~
•
II:
c
.,
.,
w
-40~
%
..J ..J
;
¥
u
0
II:
0.25
LOG TIMI
36 ISC-353
Although these samples were not given the rapid quench
usually employed to obtain maximum age-hardening (30) "they
did respond to the subse~uent heat-treatment. There app~a~s
to be two harderiing eff~cts· obtained upon th~ heat-treatment
of aluminum-rich alloys. One is perhaps a true age-hardening
~£feet, while th~ other (occurring in the range of 600°C) is
perhaps due to the formation of a hard peritectic compound.
B. Microscopic Nature of the System
1. Introduction
Micrographs and X-ray diffraction patterns have revealed
the existence of six phase fields in the aluminum-vanadium
system. Phase designation has been made in accordance with
the procedure first proposed by Dix and Keith and later
modified by Fink and Willey (19~ p.
4).
The chemical symbolsof the elements necessary for the formation of a phase are
placed in the order of decreasing atomic percentage and
enclosed in parentheses. They are separated by hyphens in
order to distinguish them from chemical formulae. If two
or more phases would have the same designation according to
the above rules~ they are distinguished by prefixing Greek
letters. It is desirable but not always possible to
arrange the Greek letters in alphabetical order, since
additional phases may be discovered after the system has
already been described in the literature.
In order to facilitate a report of the experimental
results, an artifice will be employed whereby the phases
are first described as entities unto themselves and later
examined in the significance of neighboring phase
relation-ships.
Generally speaking, the agreement between microscopic
and X-ray analysis is excellent. However, an uncertainty
exists in assigning an exact composition to samples
con-taining between 40 and 70 per cent vanadium. Chemical
analy-sis is meaningless when the sample is not at equilibrium;
then too~ as mentioned above, explosions would often
dras-tically alter the originally intended composition of an
alloy. It was profitable to examine non-equilibrium alloys
in the as-arc-melted or partially annealed state since they
often revealed a sequence of phase formation.
Therefore each photomicrograph presented below has been
ISC-353
37
with-that listed in the last column of Table
3.
When it wasnot possible to determine the composition'trom chemical
analysis or loss in weight~ the photomicrograph has been
assigned a composition on the basis of the relative amounts
of the different phases present. The symbol (E) has· been
-placed after such estimated compositions. Of course~ such
a procedure presupposes an identification of the phases
present and the location of their phase boundaries.
2. Phase properties
(a) (Al) . Aluminum will dissolve a small amount of
vanadium in soTid solution; the solubility limi!t of
0.37
percent vanadium at
630°c
was determined by Roth (12~ p.357)
who employed electrical resistivity and lattice constant
measurements. Figures
12
and13
show the microstructuresof (Al) and (Al) with an excess of c<:(Al-V). The aluminum
matrix is usually gouged and pitted in a two phase alloy
because of its extreme softness and chemical reactivity.
This characteristic is often an aid in identifying the
con-stituents in a microstructure. very little work was done on
this phase s.ince an extremely high purity of aluminum is
necessary and as st ated abovej aluminum of only
99.9%
wasavailable. However~ it was determined by thermal analysis,
that the addition of vanadium neither raises nor lowers
the melting point of the (Al) phase, w&thin t~limits of
experimental errors (~
1°c,
.
(b) oC(Al-V). The last intermediate phase to be detected in the aluminum-vanadium system was oC (Al-V) . This phase
does not exist above
685°C
and is seld m found in a castalloy. It is difficult to distinguish this phase from (Al)
under the microscope since the two phases have similar
etching characteristics. Then too~ ~ (Al-V) and (Al) are
both optically inactive under polarized light because both
are isotropic. X-ray diffraction patterns of powder samples
show th~ crystal symmetry to be face-centered cubic (a0
=
14.586
~); this seems to indicate that the crystal may be asuper lattice0of aluminum which is also face-centered cubic
(a
0
=
4.0496
A
).
~ (Al-V) corresponds to the formula Al11v.
Tne extent of solid solubility in this phase is unknown.
~ypical microstructures of ~ (Al-V) and (Al) and with~(Al-V)
•re shown in Figur~s 14 and 15~ respectively .
(c) ~ (Al-V). Figure
16
shows the single phasemicro-structure f'ound in a
23.8
per cent vanadium alloy. This phaseis probably the one Mondolfo had ref~rence to when he reported
AliV (14~ p.
48).
~ (Al-V) is usually porous since it canon y be formed by a diffusion mechanism and not by a casting
38 ISC-353
Fig. l2--o.4 per cent vanadium.
Quenched from 625°C. Aluminum
solid solution phase, (Al).
Etched with KOH. X250.
Fig. 14--6.3 per cent vanadium.
Quenched from 625°C. Islands of
a in (Al). Etched with KOH.
X250.
Fig. 1:3--1.6 per cent vanadium.
Quenched from 625°C. (Al) plus
small crystals of a . Etched