City, University of London Institutional Repository
Citation
:
Henry, L., Messer, D. J. and Nash, G. (2015). Executive functioning and verbal fluency in children with language difficulties. Learning and Instruction, 39, pp. 137-147. doi: 10.1016/j.learninstruc.2015.06.001This is the accepted version of the paper.
This version of the publication may differ from the final published
version.
Permanent repository link:
http://openaccess.city.ac.uk/12056/Link to published version
:
http://dx.doi.org/10.1016/j.learninstruc.2015.06.001Copyright and reuse:
City Research Online aims to make research
outputs of City, University of London available to a wider audience.
Copyright and Moral Rights remain with the author(s) and/or copyright
holders. URLs from City Research Online may be freely distributed and
linked to.
Learning and Instruction doi: 10.1016/j.learninstruc.2015.06.001
Executive functioning and verbal fluency in children with language difficulties
Lucy A. Henry1, David J. Messer2 and Gilly Nash1
1
City University London
Language and Communication Science
Northampton Square
City University London
London, EC1V 0HB, UK
2
Open University
Briggs Building
Open University
Milton Keynes, MK76AA, UK
Corresponding Author: Lucy Henry [email protected]
Abstract
This study provided a detailed analysis of verbal fluency in children with language difficulties, and
examined the relative contributions of executive functioning (executive-loaded working memory,
switching, inhibition) and language ability to verbal fluency performance. Semantic and phonemic
fluency, language, and executive functioning tasks were completed by 41 children with specific language
impairment (SLI) and 88 children with typical development. Children with SLI showed difficulties with
most aspects of verbal fluency (rates of output, errors, switching) relative to typical children. Language
ability predicted nearly every aspect of phonemic fluency performance and some aspects of semantic
fluency performance. The relationships between verbal fluency and executive functioning were modest:
inhibition was related to error scores on the phonemic fluency task, but relationships with
executive-loaded working memory and switching were absent. Educationally, these results emphasise the
underlying importance of language abilities in generation tasks like verbal fluency, but point to the
importance of inhibition skills for error monitoring. Interventions to improve search and generation
abilities have the potential to offer broader benefits in the classroom for children with language
difficulties.
1. Introduction
1.1 Executive functioning and children with language difficulties
Executive functioning (EF) describes a constellation of related abilities involved in high-level,
goal-directed behaviour/self-regulation (Miyake & Friedman, 2012) to enable negotiation of complex
and changing circumstances in the absence of automatic or fixed ways of responding (Diamond, 2013).
The most influential model of EF in adults (Miyake et al., 2000) identifies three components:
executive-loaded working memory (ELWM: the ability to process and store information concurrently); switching
(the ability to rapidly and flexibly change cognitive set); and inhibition (the ability to suppress readily
available responses/stimuli). Identifying these areas of EF in children has been broadly successful,
although some studies report two factors (Fisk & Sharp, 2004; Huizinga, Dolan, & van der Molen, 2006;
Lehto, Juujärvi, Kooistra, & Pulkkinen, 2003; St Clair-Thompson & Gathercole, 2006; van der Ven,
Kroesbergen, Boom, & Leseman, 2013), and recent conceptualisations have suggested inhibition might
be part of a ‘common’ EF factor (Miyake & Friedman, 2012).
Children with developmental disorders show EF difficulties (e.g., ADHD, ASD: Corbett,
Constantine, Hendren, Rocke, & Ozonoff, 2009; Geurts, Verte, Oosterlaan, Roeyers, & Sergeant, 2004),
and the current study focused on children with specific language impairment (SLI). Although SLI is a
controversial label (Bishop, 2014; Reilly, Tomblin, et al., 2014), researchers and clinicians agree that a
heterogeneous group of children with significant language difficulties compared to their peers can be
recognised (Reilly, Bishop, & Tomblin, 2014). The current study defined SLI as a developmental disorder
involving delayed receptive and/or expressive language (phonology, vocabulary, grammar) in the
absence of any obvious cause (Bishop & Norbury, 2008). Although exclusionary definitions can be
controversial (Reilly, Tomblin, et al., 2014), it is thought that SLI affects 3-6% of schoolchildren (Hulme &
language difficulty has identified verbal sequential memory, speech production, lexical-semantic abilities
and auditory conceptualisation factors (Van Weerdenburg, Verhoeven, & Van Balkom, 2006), but
pinpointing stable subgroups over development is challenging (Conti-Ramsden & Botting, 1999; Reilly,
Bishop, et al., 2014) and was, therefore, not attempted in the current study. We identified children
diagnosed as having SLI and additionally checked that they also obtained poor scores on a standardised
language test. The resulting sample is likely to have been heterogeneous in terms of language
difficulties, comprising individuals with a range of expressive and receptive impairments. Although
definitions of SLI no longer use ‘cognitive referencing’ (Bishop, 2014), we nevertheless ensured that the
current sample of children with SLI had non-verbal IQ scores in the average range or above, so we could
assess difficulties in verbal fluency without a potential confound of low IQ. A comparison sample
included typical children with a similar range of chronological ages, but we included some younger
typical children to reflect the lower ‘language age range’ of the SLI group. All comparison children were
assessed to have no current language difficulties.
Children with SLI have difficulties with EF. Inhibition is impaired (Bishop & Norbury, 2005;
Henry, Messer, & Nash, 2012; Im-Bolter, Johnson, & Pascual-Leone, 2006; Weyandt & Willis, 1994), and
ELWM is also impaired in many children with SLI (see Montgomery, Magimairaj, & Finney, 2010 for a
review; see also: Archibald & Gathercole, 2007; Ellis Weismer, Evans, & Hesketh, 1999; Henry et al.,
2012; Im-Bolter et al., 2006; Marton, 2008; Marton & Schwartz, 2003; Montgomery, 2002). Current
developmental conceptualisations of ELWM suggest increases in short-term memory (STM) and
processing speed are implicated for typical children (Bayliss, Jarrold, Baddeley, & Leigh, 2005), and both
STM and processing speed (general or specific to linguistic tasks) are indeed weak in children with SLI:
(STM: Bishop, North, & Donlan, 1996; Dollaghan & Campbell, 1998; Edwards & Lahey, 1998; Gathercole
& Baddeley, 1990; Hick, Botting, & Conti-Ramsden, 2005; processing speed: Leonard et al., 2007).
impaired in children with SLI. The only major unimpaired EF area in children with SLI is switching
(Dibbets, Bakker, & Jolles, 2006; Henry et al., 2012; Im-Bolter et al., 2006; Kiernan, Snow, Swisher, &
Vance, 1997; Weyandt & Willis, 1994, but see Marton, 2008). The current study examined all three areas
of EF to assess their relationships to verbal fluency in a mixed sample of children with and without SLI.
1.2 Verbal fluency and executive functioning
Verbal fluency tasks assess “strategic search and retrieval processes from the lexicon and
semantic memory” (Sauzéon, Lestage, Raboutet, N’Kaoua, & Claverie, 2004). They require generation of
as many words as possible within one minute according to simple rules that target sounds (phonemic
fluency, items starting with particular letters such as “f”, “a”, “s”) or semantic categories (semantic
fluency, “animals” or “foods”) (Troyer, 2000; Troyer, Moscovitch, & Winocur, 1997). These two tasks
measure related processes in adults (Unsworth, Spillers, & Brewer, 2011) and are correlated in children
(Matute, Rosselli, Ardila, & Morales, 2004; Riva, Nichelli, & Devoti, 2000). Successively generated items
are often related to each other along task-relevant dimensions: e.g., phonemic fluency relationships via
spelling- sound knowledge; or semantic fluency relationships via associative links in long-term/semantic
memory (Seidenberg, 2005). Hence, verbal fluency tasks are an important window into children’s’
lexical/semantic/phonemic networks and strategic search and retrieval processes (Sauzéon et al., 2004).
As might be expected, verbal fluency abilities improve with age in typical children (Hurks et al., 2010;
Kavé, 2006; Kavé, Kigel, & Kochva, 2008; Klenberg, Korkman, & Lahti-Nuuttila, 2001; Korkman, Kemp, &
Kirk, 2001; Matute et al., 2004; Riva et al., 2000; Sauzéon et al., 2004).
Verbal fluency is often described as a measure of EF (Pennington & Ozonoff, 1996), and has
been related to executive dysfunction after neurological damage (Henry & Crawford, 2004) because it
requires goal-directed behaviours such as flexibility of thought, strategic planning, non-habitual
cognitive flexibility. Contrastingly, verbal fluency has been regarded as a language measure and related
to lexical access (semantic and phonological retrieval processes), language proficiency, vocabulary size
(Luo, Luk, & Bialystok, 2010), and vocabulary knowledge (Prigatano & Gray, 2008; Ruff, Light, Parker, &
Levin, 1997). Importantly, children with SLI (Weckerly, Wulfeck, & Reilly, 2001) and those with other
language difficulties (dyslexia: Cohen, Morgan, Vaughn, Riccio, & Hall, 1999; deaf signers with SLI:
Marshall, Rowley, Mason, Herman, & Morgan, 2013; word finding difficulties: Messer & Dockrell, 2013;
Down Syndrome: Nash & Snowling, 2008) show difficulties with verbal fluency.
The current study had two aims. (1) To explore whether verbal fluency performance limitations
in children with SLI can shed light on underlying difficulties. (2) To test current theoretical
conceptualisations of the relative roles for EF and language ability in predicting verbal fluency
performance. These two issues are reviewed below.
1.3 Aim 1: What does verbal fluency reveal about children with language difficulties?
Verbal fluency is a multifactorial task requiring a range of performance factors (Troyer et al.,
1997). Generating items according to a rule taps the ability to search and retrieve relevant information
from lexical/semantic memory (Kavé et al., 2008), particularly, the ability to retrieve phonological and
semantic information (Marshall, 2014). It reflects monitoring of output for errors/rule violations
(Unsworth et al., 2011), and provides information about the organisation of and access to
semantic/phonemic networks (Nash & Snowling, 2008; Weckerley et al., 2001). These are highly
relevant and generalizable skills/abilities in the classroom, involved in learning activities whereby
organised, stored information on a range of topics (e.g., chemistry, history, physics, languages etc.) is
accessed and retrieved according to relevant dimensions and monitored for accuracy/relevance.
These processes were investigated in detail. Total number of items generated in phonemic and
semantic/phonemic networks (‘total output’). Correct items (‘valid output’) within task rules may be
more relevant to classroom learning, demanding refined searches, careful response selection and
ongoing monitoring for accuracy. Further, to gain insight into accuracy monitoring, errors were
assessed. Previous work (Weckerly et al., 2001) reported that children with SLI produced fewer
responses, but showed no differences in numbers of overall errors, suggesting difficulties with search,
retrieval and generation of items, not with monitoring failures. However, Weckerley et al.’s (2001)
measure of total errors did not account for overall level of performance, so a proportion of errors
measure was calculated here.
Verbal fluency tasks are powerful methods of assessing switching between clusters of related
items (Troyer et al., 1997). Although EF switching abilities appear preserved in children with SLI (see
earlier), in such tasks, categories are detectedfrom visual cues (e.g., Wisconsin Card Sorting Task).
Verbal fluency switching requires self-generation of new sub-categories with no cues. Children with SLI
may be less able than typical children to self-generate relevant categories and to switch between
‘exhausted’ sub-categories of target items. This could reflect less extensive or well-organised
semantic/phonemic networks, limited semantic/phonemic/lexical knowledge (having fewer subordinate
categories available) (Nash & Snowling, 2008), and/or reduced efficiency in accessing stored knowledge
(Marshall, 2014).
Relationships between adjacent items generated are often examined for ‘clustering’ (semantic
relations, “dog, cat, hamster”; or phonemic relations, “fast, fat, far”) (Troyer et al., 1997), giving insight
into the extent, organisation, and accessibility of lexical/semantic and phonemic networks (Nash &
Snowling, 2008; Troyer, 2000; Troyer et al., 1997). Smaller clusters of related items in children with SLI
than typical children would suggest reduced ability to perform exhaustive searches, and/or smaller
organising new information efficiently in semantic memory to achieve successful and rapid access.
Evidence for reduced cluster sizes in children with SLI could support the use of interventions to
elaborate and enhance semantic representations (for a review see Cirrin & Gillam, 2008) and to impose
clear structures when learning new information (e.g., mind maps). Although cluster size did not differ
between children with SLI and typical comparisons in the Weckerly et al. (2001) study, further data will
allow stronger conclusions about this important issue.
Automatic and controlled processing was assessed using response rates, as these typically
decline over the one-minute output period. It has been suggested that the first 15 seconds of word
generation reflect automatic processes for accessing common/prototypical/easily accessible items.
Once readily accessible items have been exhausted (subsequent 45 seconds), effortful ‘controlled’
search processes are required, placing heavier loads on EF (Hurks et al., 2006). Children with SLI may
resemble typical children during the first 15 seconds of output (automatic processing), whereas the
controlled processing phase may reveal group differences. Alternatively, children with SLI may show
weaker performance throughout the output period due to slower processing speeds (Leonard et al.,
2007) or poorly executed search processes. Absolute and relative changes in performance during the
response output period will provide new and important data with educational implications. If automatic
processing is preserved in children with SLI, this would suggest that consolidating the learning of key
basic concepts to achieve ‘automaticity’ might be beneficial.
Therefore, children with SLI were assessed for difficulties with searching semantic/lexical
memory and generating responses, monitoring output for accuracy, switching between and exhaustively
searching clusters of related items, linking related items together, and controlled versus automatic
generation processes. The general prediction (Hypothesis 1) was that children with SLI would show
to include children with difficulties with phonology, grammar and/or vocabulary, which may
differentially affect phonemic and semantic fluency, but as the sample was not stratified, predictions
were formulated at the level of ‘group performance’.
1.4 Aim 2: Is verbal fluency performance related to executive functioning and/or language ability?
According to neuropsychological evidence reviewed by Troyer et al. (1997) (lesion studies, fMRI,
PET), executive control processes are crucial in verbal fluency tasks: ELWM to monitor output for
relevance and retain the ‘rules’ of the task; and inhibition to control the repetition of responses
(Unsworth et al., 2011). Switching, or cognitive flexibility, may be required to switch between clusters of
related items (Hurks et al., 2010; Troyer et al., 1997). EF is likely to be more relevant for phonemic than
semantic fluency tasks (Riva et al., 2000; Sauzéon et al., 2004; Troyer et al., 1997). This is because
phonemic fluency is harder than semantic fluency (e.g., Hurks et al., 2006; Troyer, 2000), requiring
effortful searching through larger numbers of subcategories (Hurks et al., 2006) that rely on unusual and
demanding orthographic criteria, rather than the organisational structure of everyday life (Henry &
Crawford, 2004).
A further predictor of verbal fluency was suggested by Luo et al. (2010), namely ‘language
ability’ (assessed with a vocabulary measure). Luo et al.’s work was premised on findings that
bilingualism from an early age conveys advantages on EF (via extended practice with switching and
resolving conflicts between languages), yet disadvantages on highly constrained verbal tasks such as
vocabulary (Bialystok, 2010, 2011). By dissociating these factors in bilinguals, Luo et al. showed that
both were important for verbal fluency performance, specifically in relation to phonemic fluency, and
made the following points: (1) EF is a more important predictive factor for phonemic than semantic
fluency (more difficult search processes are required); (2) language ability is a more important predictive
is increasingly required as the trial progresses (once easily accessed items have been exhausted and
demands on strategic search processes increase); and (4) language ability is relevant throughout a
response trial.
Following this theoretical conceptualisation, we derived further predictions. Hypothesis 2 was
that EF should be a stronger predictor of phonemic than semantic fluency, whereas language ability
should be a stronger predictor of semantic than phonemic fluency. Hypothesis 3 was that EF should
show stronger relationships with performance in the later stages of each response trial, whereas
language ability should remain a predictor of performance throughout the response trial. Language
ability was assessed using raw scores from two verbal tasks in a standardised test battery. EF was
assessed using verbal measures of ELWM, inhibition and switching, in line with current models (Miyake
et al., 2000). The sample included children with large ranges of abilities in both language and EF, so
relationships between the variables should be more likely than in a homogeneous sample.
2. Method
2.1 Participants
Children with SLI (8yrs1m to 14yrs1m) were recruited from mainstream schools and specialised
language units in Greater London, via letters to Headteachers and/or Special Needs Co-ordinators asking
them to identify children with language difficulties. In approximately half of the schools that took part,
children without language difficulties (6yrs0m to 14yrs8m) were recruited from the same classes to
ensure that the groups were broadly similar in terms of socio-economic background. We also recruited
some younger typical children from schools in similar areas to reflect the full range of approximate
language ages of those in the SLI group. The 129 participants came from 22 schools and specialist
language units/classes and, very occasionally, via direct contact with parents/guardians. The final
(n=41, mean (SD) age 138.4 (15.9) months). Age differed significantly between groups, t(122.12)=5.31,
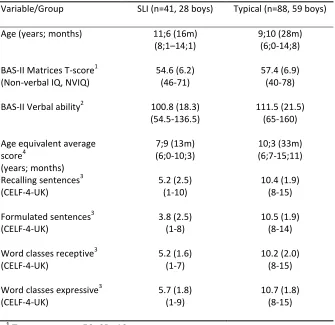
p<.001, so was controlled statistically in all analyses. Key background variables are presented in Table 1.
A further 32 potential participants were excluded because they did not fit the study criteria outlined
below (language difficulties in the milder range; non-verbal IQ in the borderline or intellectual disability
range).
All participants in the SLI and typical groups spoke English as their first language and had
non-verbal IQs in the average range [T-scores >40 on BAS-II Matrices (British Ability Scales-II, Elliott, Smith, &
McCullouch, 1997), standardised to give mean T-score=50, SD=10]. There is disagreement concerning IQ
cut-offs and SLI, but many researchers specify ‘average’ levels of non-verbal IQ (Bishop, 2014): this
criterion was adopted in the current study to examine the role of language difficulties (in the absence of
low IQ) on verbal fluency. BAS-II Matrices scores differed between groups [mean (SD) T-scores: SLI=54.6
(6.2); TD=57.4 (6.9)], t(127)=2.21, p<.05, so were statistically controlled in all analyses.
Children in the SLI group had formal diagnoses from appropriate health professionals according
to standard clinical criteria and no diagnoses of hearing impairments, intellectual disability, or other
developmental disorders (e.g., ADHD, ASD). Inclusion in the SLI group was dependent on additional
screening we carried out: participants had at least three/four scaled scores at or below 1SD (≤7 where
scaled score mean=10; SD=3) on subscales from the CELF-4-UK (Clinical Evaluation of Language
Fundamentals-4-UK, Semel, Wiig, & Secord, 2006). This standardised measure is used in the UK by
Speech and Language Therapists to assess and identify children with language difficulties; usual clinical
cut-offs are around one standard deviation below the normative sample mean. We administered
Recalling Sentences (reliability .90), Formulated Sentences (reliability .86), Word Classes-Receptive
(reliability .86) and Word Classes-Expressive (reliability .83) to obtain a broad view of
measures and include the most sensitive CELF-4 subtests, as evidenced by intercorrelational, clinical
validation and diagnostic studies, showing the test to be sensitive to variability in language difficulties.
All participants in the typical group had scaled scores of 8 or higher on the four CELF-4-UK subscales.
The known gender imbalance in those with SLI favouring boys (Leonard, 1998) was reflected in
the typical sample, which was larger than the SLI group to ensure it spanned the range of
language/chronological ages of the children with SLI (see Table 1). This study did not utilise a group
matching procedure, opting instead for the use of multiple regression analyses to control for key
variables usually matched between groups (age, non-verbal IQ). This maintained the representativeness
of the sample by avoiding exclusion of unmatched participants.
Table 1 about here
2.2 Study Variables
2.2.1 Verbal Fluency: This was assessed using relevant tasks from the Delis-Kaplan Executive Functioning
System (Delis, Kaplan, & Kramer, 2001, D-KEFS). Children generated as many words as possible in one
minute according to a set of rules. The words had to start with a particular letter (phonemic fluency:
letters F, A, S); or belong to a particular semantic category (semantic fluency: ‘animals’, ‘boys’ names’).
Repeated items and items outside the set were counted as errors. The following measures were
calculated: total number of words generated inclusive of errors; total number of valid words (exclusive
of errors); total number of errors; proportion of errors in relation to total number of words generated;
Two further measures were calculated, based on the relatedness between successive items
generated in the phonemic and semantic fluency tasks, according to criteria set out by Troyer et al.
(1997). For phonemic fluency, successively generated words beginning with the same first two letters
were classified as belonging to the same cluster. In one or two rare cases, successive words with the
same first two sounds were accepted if spelling patterns were not identical (skid, scam; sky, school).
Words that rhymed (sip, slip) or that were identified by the child as homophones (sea, see; sum, some)
were included in the same cluster, as were items that differed in a single vowel sound (sin, son, sun;
feet, foot, fat). For calculating item relatedness in the semantic fluency tasks, we excluded the semantic
category of ‘boys’ names’ because it was impossible to assess semantic relatedness for individual
children. Therefore, these measures reflect the category of animals. Groups of related animals were
based mainly on Troyer et al., but we included some further groups of related animals generated by
children in the sample. Sub-categories included sea creatures, pets (including sub-categories of dogs),
farm animals, African mammals, insects, small reptiles, big cats, Australian animals, British mammals,
American mammals, birds, primates, snakes, large reptiles. Single words and groups of words counted as
separate clusters. In many previous studies, mean size of cluster has been counted only from the
second word within a cluster (Mayr, 2002), but this approach was considered potentially misleading
because many children had more single word ‘clusters’ than multi-word clusters. For each child, the
following scores were calculated: mean number of switches between clusters (single words and groups)
and mean number of words per cluster. Reliability of scoring was assessed for 15% of the sample rated
by a second coder. The agreement between coders was r = .998 for letter fluency and r = .960 for
animal fluency.
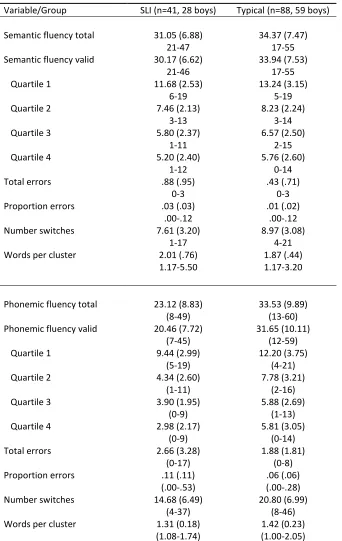
Summary descriptive data on all of the fluency variables for each group are given in Table 2:
note that these scores are not directly comparable because the groups were not matched for age and IQ
The five measures of verbal fluency (valid responses) were all significantly related to each other,
with correlations of .49-.78 (mean r=.60).
2.2.2 Language ability: This was assessed using raw ability scores from the BAS-II Word Definitions
(expressive vocabulary, reliability .89) and Verbal Similarities (identifying similarities across sets of three
words, “How are spoon, fork and knife alike?”, reliability .91). These subtests provided a
well-established and highly relevant measure of language ability, tapping vocabulary knowledge, general
semantic knowledge and expressive language (Elliott et al., 1997). Averaged raw ability scores were
used rather than standardised scores to preserve maximum variability across age and ability (see Table
1). The SLI and TD groups differed significantly, as expected, on language ability [mean (SD) raw scores:
SLI=100.8 (18.3); TD=111.5 (21.5)], t(127)=2.75, p<.01.
2.2.3 Executive-loaded working memory, inhibition, switching:
Executive-loaded working memory (ELWM). The task was Listening Recall (Working Memory Test
Battery for Children, WMTB-C, Pickering & Gathercole, 2001). The Experimenter read a series of short
sentences and the child judged whether each was true/false (processing), then recalled the final word
from each sentence in correct serial order (storage). Trials commenced with list lengths of one item,
and proceeded to longer lists, with six trials per list length, until fewer than 4/6 trials were correct. Total
trials correct were scored, as this is more reliable than ‘span’ (Ferguson, Bowey, & Tilley, 2002).
Test-retest reliabilities of .38-.83 are reported for relevant ages (Pickering & Gathercole, 2001)
Inhibition. Verbal Inhibition, one of the sub-tests from the VIMI task (Henry et al., 2012), was employed.
The Experimenter said either ‘doll’ or ‘car’ and the participant copied by repeating the same word (block
1). In block 2, the child inhibited this copying response: ‘if I say doll, you say car; and if I say car, you say
doll’. A second ‘copy’ and ‘inhibit’ block followed and each of the four blocks consisted of 20 trials. The
Combined errors across Parts A and B were used as the measure of inhibition. Cronbach’s alpha, based
on total error scores from Parts A and B was .727.
Switching. The Trail Making Test (D-KEFS) assessed switching.
C
hildren joined small circles containing letters and numbers alternately, in sequence (1-A-2-B-3-C through 16-P). Four control conditionsassessed component skills. Most relevant were: Number Sequencing (connecting the numbers 1-16);
and Letter Sequencing, (connecting the letters A-P). “Switching cost” was the time per item taken for
combined letter/number switching, minus the sum of the time taken per item for the number and letter
sequencing component skills. Test-retest reliabilities for measures contributing to “switching cost” are
reported as: number sequencing (.77), letter sequencing (.57); letter/number switching (.20, Delis et al.,
2001). Reliability for switching measures can be low, given they are difference scores; consequently,
somewhat lower reliabilities may be inevitable (Miyake et al., 2000).
The project was granted ethical approval from the Research Ethics Committee, London South
Bank University, and was discussed in detail with appropriate school staff before recruitment. Informed
consent for participation was obtained in writing (telephone permission occasionally) from
parents/guardians; children/students also gave their written consent and were told they could opt out
at any time. The full testing protocol took place across 3-8 sessions, making up 3½ hours for the
complete battery, usually at school but occasionally at the child’s home. Test order was somewhat
flexible to accommodate school timetables, but generally followed this protocol: BAS-II; CELF-4-UK;
ELWM; verbal fluency; switching; inhibition. A number of other executive functioning tasks not reported
here were also included (see Henry et al., 2012).
3. Results
For all regressions reported, key statistical checks (Durbin-Watson, tolerance/VIF statistics,
Cook’s/Mahalanobis distances, standardised DFbetas, leverage values, plots of standardised
residuals/predicted standardised values, standardised residuals, partial plots) were carried out. Error
variables were transformed using square root (total errors, inhibition errors) or arcsine (proportion
errors) transformations, as these data were not normally distributed and initial checks indicated that
individual cases may have had undue influence (Field, 2013). Alpha was set at p<.005 after Bonferroni
corrections, based on 10 regressions per set of analyses, but tables include significance values at p<.05
for information.
3.1 Aim 1: What does verbal fluency performance reveal about children with language difficulties?
Group differences on all measures of verbal fluency were assessed to evaluate Hypothesis 1 (children
with SLI would show difficulties with many if not all aspects of verbal fluency). Instead of attempting to
match children in each group for age and non-verbal IQ, an alternative approach was taken to keep
samples as representative as possible and avoid excluding unmatched children. Differences between the
groups (SLI, typical development) in age and non-verbal IQ were controlled statistically using hierarchical
multiple regression. For each verbal fluency variable, the regression controlled for age and non-verbal
IQ at step one and introduced a dummy-coded group variable to assess group differences at step two.
An alternative is to use analysis of covariance to control for age and non-verbal IQ, but this involves
statistical assumptions not always merited by the data. Regression techniques are more robust.
Separate hierarchical regression analyses on the following dependent variables were carried
out: response output (total, valid), output over time (patterns of performance over quartiles within the
one-minute response period), errors (total errors, proportion errors), switching (number of switches
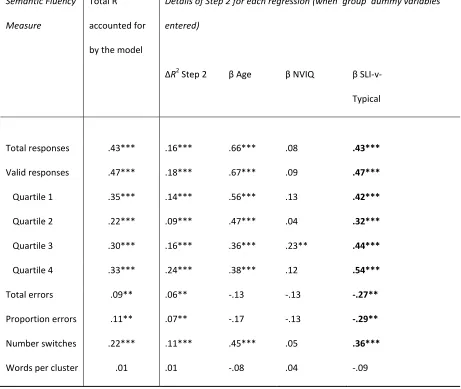
Tables 3 and 4 present key summary data. Each dependent variable is listed in Column 1.
Column 2 shows total variance accounted for by the final model for each variable (and significance of
overall model), and Column 3 gives the change in variance at step two (change in R2), reflecting whether
introducing the dummy-coded group variable accounted for further significant variance in the model
(reflecting a group difference in performance). Columns 4 to 6 provide the standardised beta-values at
step two of each regression model for the three predictor variables.
For semantic fluency (Table 3), the change in R2 values at step two indicated significant group
differences for the following measures: total responses, valid responses, performance in quartiles 1, 2,
3, and 4, total errors, proportion errors, and number of switches. Group accounted for 6-24% of the
variance in performance on the fluency measures. Inspection of beta-values for the SLI-vs-typical
comparison indicated that children with SLI produced significantly fewer responses (total, valid) than
typical children, and showed reduced numbers of accurate responses in all four quartiles of the task.
Children with SLI made more errors (total errors, proportion errors) and fewer switches within semantic
categories. The only area in which children with SLI did not differ from typical children was words per
cluster (this was also a non-significant regression model).
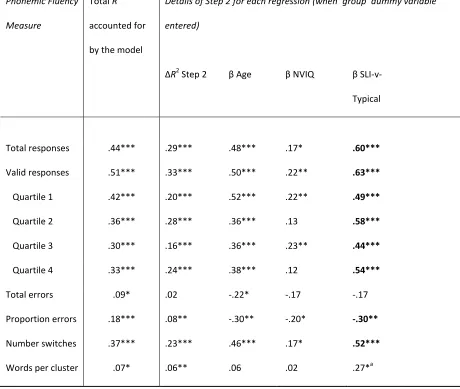
Table 4 shows the regressions for phonemic fluency. The change in R2 values at step two
indicated significant group differences for the following measures: total responses, valid responses,
performance in quartiles 1, 2, 3, and 4, proportion errors, and number of switches. Group differences
on words per cluster were marginally significant (p=.006). Group accounted for 6-33% of the variance in
performance on the fluency measures. Inspection of beta-values for the SLI-vs-typical comparison
indicated that children with SLI produced significantly fewer responses (total, valid) than typical
children, and fewer responses across all quartiles of the task. Children with SLI produced a higher
words per cluster. There was one area in which children with SLI did not differ from typical children:
they did not show an elevated absolute number of errors (see also Weckerly et al., 2001).
Aim 1 summary: for both semantic and phonemic fluency, children with SLI showed lower rates
of overall response output (total, valid), lower performance on all four quartiles of the task, higher
proportions of errors, and fewer switches compared to typical children. As children with SLI
demonstrated wide ranging difficulties with verbal fluency tasks, the findings supported Hypothesis 1.
Tables 3 and 4 about here
3.2 Aim 2: Is verbal fluency performance related to executive functioning and/or language ability?
Hypothesis 2 (EF should be a stronger predictor of phonemic than semantic fluency; language ability
should be a stronger predictor of semantic than phonemic fluency) and Hypothesis 3 (EF should show
stronger relationships with performance in the later stages of each response trial; language ability
should remain a predictor of performance throughout the response trial) were assessed by examining
whether language and EF (ELWM, inhibition, switching) were related to verbal fluency performance.
These analyses did not include group as a variable because this research question was more general and
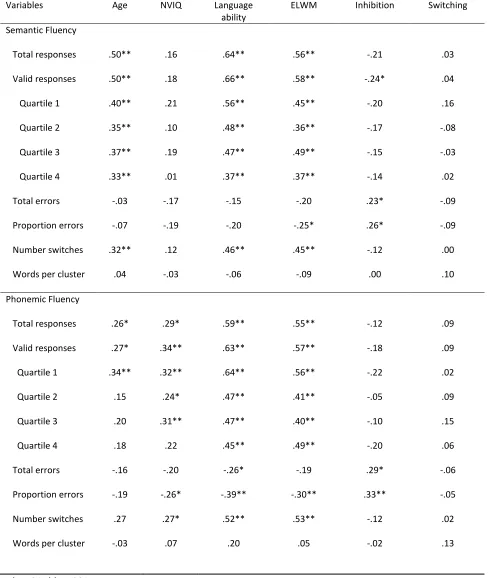
did not address group differences. Table 5 shows simple correlations between verbal fluency measures,
age, non-verbal IQ, language ability, ELWM, inhibition and switching. Language ability and ELWM were
significantly related to nearly all measures of verbal fluency (rs -.25 to .66), but there were few
significant relationships between verbal fluency and inhibition (mainly with error scores, rs .23 to .33).
There were no significant relationships between any aspect of verbal fluency and switching. Age
phonemic fluency measures (rs .26 to .34). Non-verbal IQ was unrelated to semantic fluency, but
showed moderate relationships to many phonemic fluency variables (rs -.26 to .34).
Table 5 about here
Hypotheses 2 and 3 made specific predictions about which variables (language ability, ELWM,
inhibition, switching) would account for significant amounts of variance in the verbal fluency measures.
These hypotheses were assessed with further regression analyses in which age and IQ (control variables)
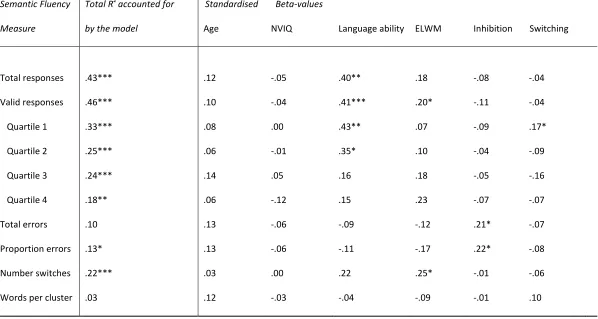
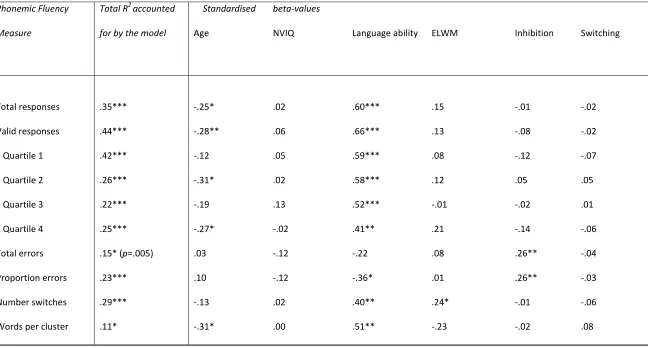
were entered simultaneously with the four predictor variables. Tables 6 and 7 summarise key
information from each regression predicting the following fluency measures: response output (total,
valid), output overtime (performance in quartiles 1, 2, 3, 4), errors (total errors, proportion errors),
switching, and cluster sizes. Checks indicated that Mahalanobis distances were over 15 for 5
participants (1 SLI, 4 TD), therefore, these cases were omitted from regressions to avoid them having
undue influence (Field, 2013).
Aim 2 findings: Language ability was a significant predictor of nearly all aspects of phonemic
fluency performance (total and valid response output, performance in each quartile, switching, cluster
size, words per cluster), and some aspects of semantic fluency (total and valid response output,
performance in quartile 1). Inhibition was a significant predictor of error scores (total, proportion) in the
phonemic fluency task, but these relationships were reduced to trends for the semantic fluency task
(ps<.05). ELWM and switching were not significant predictors of verbal fluency performance (although a
The overall percentage variance accounted for by each significant regression model ranged from
18-46%. No model accounted for more than half of the variance, implying that unmeasured variables
and measurement error were also relevant.
Tables 6 and 7 about here
4. Discussion
4.1 Aim 1: What does verbal fluency performance reveal about children with language difficulties?
Verbal fluency tasks allow the investigation of children’s’ strategic search and generate processes, error
monitoring, lexical/semantic/phonemic networks (Sauzéon et al., 2004), and controlled versus
automatic processing. Although children with SLI are a heterogeneous group (Van Weerdenburg et al.,
2006), and the current sample is likely to have had a range of receptive and/or expressive language
difficulties, they nevertheless showed widespread difficulties on verbal fluency measures. Children with
SLI were less able than typically developing peers to search semantic/phonemic networks and
retrieve/generate items according to a rule. They showed weaknesses in automatic and controlled
processing (early and later stages of response output), suggesting performance limitations for easily
accessible items and items requiring effortful search strategies (Hurks et al., 2006). Children with SLI
also made higher proportions of errors, suggesting they were less able to monitor their responses for
accuracy and rule violations, and suppress incorrect responses. Further, they made fewer switches
between sub-categories, which could imply less extensive or well-organised semantic/phonemic
networks compared to typical children, or reduced efficiency of access to these networks. These
Given the lack of robust evidence concerning effective interventions for children with language
difficulties (e.g., Cirrin & Gillam, 2008; Law, Garrett, & Nye, 2004), the educational implications of these
findings for interventions with children with SLI are speculative. Nevertheless, verbal fluency tasks tap
highly relevant and generalizable classroom skills/abilities, as everyday learning activities require search,
access, and retrieval of organised stored information according to relevant dimensions. Self-generation
of comprehensive and accurate information is essential for many learning assessments: producing
‘evidence’ to support arguments in history or literature; answering fact-based scientific questions in
biology, chemistry, or physics; using specific formulae/rules for carrying out mathematics operations;
knowing spelling/grammar rules for language learning. The widespread difficulties of children with SLI
compared to typical children with searching for and generating items from semantic/phonemic memory
networks, and monitoring output for errors, could compromise everyday learning activities because
access to stored knowledge is inefficient and error-prone. Interestingly, interventions that improve
vocabulary and semantic processing/elaboration appear to have some effectiveness for school-age
children (Cirrin & Gillam, 2008). However, because children with SLI showed weaker performance at all
phases of the fluency tasks, including the more automatically generated first 15 seconds of the task
during which it is assumed easily accessible items are generated (Hurks et al., 2006), it might be
necessary to expand the range, depth and accuracy of semantic/phonemic knowledge/networks and
consolidate new learning thoroughly so that it is ‘automatically’ available.
Difficulties with search, access and retrieval of information could be due to poor organisation,
limited networks, or inaccurate semantic and phonemic knowledge, making search processes inefficient
and error-prone. Children in the SLI group showed fewer switches between clusters of related items
than typical children, implying reduced ability to perform exhaustive searches within a subcategory,
and/or difficulties with the self-generation of new subcategories relevant to super-ordinate search
networks (Nash & Snowling, 2008; Troyer et al., 1997). An alternative explanation is that children with
SLI have adequate semantic/phonemic networks, but difficulties in accessing and generating relevant
information quickly and efficiently due to processing speed limitations (e.g., Leonard et al., 2007).
Cluster sizes on the phonemic fluency task were marginally smaller for children with SLI (p<.006), so
even after identifying a subcategory of phonemically related items, search processes may be less
productive. The relevant phonemic networks could have been reduced in size, phonemic information
may have been inaccurate (there is evidence that phonological representations can be impaired for
children with SLI, Marshall, 2014), or the neural associations between items within a category could
have been weaker - our results cannot distinguish between these possibilities. However, this was a
marginal result, and the sizes of stored subcategories relating to animal names did not differ between
children with and without language impairments, so not all aspects of organised semantic knowledge
were problematic (see also Marshall, 2014).
Children with SLI could be supported by imposing a clear structure on new information when
learning, and promoting strong organisation and extensive/elaborate semantic/phonemic networks.
Improving semantic/phonemic network organisation and accessibility may produce educational benefits
in terms of more efficient storage, access and retrieval of information, with less scope for error.
Elaboration strategies based on phonemic or semantic information have some support in the literature
(Cirrin & Gillam, 2008). More speculatively, visual methods such as mind maps or colourful posters may
offer non-verbal alternatives for the organisation of complex and detailed information, with key ‘entry
points’ to facilitate access via easy to remember cues. Verbal fluency tasks are timed, and one limitation
of the current study is that is not possible to know whether providing extra time could have enhanced
performance, given that children with SLI have processing speed limitations (Leonard et al., 2007).
There was limited evidence for the first part of Hypothesis 2, derived from Luo et al. (2010), that
EF should be a stronger predictor of phonemic than semantic fluency (because phonemic fluency draws
more heavily on EF skills). Inhibition scores related to errors on the phonemic fluency task (proportion
and total errors), most likely because inhibition was required to monitor (and suppress) output for
repeated/irrelevant items and rule violations. As there were no further significant relationships
between any other EF variables and any other aspect of verbal fluency, this finding suggests that EF (i.e.
inhibition) is a stronger predictor of phonemic than semantic fluency, but only in one area, namely error
monitoring. However, although these data provide some support the first part of Hypothesis 2, a trend
towards a relationship between inhibition and error scores on the semantic fluency task cautions against
strong conclusions, and suggests that there may be a general inhibitory mechanism operating on error
monitoring during both verbal fluency tasks.
The absence of relationships between ELWM and verbal fluency was unexpected, particularly
given the simple correlations observed (see Table 5). It may be that relationships between ELWM and
fluency disappeared because language ability was the stronger predictor in the regressions. Language
ability and ELWM shared considerable variance (simple r=.69), and relationships between language
ability and summary measures of executive functioning that include ELWM have been reported
previously (Fitzpatrick, McKinnon, Blair, & Willoughby, 2014). Further, the lack of relationships between
EF switching and verbal fluency might be surprising, given the role for switching within fluency tasks.
However, switching between well-known sequences provided by the experimenter (e.g., letters,
numbers), as in standard EF switching tasks (Trail Making), may not be the same as switching between
self-generated clusters of items in verbal fluency tasks. These data do not support the suggestion
The second part of Hypothesis 2, that language ability should be more related to semantic than
phonemic fluency, was not supported. Language ability was based on expressive vocabulary, expressive
language and semantic knowledge, and proved highly relevant for virtually all aspects of phonemic
fluency performance, ranging from response output (total, valid, quartiles 1 through 4), to switching and
cluster size. Only phonemic fluency errors (total, proportion) were unrelated to language ability. Thus,
stronger language abilities played a role in the more difficult phonemic fluency measures throughout all
quartiles of the task, and had an additional supportive role for performance on measures of cluster size
and number of switches between generated sub-categories. For semantic fluency, verbal ability was
related to total and valid measures of response output, and to performance in the first quartile of the
task only. This suggests that better language ability supported performance in earlier parts of the
semantic fluency task, when items were more readily available, but ceased to be important during the
more effortful searching required during later parts of the task. Hence, no support was found for the
second part of Hypothesis 2, that language ability should be a stronger predictor of semantic than
phonemic fluency.
The first part of Hypothesis 3, that language ability should be related to fluency performance at
all stages of the response trial (every quartile), was fully supported for phonemic fluency, but only
partially supported for semantic fluency. This implies that Luo et al. (2010) were correct to surmise that
language ability is a fundamental skill underlying phonemic fluency performance, regardless of whether
we consider items generated in the early ‘burst’ at the beginning of the task, or later items when
performance levels drop off and search processes become more demanding (Hurks et al., 2006).
However, effortful searching for items towards the middle and end of the semantic fluency task did not
appear to be supported by language ability. The second part of Hypothesis 3, that EF should show
stronger relationships with performance towards the end of each response trial, was not supported for
task were found. It was not possible, therefore, to draw conclusions about whether EF skills are
recruited more heavily for effortful later portions of the task as opposed to earlier automatic searching.
The current findings would suggest that such relationships are not apparent.
One final issue concerns whether these results for a mixed sample of children with a wide range
of language and EF abilities would generalise to typical samples. Exploratory regressions on the typical
sample alone indicated this was the case. Most findings were very similar in the typical group, with
relationships between fluency and language ability, and links between inhibition and error scores.
5. Conclusion
Children with SLI showed widespread difficulties with multiple aspects of verbal fluency
performance relative to typical children, including searching, retrieving and generating words according
to a rule, switching between relevant semantic and phonemic sub-categories, and monitoring output for
errors such as repeated items and rule violations. These difficulties were apparent for easily accessed
items at the beginning of the task (‘automatic processing’), and later items requiring more demanding
search efforts.
Two factors identified in previous literature as predictors of verbal fluency performance were
explored: language ability and EF (ELWM, inhibition, switching). Language ability related to virtually all
aspects of phonemic fluency performance and some aspects of semantic fluency performance. The only
measure of EF to show significant relationships with verbal fluency was inhibition, which related to error
monitoring in the phonemic fluency task. Overall, the relationships between verbal fluency and EF were
modest compared to the relationships between fluency and language ability. The findings suggest that
verbal fluency difficulties in children with language impairments reflect language weaknesses, with a
References
Archibald, L.D., & Gathercole, S. (2007). Nonword repetition in specific language impairment: More than
a phonological short-term memory deficit. Psychonomic Bulletin & Review, 14(5), 919-924.
doi:910.3758/bf03194122.
Bayliss, D.M., Jarrold, C., Baddeley, A.D., & Leigh, E. (2005). Differential constraints on the working
memory and reading abilities of individuals with learning difficulties and typically developing
children. Journal of Experimental Child Psychology, 92(1), 76-99. doi:
http://dx.doi.org/10.1016/j.jecp.2005.04.002
Bialystok, E. (2010). Global-local and trail-making tasks by monolingual and bilingual children: Beyond
inhibition. Developmental Psychology, 46(1), 93-105. doi:110.1037/a0015466.
Bialystok, E. (2011). Coordination of executive functions in monolingual and bilingual children. Journal of
Experimental Child Psychology, 110(3), 461-468. doi:org/410.1016/j.jecp.2011.1005.1005.
Bishop, D.V.M. (2014). Ten questions about terminology for children with unexplained language
problems. International Journal of Language and Communication Disorders, 49 (4), 381-415.
doi:10.1111/1460-6984.12101
Bishop, D.V.M., & Norbury, C.F. (2005). Executive functions in children with communication
impairments, in relation to autistic symptomatology: I: Generativity. Autism, 9(1), 7-27.
doi:10.1177/1362361305049027
Bishop, D.V.M., & Norbury, C.F. (2008). Speech and language impairments. In M. Rutter, D.V.M. Bishop,
D. Pine, S. Scott, J. Stevenson, E.A. Taylor & A. Thapar (Eds.), Child and Adolescent Psychiatry
(5th ed., pp. 782-801). Oxford: Blackwells. doi:10.1002/9781444300895.
Bishop, D.V.M., North, T., & Donlan, C. (1996). Nonword Repetition as a Behavioural Marker for
Inherited Language Impairment: Evidence From a Twin Study. Journal of Child Psychology and
Cirrin, F.M. & Gillam, R.B. (2008). Language intervention practices for school-age children with spoken
language disorders: A systematic review. Language, Speech, and Hearing Services in Schools, 39,
S110-S137. doi:0161-1461/08/3901-S110
Cohen, M.J., Morgan, A.M., Vaughn, M., Riccio, C.A., & Hall, J. (1999). Verbal Fluency in Children:
Developmental Issues and Differential Validity in Distinguishing Children with Attention-Deficit
Hyperactivity Disorder and Two Subtypes of Dyslexia. Archives of Clinical Neuropsychology,
14(5), 433-443. doi:org/410.1016/S0887-6177(1098)00038-00039.
Conti-Ramsden, G., & Botting, N. (1999). Classification of Children With Specific Language Impairment:
Longitudinal Considerations. Journal of Speech, Language & Hearing Research, 42(5), 1195-1204.
doi:1110.1044/jslhr.4205.1195.
Corbett, B.A., Constantine, L.J., Hendren, R., Rocke, D., & Ozonoff, S. (2009). Examining executive
functioning in children with autism spectrum disorder, attention deficit hyperactivity disorder
and typical development. Psychiatry Research, 166(2), 210-222.
doi:210.1016/j.psychres.2008.1002.1005.
Delis, D.C., Kaplan, E., & Kramer, J.H. (2001). Delis–Kaplan Executive Function System (D-KEFS). London:
The Psychological Corporation Ltd.
Diamond, A. (2013). Executive Functions. Annual Review of Psychology, 64(1), 135-168.
doi:110.1146/annurev-psych-113011-143750.
Dibbets, P., Bakker, K., & Jolles, J. (2006). Functional MRI of Task Switching in Children with Specific
Language Impairment (SLI). Neurocase, 12(1), 71-79. doi:10.1080/13554790500507032.
Dollaghan, C., & Campbell, T.F. (1998). Nonword Repetition and Child Language Impairment. Journal of
Edwards, J., & Lahey, M. (1998). Nonword repetitions of children with specific language impairment:
Exploration of some explanations for their inaccuracies. Applied Psycholinguistics, 19(02),
279-309. doi:210.1017/S0142716400010079.
Elliott, C.D., Smith, P., & McCullouch, K. (1997). British Ability Scales (BAS-II) (2nd ed.). Windsor:
NFER-Nelson.
Ellis Weismer, S., Evans, J., & Hesketh, L.J. (1999). An Examination of Verbal Working Memory Capacity
in Children With Specific Language Impairment. Journal of Speech, Language & Hearing
Research, 42(5), 1249-1260. doi:1210.1044/jslhr.4205.1249.
Ferguson, A.N., Bowey, J.A., & Tilley, A. (2002). The Association between Auditory Memory Span and
Speech Rate in Children from Kindergarten to Sixth Grade. Journal of Experimental Child
Psychology, 81(2), 141-156. doi:org/110.1006/jecp.2001.2646.
Field, A. (2013). Discovering Statistics Using SPSS (4 ed.). London: Sage Publications Ltd.
Fisk, J.E., & Sharp, C.A. (2004). Age-Related Impairment in Executive Functioning: Updating, Inhibition,
Shifting, and Access. Journal of Clinical and Experimental Neuropsychology, 26(7), 874-890.
doi:810.1007/s11065-11007-19040-z.
Fitzpatrick, C., McKinnon, R.D., Blair, C.B. & Willoughby, M.T. (2014). Do preschool executive function
skills explain the school readiness gap between advantaged and disadvantaged children?
Learning and Instruction, 30, 25-31. doi:http://dx.doi.org/10.1016.2013.11.003
Gathercole, S.E., & Baddeley, A.D. (1990). Phonological Memory Deficits in Language Disordered
Children: Is There a Causal Connection? Journal of Memory and Language, 29(3), 336-360.
Geurts, H.M., Verte, S., Oosterlaan, J., Roeyers, H., & Sergeant, J.A. (2004). How specific are executive
functioning deficits in attention deficit hyperactivity disorder and autism? Journal of Child
Henry, J.D., & Crawford, J.R. (2004). A Meta-Analytic Review of Verbal Fluency Performance Following
Focal Cortical Lesions. Neuropsychology, 18(2), 284-295.
doi:210.1037/0894-4105.1018.1032.1284.
Henry, L.A., Messer, D.J., & Nash, G. (2012). Executive functioning in children with specific language
impairment. Journal of Child Psychology & Psychiatry, 53(1), 37-45.
doi:10.1111/j.1469-7610.2011.02430.x.
Hick, R.F., Botting, N., & Conti-Ramsden, G. (2005). Short-term memory and vocabulary development in
children with Down syndrome and children with specific language impairment. Developmental
Medicine & Child Neurology, 47(08), 532-538.
Huizinga, M., Dolan, C.V., & van der Molen, M.W. (2006). Age-related change in executive function:
Developmental trends and a latent variable analysis. Neuropsychologia, 44(11), 2017-2036.
doi:org/2010.1016/j.neuropsychologia.2006.2001.2010.
Hulme, C., & Snowling, M.J. (2009). Developmental Disorders of Language, Learning and Cognition.
Chichester, West Sussex: Wiley-Blackwell.
Hurks, P.P.M., Schrans, D., Meijs, C., Wassenberg, R., Feron, F.J.M., & Jolles, J. (2010). Developmental
Changes in Semantic Verbal Fluency: Analyses of Word Productivity as a Function of Time,
Clustering, and Switching. Child Neuropsychology, 16(4), 366-387.
doi:310.1080/09297041003671184.
Hurks, P.P.M., Vles, J.S.H., Hendriksen, J.G.M., Kalff, A.C., Feron, F.J.M., Kroes, M., et al. (2006). Semantic
Category Fluency Versus Initial Letter Fluency Over 60 Seconds as a Measure of Automatic and
Controlled Processing in Healthy School-aged Children. Journal of Clinical & Experimental
Im-Bolter, N., Johnson, J., & Pascual-Leone, J. (2006). Processing Limitations in Children With Specific
Language Impairment: The Role of Executive Function. Child Development, 77(6), 1822-1841.
doi:1810.1111/j.1467-8624.2006.00976.x.
Kavé, G. (2006). The development of naming and word fluency: evidence from Hebrew-speaking
children between ages 8 and 17. Developmental Neuropsychology, 29(3), 493-508.
doi:410.1207/s15326942dn15322903_15326947.
Kavé, G., Kigel, S., & Kochva, R. (2008). Switching and clustering in verbal fluency tasks throughout
childhood. Journal of Clinical & Experimental Neuropsychology, 30(3), 349-359.
doi:310.1080/13803390701416197.
Kiernan, B., Snow, D., Swisher, L., & Vance, R. (1997). Another look at nonverbal rule induction in
children with SLI: Testing a flexible reconceptualization hypothesis. Journal of Speech, Language
& Hearing Research, 40(1), 75-82. doi:10.1044/jslhr.4001.1075.
Klenberg, L., Korkman, M., & Lahti-Nuuttila, P. (2001). Differential Development of Attention and
Executive Functions in 3- to 12-Year-Old Finnish Children. Developmental Neuropsychology,
20(1), 407-428. doi:410.1207/S15326942DN15322001_15326946.
Korkman, M., Kemp, S.L., & Kirk, U. (2001). Effects of Age on Neurocognitive Measures of Children Ages
5 to 12: A Cross-Sectional Study on 800 Children From the United States. Developmental
Neuropsychology, 20(1), 331-354. doi:310.1207/S15326942DN15322001_15326942.
Law, J., Garret, Z. & Nye, C. (2004). The efficacy of treatment for children with developmental speech
and language delay/disorder: A meta-analysis. Journal of Speech, Language, and Hearing
Research, 47, 924-943. doi:1092-4388/04/4704-0924
Lehto, J.E., Juujärvi, P., Kooistra, L., & Pulkkinen, L. (2003). Dimensions of executive functioning:
Evidence from children. British Journal of Developmental Psychology, 21, 59-80.
Leonard, L.B. (1998). Children with Specific Language Impairment. Boston: MIT Press.
Leonard, L.B., Ellis Weismer, S., Miller, C.A., Francis, D.J., Tomblin, J.B., & Kail, R.V. (2007). Speed of
Processing, Working Memory, and Language Impairment in Children. Journal of Speech,
Language & Hearing Research, 50(2), 408-428. doi:410.1044/1092-4388(2007/1029).
Luo, L., Luk, G., & Bialystok, E. (2010). Effect of language proficiency and executive control on verbal
fluency performance in bilinguals. Cognition, 114(1), 29-41.
doi:10.1016/j.cognition.2009.1008.1014.
Marshall, C.R. (2014). Word production errors in children with developmental language impairments.
Philosophical Transactions of the Royal Society B, 369: 20120389. doi:10.1098/rstb.2012.0389
Marshall, C.R., Rowley, K., Mason, K., Herman, R. & Morgan, G. (2013). Lexical organization in deaf
children who use British Sign Language: Evidence from a semantic fluency task. Journal of Child
Language, 40(1), 193 - 220. doi:10.1017/S0305000912000116
Marton, K. (2008). Visuo-spatial processing and executive functions in children with specific language
impairment. International Journal of Language & Communication Disorders, 43(2), 181-200.
doi:110.1080/16066350701340719.
Marton, K., & Schwartz, R.G. (2003). Working Memory Capacity and Language Processes in Children
With Specific Language Impairment. Journal of Speech, Language & Hearing Research, 46(5),
1138-1153. doi:1110.1044/1092-4388(2003/1089).
Matute, E., Rosselli, M., Ardila, A., & Morales, G. (2004). Verbal and Nonverbal Fluency in
Spanish-Speaking Children. Developmental Neuropsychology, 26(2), 647-660.
doi:610.1207/s15326942dn15322602_15326947.
Mayr, U. (2002). On the dissociation between clustering and switching in verbal fluency: comment on
Troyer, Moscovitch, Winocur, Alexander and Stuss. Neuropsychologia, 40(5), 562-566.
Messer, D.J. & Dockrell, J.E. (2013). Children with word finding difficulties: continuities and profiles of
abilities. First Language, 33, 433– 448. doi:10.1177/0142723713493345
Miyake, A., & Friedman, N.P. (2012). The Nature and Organization of Individual Differences in Executive
Functions: Four General Conclusions. Current Directions in Psychological Science, 21(1), 8-14.
doi:10.1177/0963721411429458.
Miyake, A., Friedman, N.P., Emerson, M.J., Witzki, A.H., Howerter, A., & Wager, T.D. (2000). The Unity
and Diversity of Executive Functions and Their Contributions to Complex "Frontal Lobe" Tasks: A
Latent Variable Analysis. Cognitive Psychology, 41(1), 49-100. doi:110.1006/cogp.1999.0734.
Montgomery, J.W. (2002). Understanding the Language Difficulties of Children With Specific Language
Impairments: Does Verbal Working Memory Matter? American Journal of Speech-Language
Pathology, 11(1), 77-91. doi:1058-0360/1002/1101-0077.
Montgomery, J.W., Magimairaj, B.M., & Finney, M.C. (2010). Working Memory and Specific Language
Impairment: An Update on the Relation and Perspectives on Assessment and Treatment.
American Journal of Speech-Language Pathology, 19(1), 78-94.
doi:10.1044/1058-0360(2009/1009-0028).
Nash, H.M., & Snowling, M.J. (2008). Semantic and phonological fluency in children with Down
syndrome: Atypical organization of language or less efficient retrieval strategies? Cognitive
Neuropsychology, 25(5), 690-703. doi:610.1080/02643290802274064.
Pickering, S., & Gathercole, S.E. (2001). Working Memory Test Battery for Children (WMTB-C). London:
The Psychological Corporation Ltd.
Prigatano, G.P., & Gray, J.A. (2008). Predictors of performance on three developmentally sensitive
neuropsychological tests in children with and without traumatic brain injury. Brain Injury, 22(6),
Reilly, S., Bishop, D.V.M. & Tomblin, B. (2014). Terminological debate over language impairment in
children: forward movement and sticking points. International Journal of Language and
Communication Disorders, 49(4), 452-462. doi:10.1111/1460-6984.12111
Reilly, S., Tomblin, B., Law, J., McKean, C., Mensah, F.K., Morgan, A., Goldfeld, S., Nicholson, J.M. &
Wake, M. (2014). Specific language impairment: a convenient label for whom? International
Journal of Language and Communication Disorders, 49(4), 416-451.
doi:10.1111/1460-6984.12102
Riva, D., Nichelli, F., & Devoti, M. (2000). Developmental Aspects of Verbal Fluency and Confrontation
Naming in Children. Brain and Language, 71(2), 267-284. doi: 210.1006/brln.1999.2166.
Ruff, R.M., Light, R.H., Parker, S.B., & Levin, H.S. (1997). The Psychological Construct of Word Fluency.
Brain and Language, 57(3), 394-405. doi:org/310.1006/brln.1997.1755.
Sauzéon, H., Lestage, P., Raboutet, C., N’Kaoua, B., & Claverie, B. (2004). Verbal fluency output in
children aged 7-16 as a function of the production criterion: Qualitative analysis of clustering,
switching processes, and semantic network exploitation. Brain and Language, 89(1), 192-202.
doi:org/110.1016/S0093-1934X(1003)00367-00365.
Seidenberg, M. S. (2005). Connectionist Models of Word Reading. Current Directions in Psychological
Science, 14(5), 238-242. doi:210.1111/j.0963-7214.2005.00372.x.
Semel, E., Wiig, E.H., & Secord, W.A. (2006). Clinical Evaluation of Language Fundamentals CELF-4 UK
(4th ed.). London: The Psychological Corporation Ltd.
St Clair-Thompson, H.L., & Gathercole, S.E. (2006). Executive functions and achievements in school:
Shifting, updating, inhibition, and working memory. The Quarterly Journal of Experimental
Psychology, 59(4), 745-759. doi:710.1080/17470210500162854.
Troyer, A.K. (2000). Normative Data for Clustering and Switching on Verbal Fluency Tasks. Journal of
Troyer, A.K., Moscovitch, M., & Winocur, G. (1997). Clustering and switching as two components of
verbal fluency: Evidence from younger and older healthy adults. Neuropsychology, 11(1),
138-146. doi:110.1037/0894-4105.1011.1031.1138.
Unsworth, N., Spillers, G.J., & Brewer, G.A. (2011). Variation in verbal fluency: A latent variable analysis
of clustering, switching, and overall performance. Quarterly Journal of Experimental Psychology,
64(3), 447-466. doi:410.1080/17470218.17472010.17505292.
van der Ven, S.H.G., Kroesbergen, E.H., Boom, J. & Leseman, P.P.M. (2013). The structure of executive
functions in children: A closer examination of inhibition, shifting, and updating. British Journal
of Developmental Psychology, 31, 70-87. doi:10.1111/j.2044-835X.2012.02079.x
Van Weerdenburg, M., Verhoeven, L., & Van Balkom, H. (2006). Towards a typology of specific language
impairment. Journal of Child Psychology & Psychiatry, 47(2), 176-189.
doi:110.1111/j.1469-7610.2005.01454.x.
Weckerly, J., Wulfeck, B., & Reilly, J. (2001). Verbal Fluency Deficits in Children With Specific Language
Impairment: Slow Rapid Naming or Slow to Name? Child Neuropsychology, 7(3), 142-152.
doi:110.1076/chin.1077.1073.1142.8741.
Weyandt, L.L., & Willis, W.G. (1994). Executive functions in school-aged children: Potential efficacy of
tasks in discriminating clinical groups. Developmental Neuropsychology, 10(1), 27 - 38.
Table 1: Mean scores (SD in brackets) and ranges (lower line) for descriptive data for all groups.
Variable/Group SLI (n=41, 28 boys) Typical (n=88, 59 boys)
Age (years; months) 11;6 (16m)
(8;1–14;1)
9;10 (28m) (6;0-14;8)
BAS-II Matrices T-score1 (Non-verbal IQ, NVIQ)
54.6 (6.2) (46-71)
57.4 (6.9) (40-78)
BAS-II Verbal ability2 100.8 (18.3)
(54.5-136.5)
111.5 (21.5) (65-160)
Age equivalent average score4 (years; months) 7;9 (13m) (6;0-10;3) 10;3 (33m) (6;7-15;11)
Recalling sentences3 (CELF-4-UK)
5.2 (2.5) (1-10)
10.4 (1.9) (8-15)
Formulated sentences3 (CELF-4-UK)
3.8 (2.5) (1-8)
10.5 (1.9) (8-14)
Word classes receptive3 (CELF-4-UK)
5.2 (1.6) (1-7)
10.2 (2.0) (8-15)
Word classes expressive3 (CELF-4-UK) 5.7 (1.8) (1-9) 10.7 (1.8) (8-15) 1
T-scores mean=50, SD=10
2
Average ability scores - equivalent to raw scores – mean across Word Definitions and Verbal Similarities
3
Scaled scores mean=10, SD=3
4