Int. J. Electrochem. Sci., 14 (2019) 3336 – 3349, doi: 10.20964/2019.04.56
International Journal of
ELECTROCHEMICAL
SCIENCE
www.electrochemsci.org
Coiled Spring-Like Hard Carbon as an Anode Material for
Lithium-ion Batteries
Zhonghua Lu, Zeyin Guo, Xiaoxia Ren, Shou-Dong Xu*
College of Chemistry and Chemical Engineering, Taiyuan University of Technology, Taiyuan, 030024, People’s Republic of China
*E-mail: [email protected]
Received: 2 January 2019 / Accepted: 18 February 2019 / Published: 10 March 2019
Carbon micro-coils (CMCs) with a coiled spring-like morphology and hard carbon structure were prepared using metal Ni powder as a catalyst by chemical vapor deposition method at 750 °C in a mixed gas atmosphere (N2:H2:C2H2=1:3:1). The obtained CMCs have a screw diameter of approximately 10
μm and a modest surface area of 61.2 m2 g-1 with a total pore volume of 0.076 cm3 g-1. When used as an
anode material in lithium-ion batteries, CMCs electrodes exhibit excellent electrochemical performances. In particular, a comparable good cycling stability with no obvious capacity loss, preserving almost over 99.0% of capacity retention ratio can be achieved at 100 mA g-1 after 200 cycles. A lithium storage mechanism for the CMCs has been proposed based on the quantity of the mesopores, which can be applied to explain the irreversible capacity of the CMCs during the first cycle. Electrochemical impedance spectroscopy results show that the CMC electrode has small values for both the electrolytic resistance and combined resistances including the contact resistance and passivation film resistance. This study illustrates the great promise of CMCs and other hard carbon materials with unique morphologies for application in energy storage and conversion systems such as lithium-ion batteries, sodium-ion batteries and supercapacitors.
Keywords: Lithium-ion battery, Carbon micro-coils, Lithium storage mechanism, Electrochemical impedance spectra, Anode
1. INTRODUCTION
lifespans, plays a key role in the development of LIBs, and has became an ongoing pursuit for scientific researchers [5]. Currently, carbon materials (including natural graphite, artificial graphite, soft carbon and hard carbon) used as anode materials have been a dominant position in the commercial LIBs due to their high capacities, low costs, remarkable electrochemical properties and easy accessibilities [6, 7].
To date, numerous of carbon materials with a vatiety of microstructures and unique morphologies have been reported and used as the anode matertials in LIBs, such as porous carbon nanotubes (CNTs) [8], multi-walled CNTs [9], graphene [10], hollow carbon nanospheres [11], porous graphitic carbon nanosheets [12], and carbon nanofibers [13]. All these carbon materials exhibit outstanding and remarkable lithium storage properties. For example, Huang et al. [11] prepared hollow carbon nanospheres (HCNSs) by annealing the Cu-C core-shell nanoparticles at 1250 °C under vacuum. The HCNS delivered a reversible capacity of 400 mA h g-1 with no capacity decay after 100 cycles at 186
mA g-1. Although the HCNS electrode had an excellent cycling stability, the main problem was its large
irreversible capacity loss during the first cycle. The N-doped fused carbon fibers reported by Wang et al. [13] possessed a capacity of 576 mA h g-1 at 30 mA g-1 and 200 mA h g-1 at a high current density of
2000 mA g-1. However, their complicated preparation methods and the use of a carcinogen
(N-dimethylformamide, DMF) impede their large-scale application in LIBs.
Among all the carbon materials, carbon micro-coils (CMCs), as a new kind of carbon fiber material with a unique chiral conformation and a unique 3D helical structure, are regarded as ideal and attractive materials for micromagnetic sensors [14], high elastic electro-conductors [14], polymer matrices [15] and supercapacitors [16] because CMCs can possess many desirable merits by virtue of the stereospecific nature of their magnetoresistance [17], high super-elastic properties [18] and favourable electrical conductivity. Motojima et al. systematically studied the preparation conditions, morphologies, growth mechanisms, microstructures and potential applications of CMCs in detail [19, 20]. They found CMCs with an amorphous structure could be graphitized at high temperature, and could be used as high sensitive tactile sensors based on the noble LCR composite hybrid resonance, as well as in micro-electromechanical systems (MEMS) [19, 20].
However, only few papers have studied the electrochemical properties of CMCs. Wu et al. [16] compared the energy storage characteristics of CMCs and straight carbon fibers firstly. They found that the oxidation resistance, hydrogen storage and electrochemical capacitance of the CMCs were superior to those of the straight carbon fibers. Wang et al. [21] prepared MnOOH/CMCs composites by a micro-wave deposition method and studied their specific capacitive performances utilizing mild Na2SO4 as the
electrolyte. The composite electrode displayed a high capacitance (396 F g-1, calculated from the cyclic
2. EXPERIMENTAL
2.1 Synthesis of carbon micro-coils
The CMCs used in this study were prepared by the chemical vapor deposition (CVD) method using Ni-catalysed acetylene at 750 °C. The typical synthetic process for the CMCs can be described as follows. First, Ni powders, used here as a catalyst, with a diameter of approximately 1 μm were dispersed homogeneously on a graphite substrate with a size of 50×10×5 mm. Then, the graphite substrate with the Ni catalyst was placed into a quartz tube, and the quartz tube was installed into a horizontal electric furnace. The furnace was first flushed with N2 for 30 min to remove any air in the quartz tube, and then
the temperature was increased gradually at a rate of 5 °C/min under a nitrogen atmosphere (20 ml/min) until reaching 650 °C. At this time, hydrogen was introduced at a rate of 60 ml/min, and the furnace temperature was continuously increased from 650 to 750 °C. When the temperature reached 750 °C, the acetylene (20 ml/min) was introduced, and the composition of the gas mixture was maintained at 1:3:1 (N2:H2:C2H2) for 60 min to allow for the growth of the CMCs. Thereafter, the furnace was turned off
and the flow of gas was stopped, except for N2 until the temperature was less than 100 °C. Finally, the
products were scraped from the substrate and washed with 0.1 M HCl to remove the residual Ni. The final products were dried at 60 °C for 12 h.
2.2 Material characterization
The structure was characterized by X-ray diffraction (XRD) (Philips, Netherlands) with Cu-Kα radiation within the 2θ range of 10-80° and Raman spectroscopy (Bruker VERTEX 70, USA). The morphology of the CMCs was investigated by scanning electron microscopy (SEM) (JSM-6700, Japan). The surface area of the CMCs was calculated by the Brunauer-Emmett-Teller (BET) method and the pore size distribution was derived from the desorption branch using the Barrett-Joyner-Halenda (BJH) method.
2.3 Electrochemical measurements
The working electrodes were made from the active material (CMCs) and polyvinylidene difluoride (PVDF) in a weight ratio of 9:1. The components were mixed as a viscous slurry using N-methyl-2-pyrrolidone (NMP) as the solvent, and then the homogeneous slurry was coated onto copper foil, dried at 120 °C for 12 h in a vacuum oven and then pressed at 8 MPa. The electrodes were transferred into a glove box filled with pure argon before being assembled into coin cells.
over the frequency range of 105 to 10-2 Hz with a potentiostatic signal amplitude of 5 mV. The electrolyte
used here was 1 M LiPF6 dissolved in EC: EMC (3:7, v/v). All the tests were measured at 25 °C.
3. RESULTS AND DISCUSSION
3.1 Structural and morphological characterization
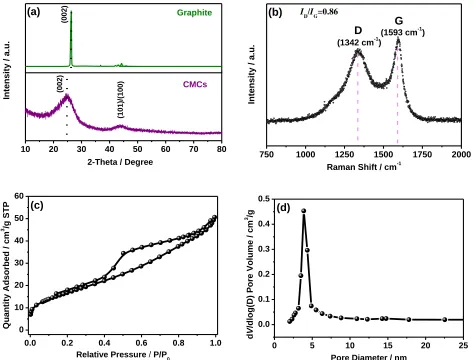
To compare the differences in the structures between natural graphite and the as-prepared material, XRD was employed, as shown in Fig. 1(a). In the XRD pattern of natural graphite, the distinct and sharp diffraction peak located at ~26°, which is the characteristic diffraction peak of natural graphite, corresponds to the diffraction of the (002) plane with an interlayer distance of 0.380 nm. On the other hand, in the XRD pattern of the CMC material, the (002) plane diffraction peak can also be found at ~24°, which represents a shift close to a lower angle, suggesting an increase in the interlayer distance that would be beneficial for reversible lithium-ion insertion/extraction. Moreover, this peak became broader and the intensity weakened compared to that of natural graphite, indicating that the CMC material has an amorphous carbon structure with short-range ordering but long-range disordering. Furthermore, the broad lower-intensity peak located at ~43° is a characteristic diffraction peak of amorphous carbon or hard carbon and can be attributed to the (100) and (101) planes of nano-graphitic crystals [22, 23].
The structure of the CMC material was further investigated by Raman spectroscopy, as displayed in Fig. 1(b). Two typical bands appeared at approximately 1342 and 1593 cm-1, which can be denoted as the D band and G band, respectively. In general, the D band originates from the vibration of carbon atoms and the disorder-induced features of amorphous carbon, leading to several structural defects [24, 25]. The G band is assigned to the sp2 stretching vibrations of the graphitic structure [26]. Moreover, the
graphitization degree and the concentration of defects in the region of the amorphous carbon can be calculated from the relative intensity ratio of the D and G bands (IG/ID) in the Raman spectrum [27, 28].
The value of IG/ID is calculated to be 0.85, further indicating that the structure of the CMCs is disordered
and contains defects. Indeed, the disordered structure and defects may provide more lithium storage sites and will be beneficial for lithium storage.
Fig. 1(c) and (d) show the nitrogen adsorption-desorption isotherm and the pore size distribution of the CMCs derived from the desorption branch using the Barrett-Joyner-Halenda (BJH) method. The nitrogen adsorption-desorption isotherms of the CMCs, it exhibits a typical type IV absorption isotherm with a type H3 hysteresis loop. The H3-type hysteresis loop ranges from a relative pressure of P/P0≈0.5
to the saturation vapor pressure, indicating that there could be numerous mesopores in the structure [29, 30], which can be further demonstrated by the pore size distribution (Fig. 2(d)). The pore sizes are mainly distributed in the range of 2-5 nm, illustrating that the mesopores take up almost all the distribution. In addition, the BET surface area of the CMCs is 61.2 m2 g-1 with a total pore volume of 0.076 cm3 g-1. The
Figure 1. (a) XRD patterns of natural graphite and CMCs, and (b) Raman spectrum, (c) nitrogen adsorption-desorption isotherms and (d) pore size distribution of the CMCs
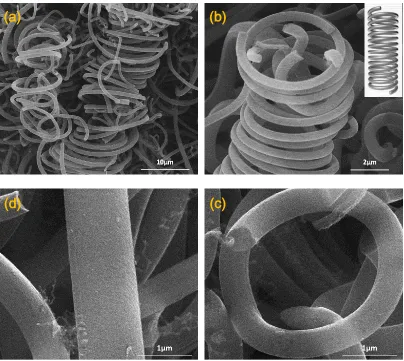
Fig. 2 presents the SEM images of the CMCs at different magnifications. The CMCs exhibit a 3D spiral morphology with a screw diameter of approximately 10 μm. The entire morphology of the CMCs looks similar to a coiled spring, which is demonstrated in the inset of Fig. 2(b). Moreover, the surface of a single carbon micro-coil tends to be very smooth except for several scattered carbon nanotubes distribution. The cross-section of a single carbon micro-coil indicates they have a solid structure, which can improve the tap density of the material, eventually leading to an increase in the volume power density of the battery.
10 20 30 40 50 60 70 80
(10 1)/ (10 0) (00 2) (00 2) CMCs
2-Theta / Degree
Graphite Inten s it y / a.u . (a)
750 1000 1250 1500 1750 2000
(b)
(1593 cm-1) G Inten s it y / a.u .
Raman Shift / cm-1 D
(1342 cm-1)
ID/IG=0.86
0.0 0.2 0.4 0.6 0.8 1.0
0 10 20 30 40 50 60 (c) Qu a n tit y Ad s o rb e d / cm
3 /g ST
P
Relative Pressure / P/P0
0 5 10 15 20 25
0.0 0.1 0.2 0.3 0.4 0.5 (d) d V /dlog (D) P o re Vo lume / cm 3 /g
[image:5.596.62.535.77.437.2]
[image:6.596.97.501.68.429.2]
Figure 2. SEM images of the CMCs. The inset in (b) is a picture of a coiled spring. 3.2 Electrochemical performances
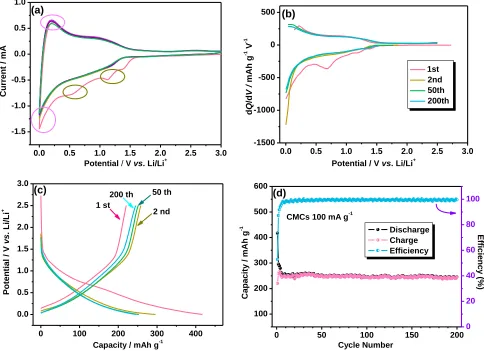
Fig. 3 (a) shows the CV curves of the CMC electrode at a scan rate of 1 mV s-1. In the first anodic scan, namely, the first lithium-ion insertion process, there are four discernible reductive current peaks can be found. Three of them, those located at approximately 1.5, 1.0 and 0.6 V, disappeared in subsequent cycles and can be attributed to the formation of a solid electrolyte interface (SEI) film. The formation of the SEI film can be divided into two parts: one is related to the reaction of ethylene carbonate (EC) molecules and Li+ resulting in the formation of inorganic lithium carbonates (Li2CO3);
the other can be assigned to the further reaction of EC and Li+ to form different alkylcarbonate species [31, 32]. Moreover, a pair of sharp and symmetrical redox peaks appeared at approximately 0.0-0.1 V and should refer to the processes of lithium ions insertion/extraction into/from the graphite crystallites and micropores of the CMCs. In addition, all the CV curves except for that of the first cycle of the CMC electrode essentially overlap with each other, indicating a stable SEI film formation and a considerably stable cycling performance for the CMC electrode.
Fig. 3 (b) exhibits the dQ/dV curves of the CMCs electrode, which are calculated from the charge-discharge curves at 100 mA g-1 which is illustrated in Fig. 3 (c). The dQ/dV curves are similar to the CV results, indicating that the main acreage enclosed by differential curve existed under 1.5 V and the differential curves overlap well. In addition, different from the charge-discharge profiles of the
(a)
(b)
graphite electrode, a sloping voltage decreasing region for the CMC electrode is observed in Fig. 3 (c) suggesting that the main capacity contribution region is from 1.3 to 0.0 V, which is typical of the charge/discharge characteristics for hard carbon materials [33, 34]. It is noteworthy that the initial charge/discharge processes have the lowest charge capacity (220.4 mAh g-1 for the 1st charge) but the highest discharge capacity (417.1 mAh g-1 for the 1st discharge), resulting in an observable irreversible capacity. The reason for the large irreversible capacity during the first discharge-charge processes and the relevant lithium storage mechanism of the CMC materials will be discussed in the later section.
[image:7.596.57.544.299.650.2]The cycling performance of the CMCs electrode cycled at a current density of 100 mA g-1 is displayed in Fig. 3 (d). After the initial five cycles, the CMC electrode shows a good cycling stability with no obvious capacity loss, retaining over 99.0% of the initial capacity after 200 cycles. On the other hand, except for the first low Coulombic efficiency of 52.8% due to the large irreversible capacity, all subsequent cycles deliver a high Coulombic efficiency of over 99.3%.
Figure 3. (a) CV plots of the CMC electrode at a scan rate of 1 mV s-1, and (b) dQ/dV curves, (c)
charge-discharge curves and (d) cyclic performance of the CMC electrode at 100 mA g-1
To further investigate the rate performance and the capacity recovery capability of the CMC electrode, we measured its charge-discharge performance under different current densities. The reversible capacity slightly decreases with increasing current densities. The CMC electrode can deliver the average discharge capacities of 280, 203, 170, 127 and 98 mAh g-1 at 100, 200, 500, 1000 and 2000
0.0 0.5 1.0 1.5 2.0 2.5 3.0 -1.5 -1.0 -0.5 0.0 0.5 1.0 Cu rr e n t / mA
Potential / V vs. Li/Li+ (a)
0.0 0.5 1.0 1.5 2.0 2.5 3.0 -1500 -1000 -500 0 500 (b) d Q /d V / mA h g
-1 V
-1
Potential / V vs. Li/Li+
1st 2nd 50th 200th
0 100 200 300 400
0.0 0.5 1.0 1.5 2.0 2.5 3.0 (c) 2 nd 50 th 200 th P o te n tial / V vs . L i/ L i +
Capacity / mAh g-1 1 st
0 50 100 150 200
100 200 300 400 500 600 (d) Discharge Charge Efficiency Cycle Number Ca p a c it y / mAh g -1
CMCs 100 mA g-1
mA g-1, respectively. When the current densities are slowly returned to 100 mA g-1 from 2000 mA g-1,
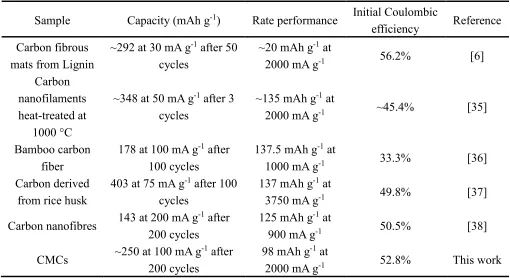
[image:8.596.67.533.183.368.2]the reversible capacity also can reach that of its initial state, suggesting that the CMC electrode has a superior rate and capacity recovery capabilities. Moreover, the comparisons of the electrochemical performances of other carbon materials reported in the literatures with the CMC electrode presented in this work was demonstrated in the Table 1.
Figure 4. Rate performance of the CMC electrode.
Table 1. Comparisons of the electrochemical performances of other carbon materials reported in the literatures with the CMC electrode presented in this work.
Sample Capacity (mAh g-1) Rate performance Initial Coulombic
efficiency Reference Carbon fibrous
mats from Lignin
~292 at 30 mA g-1 after 50
cycles
~20 mAh g-1 at
2000 mA g-1 56.2% [6]
Carbon nanofilaments heat-treated at
1000 °C
~348 at 50 mA g-1 after 3
cycles
~135 mAh g-1 at
2000 mA g-1 ~45.4% [35]
Bamboo carbon fiber
178 at 100 mA g-1 after
100 cycles
137.5 mAh g-1 at
1000 mA g-1 33.3% [36]
Carbon derived from rice husk
403 at 75 mA g-1 after 100
cycles
137 mAh g-1 at
3750 mA g-1 49.8% [37]
Carbon nanofibres 143 at 200 mA g
-1 after
200 cycles
125 mAh g-1 at
900 mA g-1 50.5% [38]
CMCs ~250 at 100 mA g
-1 after
200 cycles
98 mAh g-1 at
2000 mA g-1 52.8% This work
0 10 20 30 40 50 60 70 80
0 100 200 300 400 500 100 mA g -1 500 mA g -1 1000 mA g -1 2000 mA g -1 Charge Capacity Discharge Capacity
[image:8.596.43.553.453.731.2][image:9.596.136.461.106.291.2]
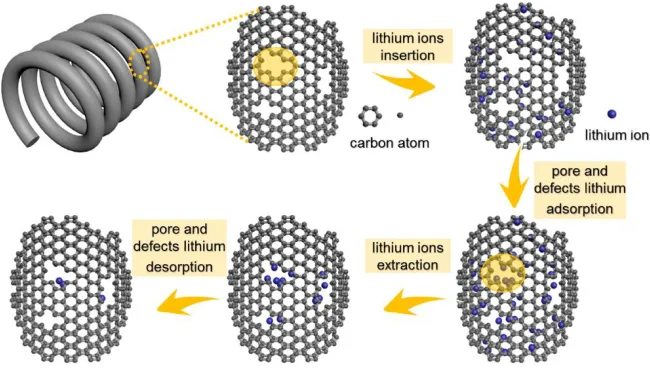
3.3 Mesopore lithium-storage mechanism
Figure 5. Schematic diagram of the mesopore lithium-storage mechanism in CMC electrode
As discussed in the charge-discharge results, the CMC electrode has a large irreversible capacity during the initial ion insertion and extraction processes, and the initial charge capacity is lower than that of the other cycles, a mesopore lithium-storage mechanism in the CMC electrode has been proposed to explain these phenomena, as shown in Fig. 5. According to the XRD, Raman and BET analysis, it can be concluded that the CMC materials contain graphite crystallites and amorphous carbon, and there are a certain number of mesopores and defects in the amorphous carbon. When the potential is reduced to less than 1.3 V for the first discharge process (lithium-ion insertion process), lithium ions begin to insert into the graphite crystallites firstly, and a graphite intercalation compounds (GICs) of LiCx (x≥6) are
formed [39, 40]. Then, additional lithium ions adsorb onto the edges or centers of the mesopores, resulting in the formation of lithium molecules or lithium clusters Lix (6≥x≥2) [39]. Hence, the initial
discharge capacity can exceed the theoretical capacity of graphite.
[image:10.596.58.536.112.449.2]
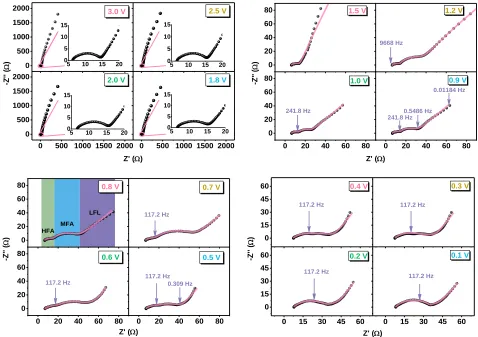
3.4 Electrochemical impedance spectroscopy characterization
Figure 6. EIS characteristics of the CMC electrode at various potentials ranging from 3.0 to 0.1 V during the first lithium-ion insertion process.
Fig. 6 shows the typical EIS results of the CMC electrode at various potentials ranging from 3.0 to 0.1 V during the first lithium-ion insertion process. In the potential region from 3.0 to 1.8 V, the EIS features are similar. In other words, each EIS curve contains a small arc in the high-frequency region and an oblique line in the subsequent frequency region. According to our previous EIS study using graphite electrodes as the anodes in Li-ion batteries, the high-frequency arc can be attributed to the contact impedance, caused by contact problems between the active materials, electrolyte and the current collector [32, 41]. When the potential is decreased to 1.2 V, another arc appears in the middle-frequency region, and the entire EIS curve of the CMC electrode consists of three sections, namely, two arcs with different radii and a sloping line. During the potentials from 1.2 to 0.5 V, no noticeable changes in the impedance spectra can be found except for the radius variations of the two arcs. Normally, the high-frequency arc observed at potentials below 1.2 V can be assigned to not only the contact impedance but also the resistances caused by the formation of the SEI film and the transportation of lithium ions through the SEI film. The middle-frequency arc can be attributed to the charge transfer process at the interface between the electrolyte and electrode, and the steep sloping line can be attributed to the ion diffusion process [32, 41-43]. It can be seen that the radius of the second arc has been reducing with the decreasing
5 10 15 20 0
5 10 15
5 10 15 20 0
5 10 15
5 10 15 20 0
5 10 15
5 10 15 20 0 5 10 15 0 500 1000 1500
2000 3.0 V 2.5 V
0 500 1000 1500 2000
0 500 1000 1500
2000 2.0 V
-Z''
(
)
Z' ()
0 500 1000 1500 2000
1.8 V
0 20 40 60
80 1.5 V
9668 Hz
1.2 V
0 20 40 60 80
0 20 40 60 80 241.8 Hz 241.8 Hz 1.0 V -Z'' ( )
Z' ()
0 20 40 60 80
0.01184 Hz 0.9 V 0.5486 Hz 0 20 40 60
80 0.8 V
LFL
MFA HFA
0.7 V
0 20 40 60 80
0 20 40 60 80 117.2 Hz 117.2 Hz 0.6 V -Z'' ( )
Z' ()
0 20 40 60 80
0.309 Hz 0.5 V 117.2 Hz 0 15 30 45 60 117.2 Hz 0.4 V 117.2 Hz 0.3 V
0 15 30 45 60
0 15 30 45 60 117.2 Hz 0.2 V -Z'' ( )
Z' ()
0 15 30 45 60
117.2 Hz
of the potential, and when the potential is lower than 0.5 V, the two arcs begin to overlap with one another due to the approximately equal time constants of the two parts mentioned above [44].
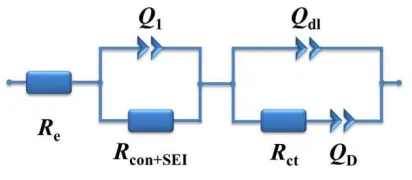
To analyse the electrochemical kinetic parameters of the CMC electrode in the first lithium ion insertion process, an equivalent circuit is proposed to simulate the impedance spectra at potentials lower than 1.5 V, which is shown in Fig. 7. In particular, Re is the electrolyte (solution) resistance, Rcon+SEI here
represents the contact resistance and the resistance caused by the ions travelling the SEI film, and Rct
usually stands for the charge transfer resistance. To better fit the experimental data better, we have chosen a constant phase element (CPE) to replace the capacitance, and the admittance response of the CPE can be written as [32, 41],
+
=
2 sin 2
cos 0
0
n jY n
Y
Y n n
[image:11.596.198.404.363.453.2]Here, ω represents the angular frequency, and CPE element can represent different circuit components when n has different values. Specifically, when n=0, CPE represents a resistor, and when n=1, CPE can be a capacitance. The simulated results for this equivalent circuit are shown in Fig. 6, which are indicated by solid lines. All the simulated results are consistent with the experimental data, which indicates that the proposed equivalent circuit is satisfactory.
Figure 7. Equivalent circuit proposed for analysis of the CMC electrode at potentials of less than 1.5 V.
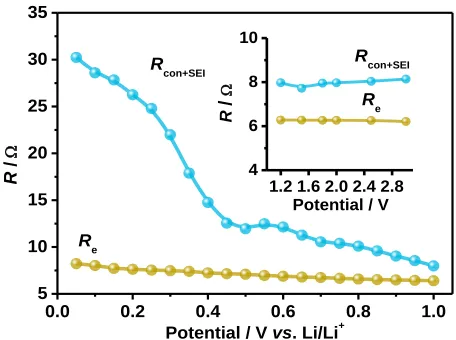
Variations in Re and Rcon+SEI simulated using the proposed equivalent circuit, with changes in the
electrode potential are displayed in Fig. 8. The electrolyte or solution resistance remains essentially constant over the entire potential range, with a value of approximately 6 Ohm, implying that the component and properties of the electrolyte do not change during the lithium-ion insertion process. On the other hand, the variation in Rcon+SEI comprises three stages. In stage I, namely, the potential range
from 3.0-1.5 V, Rcon+SEI decreases slightly as the potential decreases. Because there is no SEI film
formation in this potential range, the slight decrease can be attributed to a better contact between the electrode and electrolyte owing to the process of electrolyte crossing the separator and the infiltration of electrolyte. When the potential decreases from 1.5 to 0.5 V, that is, in stage II, Rcon+SEI rises linearly with
a small slope, which can be ascribed to the formation and increase in the thickness of the SEI film [45]. A rapid increase in Rcon+SEI occurs in the region from 0.5 to 0.05 V, and the value increases from 11.95
to 30.24 Ω. Considering that the main lithium-ion insertion process occurs below 0.4 V according to the above lithium-storage mechanism analysis, the large increase in Rcon+SEI can be attributed to the cracking
0.0 0.2 0.4 0.6 0.8 1.0 5
10 15 20 25 30 35
1.2 1.6 2.0 2.4 2.8 4
6 8 10
Re Rcon+SEI
R
/
Potential / V vs. Li/Li+ Rcon+SEI
Re
R
/
[image:12.596.174.402.91.261.2]Potential / V
Figure 8. Variations in Re and Rcon+SEI with changes in the electrode potential
4. CONCLUSIONS
In summary, coiled spring-like carbon micro-coils have been successfully prepared through a chemical vapor deposition method using Ni as the catalyst. The obtained CMCs have the typical characteristics of a hard carbon structure according to the XRD and Raman analyses. In addition, CMCs possess a 3D spiral morphology with a screw diameter of approximately 10 μm, and the individual coils have a solid structure. CMCs with a distinctive morphology, a modest BET surface and an abundance of mesopores display remarkable electrochemical properties, including a stable cycling performance and favourable rate capability. EIS is used to further investigate the electrochemical kinetic parameters of the CMC electrode during the first lithium-ion insertion process, and a mesoporous lithium storage mechanism is proposed to explain the irreversible capacity of the first cycle. All the research results not only support the application of CMCs with unique morphology, but also indicate that the coiled spring-like carbon micro-coils are an ideal candidate material for use in anodes for lithium-ion batteries.
ACKNOWLEDGEMENT
This work was supported by the National Natural Science Foundation of China (Grant No. 21606158) and the Natural Science Foundation of Shanxi Province (Grant No. 2015021131).
References
1. B. Scrosati, J. Garche, J. Power Sources, 195 (2010) 2419. 2. M. Winter, Chem. Rev., 104 (2004) 4245.
3. J.M. Tarascon, M. Armand, Nature, 414 (2001) 359. 4. M.R. Palacin, Chem. Soc. Rev. 38 (2009) 2565.
5. V. Subramanian, H. Zhu, B. Wei, J. Phys. Chem. B, 110 (2006) 7178.
6. S.-X. Wang, L. Yang, L.P. Stubbs, X. Li, C. He, ACS Appl. Mater. Interfaces, 5 (2013) 12275. 7. S. Xin, Y.-G. Guo, L.-J. Wan, Acc. Chem. Res., 45 (2012) 1759.
9. M.F.L. De Volder, S.H. Tawfick, R.H. Baughman, A.J. Hart, Science, 339 (2013) 535. 10.J.C. Ye, S. Charnvanichborikarn, M.A. Worsley, S.O. Kucheyev, B.C. Wood, Y.M. Wang,
Carbon, 85 (2015) 269.
11.Q. Huang, S. Wang, Y. Zhang, B. Yu, L. Hou, G. Su, S. Ma, J. Zou, H. Huang, J. Phys. Chem. C, 120 (2016) 3139.
12.L. Chen, Z. Wang, C. He, N. Zhao, C. Shi, E. Liu, J. Li, ACS Appl. Mater. Interfaces, 5 (2013) 9537.
13.S.-X. Wang, L. Yang, L.P. Stubbs, X. Li, C. He, ACS Appl. Mater. Interfaces, 5 (2013) 12275. 14.Y. Kato, N. Adachi, T. Okuda, T. Yoshida, S. Motojima, T. Tsuda, Jpn. J. Appl. Phys., 42 (2003)
5035.
15.K. Yoshimura, K. Nakano, T. Miyake, Y. Hishikawa, S. Motojima, Carbon, 44 (2006) 2833. 16.F. Wu, J. Du, C. Liu, L. Li, H. Cheng, New Carbon Mater., 19 (2004) 81.
17.M. Fujii, M. Matsui, S. Motojima, Y. Hishikawa, J. Cryst. Growth, 237-239 (2002) 1937. 18.X. Chen, S. Motojima, H. Iwanaga, J. Cryst. Growth, 237-239 (2002) 1931.
19.S. Motojima, X. Chen, Bull. Chem. Soc. Jpn., 80 (2007) 449.
20.S. Motojima, X. Chen, S. Yang, M. Hasegawa, Diam. Relat. Mater., 13 (2004) 1989. 21.T. Wang, Y. Zhu, Z. Xing, G. Tang, H. Fan, Electrochim. Acta, 151 (2015) 134.
22.L. Tao, Y. Huang, X. Yang, Y. Zheng, C. Liu, M. Di, Z. Zheng, RSC Adv., 8 (2018) 7102. 23.V.G. Pol, M.M. Thackeray, Energy Environ. Sci., 4 (2011) 1904.
24.G. Xu, J. Han, B. Ding, P. Nie, J. Pan, H. Dou, H. Li, X. Zhang, Green Chem., 17 (2015) 1668. 25.P. Bai, Y. He, X. Zou, X. Zhao, P. Xiong, Y. Xu, Adv. Energy Mater., (2018) 1703217.
26.S.-D. Xu, Y. Zhao, S. Liu, X. Ren, L. Chen, W. Shi, X. Wang, D. Zhang, J. Mater. Sci., 53 (2018) 12334.
27.C. Wang, J. Huang, H. Qi, L. Cao, Z. Xu, Y. Cheng, X. Zhao, J. Li, J. Power Sources, 358 (2017) 85.
28.T. Zhang, J. Mao, X. Liu, M. Xuan, K. Bi, X.L. Zhang, J. Hu, J. Fan, S. Chen, G. Shao, RSC Adv., 7 (2017) 41504.
29.N. Wang, Y. Wang, X. Xu, T. Liao,Y. Du, Z. Bai, S. Dou, ACS Appl. Mater. Interfaces, 10 (2018) 9353.
30.M. Kruk, M. Jaroniec, Chem. Mater., 13 (2001) 3169.
31.A. Naji, J. Ghanbaja, B. Humbert, P. Willmann, D. Billaud, J. Power Sources, 63 (1996) 33. 32.S.-D. Xu, Q.-C. Zhuang, J. Wang, Y.-Q. Xu, Y.-B. Zhu, Int. J. Electrochem. Sci., 8 (2013) 8058. 33.Z. Guo, C. Wang, M. Chen, M. Li, Int. J. Electrochem. Sci., 8 (2013) 2702.
34.J. Wang, J.-L. Liu, Y.-G. Wang, C.-X. Wang, Y.-Y. Xia, Electrochim. Acta, 74 (2012) 1. 35.H. Habazaki, M. Kiriu, H. Konno, Electrochem. Commun., 8 (2006) 1275.
36.Q. Han, Z. Yi, F. Wang, Y. Wu, L. Wang, J. Alloy Compd., 709 (2017) 227. 37.L. Wang, Z. Schnepp, M.M. Titirici, J. Mater. Chem. A, 1 (2013) 5269.
38.P.S. Kumar, R. Sahay, V. Aravindan, J. Sundaramurthy, W.C. Ling, V. Thavasi, S.G. Mhaisalkar, S. Madhavi, S. Ramakrishna, J. Phys. D: Appl. Phys., 45 (2012) 265302.
39.Y.-P. Wu, C.-R. Wan, C.-Y. Jiang, S.-B. Fang, Y.-Y. Jiang, Carbon, 37 (1999) 1901. 40.N. A. Kaskhedikar, J. Maier, Adv. Mater., 21 (2009) 2664.
41.S.-D. Xu, Q.-C. Zhuang, L.-L. Tian, Y.-P. Qin, L. Fang, S.-G. Sun, J. Phys. Chem. C, 115 (2011) 9210.
42.B. Markovsky, M. D. Levi, D. Aurbach, Electrochim. Acta, 43 (1998) 2287. 43.D. Aurbach, J. Power Sources, 89 (2000) 206.
45.C. Wang, I, Kakwan, A.J. Appleby, F.E. Little, J. Electroanal. Chem., 489 (2000) 55. 46.C. Wang, A. J. Appleby, F. E. Little, J. Electroanal. Chem., 497 (2001) 33.