White Rose Research Online URL for this paper:
http://eprints.whiterose.ac.uk/96762/
Version: Accepted Version
Article:
Demars, C.A., Breed, G.A., Potts, J. et al. (1 more author) (2016) Spatial patterning of prey
at reproduction to reduce predation risk: what drives dispersion from groups? American
Naturalist, 187 (5). pp. 678-687. ISSN 1537-5323
https://doi.org/10.1086/685856
[email protected]
https://eprints.whiterose.ac.uk/
Reuse
Unless indicated otherwise, fulltext items are protected by copyright with all rights reserved. The copyright
exception in section 29 of the Copyright, Designs and Patents Act 1988 allows the making of a single copy
solely for the purpose of non-commercial research or private study within the limits of fair dealing. The
publisher or other rights-holder may allow further reproduction and re-use of this version - refer to the White
Rose Research Online record for this item. Where records identify the publisher as the copyright holder,
users can verify any specific terms of use on the publisher’s website.
Takedown
If you consider content in White Rose Research Online to be in breach of UK law, please notify us by
Appendix E: Estimates of Long-term Offspring Survival from Simulations Tracking
Caribou-Wolf Encounters during the Calving Season
The following tables list the long-term offspring survival [LOS] values (mean and
standard error [SE] of the number of surviving neonate calves per female per generation)
calculated from simulations evaluating the search time, group detectability and multiple kills
hypotheses as well as their combined effects. We ran 250 simulations for each group size or
scenario tested and each simulation started with 300 caribou calves and 10 wolves.
Note that the calculated LOS rates listed are for comparative purposes only as they are
sensitive to the number of predators specified (see Appendix B) and therefore are not estimates
of actual offspring survival rates in the wild. Nevertheless, simulation outputs (e.g. ~30%
neonate survival for scenario 8; Table E1) are within the relatively wide range of values reported
[image:32.595.119.475.556.717.2]
for boreal caribou populations (e.g. 26-65%, Pinard et al. 2012; see also Thomas and Gray 2002).
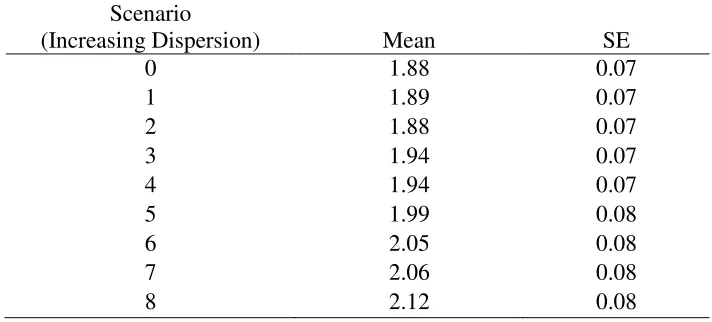
Table E1: The effect of individual dispersion (search time hypothesis) on the mean number of
surviving calves per female per generation (7 years) from simulations tracking caribou-wolf
encounters during the calving season. For these simulations, the detection radius of wolves was
1-km and one calf was killed per encounter.
Number of Surviving Calves Per Female
Scenario
(Increasing Dispersion)
Mean
SE
0
1.88
0.07
1
1.89
0.07
2
1.88
0.07
3
1.94
0.07
4
1.94
0.07
5
1.99
0.08
6
2.05
0.08
7
2.06
0.08
[image:33.595.148.447.185.406.2]
Table E2: The effect of group size (search time hypothesis) on the mean number of surviving
calves per female per generation (7 years) from simulations tracking caribou-wolf encounters
during the calving season. For these simulations, the detection radius of wolves was 1-km
regardless of group size and one calf was killed per encounter.
Number of Surviving Calves Per Female
Group Size
Mean
SE
1
2.14
0.08
2
3.06
0.08
3
3.81
0.08
4
4.28
0.08
5
4.76
0.08
6
5.04
0.07
7
5.31
0.07
8
5.54
0.07
9
5.74
0.06
10
5.80
0.06
11
5.94
0.06
12
5.97
0.06
[image:34.595.141.453.200.418.2]
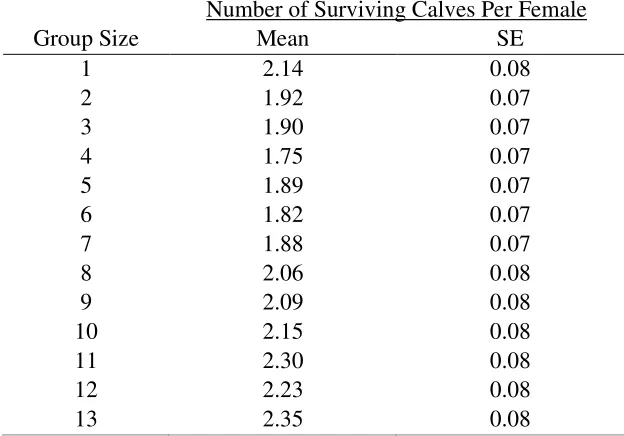
Table E3: The effect of differential detectability by group size (group detectability hypothesis)
on the mean number of surviving calves per female per generation (7 years) from simulations
tracking caribou-wolf encounters during the calving season. For these simulations, the detection
radius of wolves varied as the square root of caribou group size and one calf was killed per
encounter.
Number of Surviving Calves Per Female
Group Size
Mean
SE
1
2.14
0.08
2
1.92
0.07
3
1.90
0.07
4
1.75
0.07
5
1.89
0.07
6
1.82
0.07
7
1.88
0.07
8
2.06
0.08
9
2.09
0.08
10
2.15
0.08
11
2.30
0.08
12
2.23
0.08
[image:35.595.111.485.191.431.2]
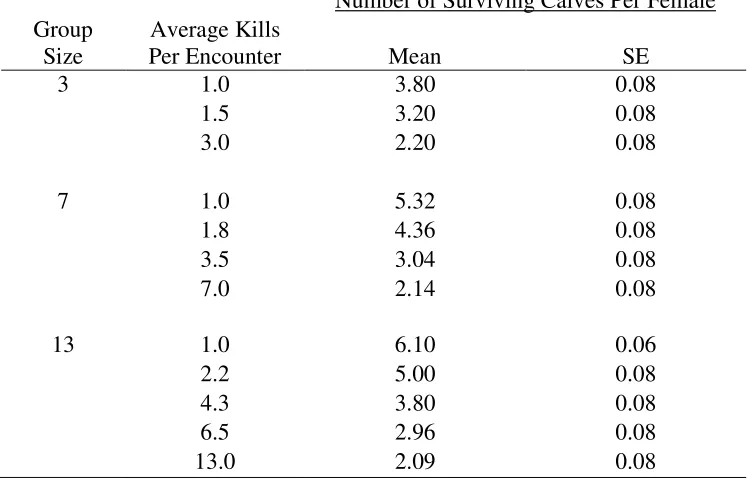
Table E4: The effect of multiple kills per encounter (multiple kills hypothesis) on the mean
number of surviving calves per female per generation (7 years) from simulations tracking
caribou-wolf encounters during the calving season. Group sizes of three, seven and thirteen were
evaluated.
Number of Surviving Calves Per Female
Group
Size
Average Kills
Per Encounter
Mean
SE
3
1.0
3.80
0.08
1.5
3.20
0.08
3.0
2.20
0.08
7
1.0
5.32
0.08
1.8
4.36
0.08
3.5
3.04
0.08
7.0
2.14
0.08
13
1.0
6.10
0.06
2.2
5.00
0.08
4.3
3.80
0.08
6.5
2.96
0.08
[image:36.595.140.457.197.419.2]
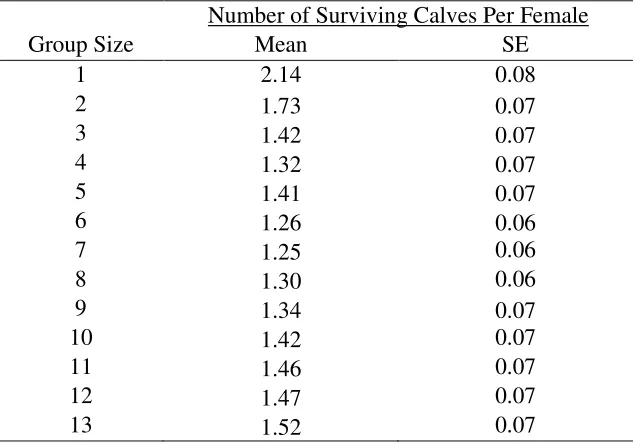
Table E5: The combined effects of differential group detectability (group detectability
hypothesis) and multiple kills per encounter (multiple kills hypothesis) on the mean number of
surviving calves per female per generation (7 years) from simulations tracking caribou-wolf
encounters during the calving season. In these simulations, the number of kills per encounter
averaged 1.5 for group sizes
≥
2.
Number of Surviving Calves Per Female
Group Size
Mean
SE
1
2.14
0.08
2
1.73
0.07
3
1.42
0.07
4
1.32
0.07
5
1.41
0.07
6
1.26
0.06
7
1.25
0.06
8
1.30
0.06
9
1.34
0.07
10
1.42
0.07
11
1.46
0.07
12
1.47
0.07
[image:37.595.138.458.185.406.2]
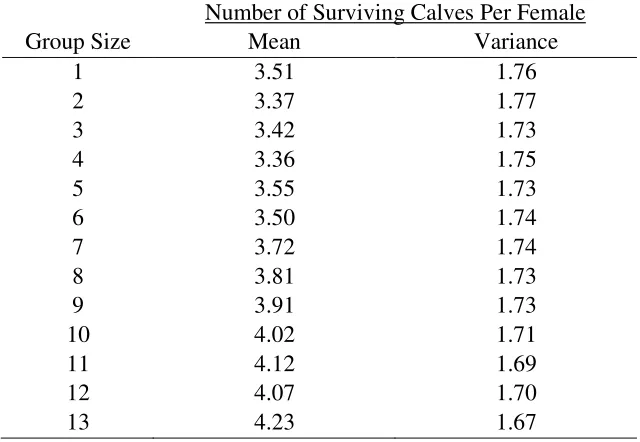
Table E6: The combined effects of differential group detectability (group detectability
hypothesis) and a kill success rate of 50% on the mean number of surviving calves per female
per generation (7 years) from simulations tracking caribou-wolf encounters during the calving
season.
Number of Surviving Calves Per Female
Group Size
Mean
Variance
1
3.51
1.76
2
3.37
1.77
3
3.42
1.73
4
3.36
1.75
5
3.55
1.73
6
3.50
1.74
7
3.72
1.74
8
3.81
1.73
9
3.91
1.73
10
4.02
1.71
11
4.12
1.69
12
4.07
1.70
13
4.23
1.67
Literature Cited:
Pinard, V., C. Dussault, J-P. Ouellet, D. Fortin and R. Courtois. 2012. Calving rate, calf survival
rate, and habitat selection of forest-dwelling caribou in a highly managed landscape. The
Journal of Wildlife Management 76: 189-199.