University of Southern Queensland
Faculty of Health, Engineering & Sciences
Mansell Power Lifter Actuator Failure Analysis
A dissertation submitted by
Donald Bailey
in fulfilment of the requirements of
ENG4112 Research Project
towards the degree of
Bachelor of Engineering (Honours) (Computer Engineering),
Bachelor of Information Technology
Abstract
The Mansell Power Lifter is a critical component of the Mansell Infant Retrieval System. It functions as an electrically powered stretcher which can be raised or lowered through the use of two independant DC-motor driven linear actuators. The Mansell Infant Re-trieval System is a key piece of medical equipment used widely to transport critically ill infants. Over a number of years there have been reports of the linear actuators used in the Mansell Power Lifter failing unexpectedly. Due to the high reliability requirements of the Mansell Power Lifter as a medical device any failures are unacceptable, and as a result the manufacturer of the Mansell Power lifter has sought to identify the cause of the failures. The aim of this project was to attempt to identify the mechanism and cause of the actuator failures and if possible propose a potential solution.
University of Southern Queensland Faculty of Health, Engineering & Sciences
ENG4111/2 Research Project
Limitations of Use
The Council of the University of Southern Queensland, its Faculty of Health, Engineering & Sciences, and the staff of the University of Southern Queensland, do not accept any responsibility for the truth, accuracy or completeness of material contained within or associated with this dissertation.
Persons using all or any part of this material do so at their own risk, and not at the risk of the Council of the University of Southern Queensland, its Faculty of Health, Engineering & Sciences or the staff of the University of Southern Queensland.
This dissertation reports an educational exercise and has no purpose or validity beyond this exercise. The sole purpose of the course pair entitled “Research Project” is to con-tribute to the overall education within the student’s chosen degree program. This doc-ument, the associated hardware, software, drawings, and other material set out in the associated appendices should not be used for any other purpose: if they are so used, it is entirely at the risk of the user.
Dean
Certification of Dissertation
I certify that the ideas, designs and experimental work, results, analyses and conclusions set out in this dissertation are entirely my own effort, except where otherwise indicated and acknowledged.
I further certify that the work is original and has not been previously submitted for assessment in any other course or institution, except where specifically stated.
Donald Bailey
Acknowledgments
I would like to thank my supervisors Dr John Leis and Dr John Grant-Thomson for their support and guidance throughout this project. Your advice has been invaluable in ensur-ing the success of this project.
I would also like to thank Wenross Holdings Pty. Ltd. for allowing this project to be conducted on the Mansell Infant Retrieval System and providing the resources and support required to make it happen. My thanks also goes to Paul Priebbenow and An-thony Vadalma at Wenross Holdings Pty. Ltd. for their continued advice and assistance throughout the project.
Finally, I would like to thank my family for their support throughout the course of un-dertaking this project and assistance with proof reading tasks.
Contents
Abstract i
Acknowledgments iv
List of Figures xii
List of Tables xv
Chapter 1 Introduction 1
1.1 Background . . . 1
1.2 Project Motivation, Aims, and Objectives . . . 3
1.3 Project Methodology and Timeline . . . 3
1.3.1 Analysis of Current Situation . . . 4
1.3.2 Data Collection . . . 4
1.3.3 Data Analysis . . . 5
1.3.4 Solution Proposal . . . 5
1.4 Project Safety . . . 6
CONTENTS vii
Chapter 2 System Analysis and Design Requirements 7
2.1 Chapter Overview . . . 7
2.2 System Overview . . . 7
2.2.1 Mansell Infant Retrieval System . . . 7
2.2.2 Mansell Power Lifter . . . 8
2.3 Known Actuator Failure Information . . . 10
2.3.1 Reported Failure Symptoms . . . 11
2.3.2 Conclusions on Cause of Failures . . . 12
2.4 System Reliability . . . 13
2.4.1 Reliability Engineering . . . 13
2.4.2 Reliability Quantification . . . 14
2.4.3 Standards for Medical Equipment . . . 15
2.4.4 Electro-Mechanical Actuators . . . 17
2.5 Design Requirements . . . 18
2.6 Chapter Conclusion . . . 19
Chapter 3 Design Considerations 20 3.1 Chapter Overview . . . 20
3.2 Data Collection Methodology . . . 20
3.2.1 Stress Testing . . . 20
3.2.2 Data Logging . . . 22
CONTENTS viii
3.3 Hardware Design Considerations . . . 23
3.3.1 System Integration . . . 23
3.3.2 Power Supply Considerations . . . 24
3.3.3 Sensors and Data Acquisition . . . 25
3.3.4 Microcontroller Selection and Considerations . . . 27
3.3.5 Data Storage and Accessibility . . . 28
3.4 Software Design Considerations . . . 30
3.4.1 Software Reliability . . . 30
3.4.2 Program Structure . . . 31
3.5 Chapter Conclusion . . . 33
Chapter 4 Data Collection System Hardware Design 34 4.1 Chapter Overview . . . 34
4.2 Power Supply . . . 34
4.3 Sensors and Data Sources . . . 40
4.3.1 Voltage Sensing . . . 40
4.3.2 Current Sensing . . . 42
4.3.3 Temperature Sensing . . . 44
4.3.4 Real Time Clock . . . 45
4.4 Micro-SD Card Data Storage . . . 46
4.5 Arduino Nano . . . 48
CONTENTS ix
4.7 Chapter Conclusion . . . 56
Chapter 5 Data Collection System Software Design 57 5.1 Chapter Overview . . . 57
5.2 Program Structure . . . 57
5.3 Initialisation . . . 59
5.4 Finite State Machine Elements . . . 59
5.4.1 Overall System State Machine . . . 60
5.4.2 Front and Rear Actuator State Machines . . . 61
5.5 Measurement Timing Considerations . . . 63
5.5.1 Timers and Interrupts . . . 63
5.5.2 Data Storage Write Time . . . 65
5.6 Additional Functions . . . 65
5.6.1 ThereadVoltage(int) Function . . . 66
5.6.2 ThereadCurrent(int) Function . . . 66
5.6.3 ThereadTime() Function . . . 67
5.6.4 ThereadTemp() Function . . . 67
5.7 Chapter Conclusion . . . 67
Chapter 6 Data Analysis and Solution Proposal 68 6.1 Chapter Overview . . . 68
CONTENTS x
6.3 Data Collection Faults . . . 69
6.4 Data Analysis . . . 70
6.5 Results Discussion . . . 72
6.5.1 Mansell Power Lifter Usage . . . 72
6.5.2 Limit Switches . . . 79
6.5.3 Electrical Characteristics . . . 80
6.5.4 Temperature Factors . . . 81
6.5.5 Limitations of Data . . . 82
6.5.6 Suspected Causes . . . 82
6.6 Potential Solutions Proposal . . . 83
6.7 Chapter Conclusion . . . 84
Chapter 7 Conclusions and Further Work 85 7.1 Conclusions . . . 85
7.2 Further Work . . . 88
References 89 Appendix A Project Specification 93 Appendix B Circuit Schematics 95 B.1 Linak LA34 Internal Limit Switch Circuit Schematic . . . 95
CONTENTS xi
Appendix C Data Logger Software 99
C.1 TheField Device v1.5.1.inoSource Code . . . 99
Appendix D Data Analysis Software 112
D.1 TheAnalysis.mMATLAB Code . . . 112
Appendix E Additional Data 117
E.1 Additional Figures . . . 117
List of Figures
1.1 Mansell Infant Retrieval System . . . 2
2.1 Mansell Power Lifter . . . 9
2.2 Mansell Power Lifter electrical system block diagram . . . 10
2.3 Linak LA34 internal limit switch circuit board . . . 11
2.4 Weibull PDF . . . 16
2.5 Weibull hazard function . . . 16
3.1 Finite State Machine Statechart . . . 32
4.1 Data logger block diagram . . . 35
4.2 Data logger power supply capacitor reserve at 12V . . . 38
4.3 Data logger power supply capacitor reserve at 24V . . . 39
4.4 Data logger power supply schematic . . . 39
4.5 Data logger input voltage resistor divider network, division factor linearity testing . . . 42
4.6 Data logger input voltage resistor divider network schematic . . . 43
LIST OF FIGURES xiii
4.8 Maxim Integrated DS1631 temperature sensor module . . . 45
4.9 Maxim Integrated DS3231 real time clock module . . . 46
4.10 CATALEX MicroSD Card Adapter . . . 47
4.11 Arduino Nano . . . 48
4.12 Arduino Nano start up time with Arduino Nano bootloader . . . 51
4.13 Arduino Nano start up time with no bootloader . . . 52
4.14 Data logger attached to a Mansell Power Lifter . . . 53
4.15 Data logger final construction with lid removed . . . 55
4.16 Data logger final construction power supply, current sensors, and Arduino Nano . . . 55
5.1 Data logger software structure flowchart . . . 58
5.2 Data logger software “overall system” state diagram . . . 61
5.3 Data logger software front and rear actuator state diagrams . . . 64
5.4 Data logger micro-SD card write time . . . 66
6.1 Mansell Power Lifter data logger #1 usage timeline . . . 74
6.2 Mansell Power Lifter data logger #2 usage timeline . . . 75
6.3 Mansell Power Lifter combined usage histogram for both data loggers . . 76
6.4 Mansell Power Lifter combined operation duration histogram for both data loggers . . . 78
E.1 Combined timeline of operations per day for both data loggers . . . 118
LIST OF FIGURES xiv
List of Tables
3.1 List of parameters to be recorded by the data collection device . . . 33
4.1 ATMega328P and Arduino Nano microcontroller pin connections . . . 50
6.1 Mansell Power Lifter data logger #1 electrical operating characteristics for both 12V and 24V modes . . . 80
Chapter 1
Introduction
1.1
Background
The Mansell Power Lifter is one of the three primary components of the Mansell Infant Retrieval System, which allows infants in a critical condition to be transported in a variety of medical vehicles along with all of the required medical equipment for their care. The Mansell Infant Retrieval System was invented by Dr John Grant-Thomson in the year 2000 and is currently manufactured by Wenross Holdings Pty. Ltd. in Toowoomba. The system has seen great success in the industry and is currently in use across Australia and also in Norway and Sweden. The Mansell Infant Retrieval System consists of the Mansell Power Lifter, an electrically powered stretcher, which will be the focus of this project, the Mansell Neosled which is an integrated system for mounting and powering various pieces of medical equipment, and the Mansell Neocot, which is a temperature controlled humidi-crib in which the infant is transported (Grant-Thomson 2014). A picture of a complete Mansell Infant Retrieval System can be seen in Figure 1.1.
1.1 Background 2
Figure 1.1: An example of a complete Mansell Infant Retrieval System (Grant-Thomson 2014).
operated independently in order to facilitate loading into an ambulance, where one set of wheels must be retracted before the other in order to allow the system to slide into the vehicle (Grant-Thomson 2014).
1.2 Project Motivation, Aims, and Objectives 3
1.2
Project Motivation, Aims, and Objectives
The Mansell Infant Retrieval System is an essential tool used by many hospitals through-out Australia and overseas. The continued reliable operation of the system and all of its components, including the Mansell Power Lifter, is of utmost importance to ensure that the system can be relied upon to transport critically ill infants when required. In response to the reports of linear actuators in the Mansell Power Lifter failing, the aim of this project is to identify the root cause of the failures and propose a solution which can be implemented to ensure continued safe operation of the system. It is planned that the aims of the project will be met by working towards the following objectives:
• Design and construct an autonomous data collection device which integrates with the Mansell Power Lifter and can be deployed to an operational system in a hospital.
• Deploy one or more data collection devices to Mansell Power Lifters which are in regular use by Australian hospitals for one or more months.
• Perform stress testing of a test system at Wenross Holdings Pty. Ltd. in Toowoomba to identify conditions under which actuator failures may occur and the characteris-tics of such faults.
• Analyse the data obtained to identify the characteristics of actuator faults and determine the failure mechanism and cause.
• Using the information gathered propose a solution which could be implemented to prevent further actuator failures on systems in the field.
• If time and resources allow the proposed solution will be designed and an initial prototype built.
1.3
Project Methodology and Timeline
1.3 Project Methodology and Timeline 4
how they fit in to the project timeline are summarised in the following sections.
1.3.1 Analysis of Current Situation
In order to identify the cause of the linear actuator failures in the Mansell Power Lifter an understanding of how the system is used, and the conditions that it is used in, will need to be gained. It is also important to gain as much information as possible about the circumstances surrounding actuator failures and how the system behaves when a failure occurs. This component of the methodology will need to be completed first so that there is a good understanding of the problem before development and testing begins.
1.3.2 Data Collection
1.3 Project Methodology and Timeline 5
1.3.3 Data Analysis
Finally, the methodology for analysing the data gathered needs to be considered. Once the stress testing is complete and the data logger has been retrieved from the field, all data gathered will need to be analysed and compared in an attempt to determine the cause and characteristics of the actuator failures. Initially this analysis will be concerned with identifying portions of the data collected which correspond to a failure. Following this, the data relating to failure events can be analysed for potential clues to the failure cause. If it turns out that it is not possible to identify any failures from the data obtained by the data logger, it may be possible to identify operational characteristics from the data which are out of the norm and may point to a possible cause of the failures. This element of the project methodology will be conducted after the data collection process and will be an important step in determining what factors can be addressed to prevent the failures.
1.3.4 Solution Proposal
1.4 Project Safety 6
1.4
Project Safety
In order to ensure that all elements of this project are undertaken in a safe manner, both in terms of personal safety and the safety of any modifications made to the Mansell Power Lifter, a risk assessment has been undertaken. The full risk assessment for the project is listed in Appendix F.
1.5
Dissertation Overview
This dissertation is organised as follows:
Chapter 2 contains an analysis of the Mansell Power Lifter systems and explores the
design requirements of the data collection system.
Chapter 3 outlines the design considerations involved in the design of the data collection
system.
Chapter 4 outlines the design and development of the hardware aspects of the data
collection system.
Chapter 5 describes the design and development of the software aspects of the data
collection system.
Chapter 5 considers the analysis of the data obtained from the data loggers and contains
a discussion of the results. It also explores potential designs for a solution to the actuator failure problem.
Chapter 7 concludes the dissertation and suggests further work which could be
Chapter 2
System Analysis and Design
Requirements
2.1
Chapter Overview
This chapter will provide an overview of the design and operation of the Mansell Power Lifter and Mansell Infant Retrieval System as a whole. An analysis of the current in-formation known about the linear actuator failures will be conducted and the relevant literature pertaining to their failures reviewed. The analysis of the Mansell Power Lifter system design and actuator failure literature will enable the data collection system to be designed such as to maximise the usefulness of the data obtained. The objective of this chapter is to determine which operational and environmental parameters should be monitored by the data collection system in order to best diagnose the cause of the failures.
2.2
System Overview
2.2.1 Mansell Infant Retrieval System
2.2 System Overview 8
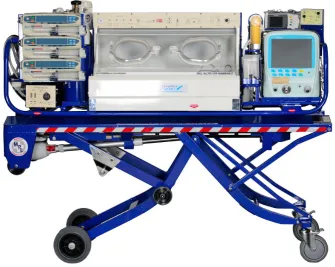
temperature controlled, capsule which keeps the infant being transported at the optimal temperature. The Neocot itself is mounted within the Mansell Neosled along with all of the medical equipment required by the medical staff. The Neosled is a customisable frame which allows for a wide range of medical equipment to be securely mounted in proximity to the patient in the Neocot. It also contains a battery based power supply system which can be used to power the Neosled and all of the other equipment in use. The third component of the Mansell Infant Retrieval System and the main focus of this project is the Mansell Power Lifter. The Mansell Power Lifter is a purpose built, elec-trically operated, adjustable height stretcher, which is designed to carry the Neosled and Neocot (Grant-Thomson 2014).
2.2.2 Mansell Power Lifter
The Mansell Power Lifter features two electrically powered linear actuators which allow the entire system to be raised from 270mm to 1000mm with zero operator effort. While a typical load is only about 60kg the Mansell Power Lifter is capable of lifting up to 200kg. The linear actuators can be operated independently allowing for different heights between the front and rear of the system. This is necessary in order to allow the system to be loaded into a road ambulance where the front of the system needs to be slid into the vehicle while the rear is still on the ground. The linear actuators in use in the Mansell Power Lifter are Linak LA34 units with a short variant being used to actuate the front end of the system and a long variant being used in the rear (Grant-Thomson 2014).
2.2 System Overview 9
Figure 2.1: The Mansell Power Lifter without the Mansell Neosled and Mansell Neocot at-tached (Grant-Thomson 2014).
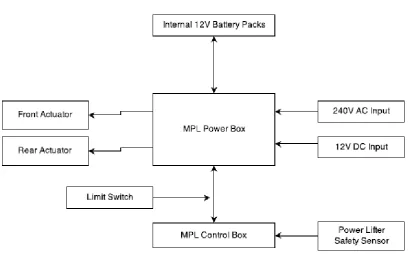
The Mansell Power Lifter comprises of several main components, the control box, power box, battery packs, and two linear actuators. A block diagram overview of the system can be seen in Figure 2.2. The control box consists of the individual operator controls for the actuators, a power on/off switch, and an array of status indicator lights. The control box also contains a safety sensor which will prevent the operation of the Mansell Power Lifter while it is locked into an ambulance or other medical vehicle (Keys 2014).
2.3 Known Actuator Failure Information 10
Figure 2.2: Block diagram overview of the Mansell Power Lifter electrical systems (Keys 2014).
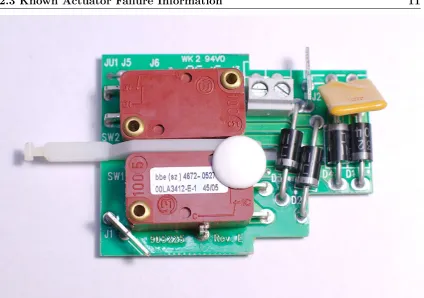
The actuators used in the Mansell Power Lifter are LA34 DC-motor driven linear ac-tuators from Linak. They are designed to be powered from either 12V or 24V and can provide 5500N of thrust in the push direction with a duty cycle of six minutes of oper-ation per hour. Internally the actuators feature a printed circuit board containing two limit switches and associated components. The limit switches are mounted in parallel on the circuit board facing each other with a plastic slide sitting between them. When the shaft of the actuator reaches its limit in either direction, a small lever connected to the plastic slide is forced forwards or backwards and causing it to push on the button of the corresponding limit switch, thus disconnecting the power from the DC motor (Grant-Thomson 2014). The Linak LA34 limit switch circuit board can be seen in Figure 2.3 and a reverse engineered circuit schematic for it can be seen in Appendix B.
2.3
Known Actuator Failure Information
2.3 Known Actuator Failure Information 11
Figure 2.3: The internal limit switch circuit board from a Linak LA34 linear actuator showing the limit switch mechanism. (Photo: author)
Power Lifter and review the analysis and conclusions made at the time. After reviewing the warranty records for the period of 2007 to 2016 it was found that nine linear actuator failures had been reported for the Mansell Power Lifter out of about 100 full systems currently in use. Though the average actuator failure rate of 0.5% per year is relatively low, it is possible that the actual number of failures may be higher. Wenross Holdings Pty. Ltd. suspects that the actual number of failures may be higher than reported by users, since purchasing records show that locations with high system usage have been purchasing on average a couple of spare actuators each year. It should be noted that in all cases of reported failures the linear actuators were replaced as a safety precaution, regardless of whether or not the fault could be replicated.
2.3.1 Reported Failure Symptoms
The end user reports of actuator failures can be summarised as follows:
2.3 Known Actuator Failure Information 12
remains fully operational.
• Linear actuator failures are not linked to a particular actuator. Both the long and short actuators have been reported as failing roughly the same number of times.
• In a number of cases, when the failure occurred the actuator would operate in one direction but not the other.
• In a number of cases the actuator failure occurred when it was at one of its limits and was attempted to be moved in the opposite direction.
• In some cases hitting the faulty linear actuator with a large object (a hammer) resulted in normal operation being restored. However, records show that even after doing this the failure can reoccur at a later time.
• In some cases the failed actuator would start working again and the fault could not be reproduced.
• In one case it was noted that the failure occurred on a hot day while outside for an extended period of time.
2.3.2 Conclusions on Cause of Failures
The conclusions reached at the time of diagnosis by Wenross Holdings Pty. Ltd. in regards to the actuator failures can be summarised as follows:
• In the majority of cases the failure mechanism was attributed to problems with the actuator’s internal limit switches. However, the exact failure causes recorded varied from limit switch damage to excessive lubrication of the limit switch mechanism. While this strongly points to the limit switches being the failure mechanism it is not clear what the actual cause of these failures may be.
• A number of recorded failures could not be replicated and the actuator was replaced as a safety precaution.
2.4 System Reliability 13
affected actuator with a hammer can sometimes resolve the problem, and that failures have been reported to happen when the actuators are at their limits, there is a strong case for the limit switches being the failure mechanism. If there was a problem with the limit switches in the actuators jamming, it makes sense that this is most likely to occur at the end of their stroke, when the limit switches are activated. It is also conceivable that hitting the actuator with a hammer could result in a jam condition being resolved through the vibration of the impact.
The potential conclusion of the limit switches in the actuators being the failure mecha-nism, is backed up by the fact that during testing of a spare development Mansell Power Lifter, for the purposes of this project, a similar limit switch jam was encountered. The limit switch jam which was encountered matched the characteristics reported in the war-ranty claims where the affected actuator would only move in one direction. It was also confirmed that upon disassembling the actuator and unjamming the limit switch, normal operation was returned. However, it was also observed that in this case the actuator was in the middle of its travel and not at one of the limits when the limit switch jam occurred. While there is considerable evidence that the internal limit switches in the linear actuators may be the failure mechanism, it is still unknown as to what the failure cause may be. In addition to this, there continue to be inconsistencies in the reported failure symptoms of the linear actuators and little is known about the operating conditions under which the failures occurred.
2.4
System Reliability
2.4.1 Reliability Engineering
2.4 System Reliability 14
In engineering terms, reliability can be generally accepted to mean the ability of a prod-uct or system to perform its required functions in an acceptable way over a certain time period. In addition to this both the designer and user of the system must concede that there will be certain operating conditions which must be met in order for the system to perform reliably. Finally, it must also be accepted that a system cannot be designed to work forever, and due to wear caused by normal use, will have an expected lifetime, only over which the reliability of the system should be a given. It should also be considered that excessive use, incorrect operating conditions, and a lack of maintenance may result in the actual lifetime being less than the expected lifetime (Kapur & Pecht 2014).
2.4.2 Reliability Quantification
It is often useful to quantify the reliability of a system or product via statistical means so as to determine the likelihood that one of those systems will fail. This information can then be used to review and determine whether or not changes need to be made to its design or construction to improve reliability. The most commonly used term in the statistical analysis of reliability is MTBF (Mean Time Between Failures) or MTTF (Mean Time To Failure). These terms are often used interchangeably, however the technical dif-ference between the two is that MTBF is used for products where after being repaired the product will then be in good-as-new condition, and therefore have a constant failure rate even after being repaired (Birolini 2010). In the case of the Mansell Power Lifter, since the situation of a failed actuator can be rectified simply by replacing the actuator with a new one before returning the system to normal use, Mean Time Between Failure is the more appropriate term.
2.4 System Reliability 15
production. As time progresses and certain systems are subject to excessive wear and age-ing the number of failures later in the product life-cycle will also increase (Birolini 2010).
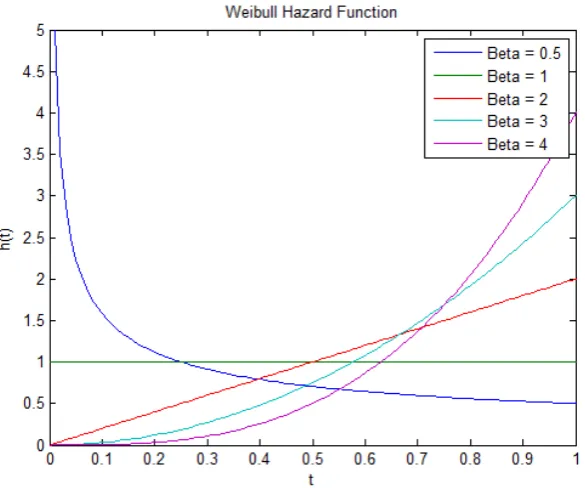
While the “Bathtub Curve” is a good visual representation of the way in which sys-tem failure rates change over time, a probability density function is required in order to determine the probability of a system or component failing at a particular time. While there are a range of probability density functions which could be used, the Weibull distri-bution is particularly suited to reliability engineering applications due to the fact that it can be used to model a variety of other distribution shapes by simply changing the value of its parameters. The Weibull probability density function can be seen in Equation 2.1 and graphically in Figure 2.4. When the hazard function (Equation 2.2) of the Weibull distribution is considered it can be seen thatβ <1 will represent the initial failure period from the “Bathtub Curve”, while β = 1 and β >1 respectively will represent the stable failure rate period and the end of life wear-out period. The Weibull hazard function can be seen in Figure 2.5 (Verma, Srividya & Karanki 2010).
f(t) = β α
t
α
β−1
e−(αt) β
, t >0 (2.1)
H(t) = βt
β−1
αβ (2.2)
2.4.3 Standards for Medical Equipment
2.4 System Reliability 16
[image:32.595.147.440.447.691.2]Figure 2.4: The Weibull PDF with a number of different β values representing its ability to form other PDF’s (Source: author).
2.4 System Reliability 17
supplemented by more specific standards relating to particular types of electrical medical equipment (International Electrotechnical Commission 2012).
IEC 60601-1 outlines that the basic safety and essential performance of a medical system are key factors which must exist in order for it to be considered reliable. Basic safety is defined as the system being designed in such a way that its normal operation does not harm the patient, and essential performance as the ability of the system to perform in such a way that it does not create a hazard for the patient (International Electrotechni-cal Commission 2012). In regards to the actuator failure scenario on the Mansell Power Lifter, it is the essential performance of the system which is being invalidated, since the inability to raise or lower the Mansell Power Lifter could result in delays or difficulties in transporting a critically ill infant, thus creating a hazard.
2.4.4 Electro-Mechanical Actuators
Electro-mechanical actuators, such as the Linak LA34 units used in the Mansell Power Lifter, are popular alternatives to traditional hydraulic actuators due to their ease of integration with electronic control systems and system power-to-weight benefits. How-ever, as with any complex system there are a number of failure modes that they may exhibit. These failure modes can be grouped into three categories, mechanical or struc-tural faults, motor faults, and electrical or electronic faults (Balaban, Bansal, Stoelting, Saxena, Goebel & Curran 2009).
Mechanical and structural faults can be considered to include problems with gear sys-tems and bearings, or structural component failures caused by excess load or wear and neglect. Motor faults include loss of performance or function due to improper operating conditions or excess load. They can manifest themselves as faults such as shorts, open circuits, or shaft eccentricities. Electrical and electronic faults include component fail-ures in power supply and control systems or wiring breakages and deterioration (Balaban et al. 2009).
2.5 Design Requirements 18
phases. While there is no evidence of physical damage it is possible that jams or internal structural failures falling into the mechanical and structural category could be contribut-ing to the issue. Motor faults such as open or short circuits will also need to be considered, and in the electrical and electronic category, it is possible that there are faults occurring in the limit switch electronics in the actuators themselves, or in fact with the control circuitry in the power box itself.
2.5
Design Requirements
While the recorded user reports of linear actuator failures on the Mansell Power Lifter point towards the internal limit switches as being the failure mechanism, even if this is the case it is still not clear what the failure cause is. It will therefore be necessary to perform an analysis of the operational characteristics of the linear actuators, preferably under normal operating conditions to take into account any usage factors which may contribute to the failure. The collection and analysis of this data will allow for a better understanding to be gained regarding the circumstances under which failures occur and their characteristics from a technical perspective.
Given that the reported linear actuator failures appear to occur rather infrequently, it may eventuate that it is not possible to capture data pertaining to a real actuator failure. In this case it may be necessary to analyse data from the normal usage of the Mansell Power Lifter, over a period of time, to identify any usage trends or component operation characteristics which may point towards component damage leading to failure. These findings could then be analysed to identify potential failure causes. Since the capture of real world usage data is required, and given the need to not hinder medical personnel in their use of the system, an autonomous data collection device will need to be developed to capture the desired parameters. The design considerations for this device will be con-sidered in the following chapter.
2.6 Chapter Conclusion 19
being operated outside of their specifications, resulting in wear, and actuator current and voltage will provide a means for determining if motor related faults are developing or if there is a problem with the actuator control system. In response to the past actuator failure information it will be beneficial to record the number of limit switch activations to assist in determining if they are indeed the failure cause, and also ambient temperature to establish if harsh thermal conditions are causing mechanical or electrical faults.
2.6
Chapter Conclusion
Chapter 3
Design Considerations
3.1
Chapter Overview
This chapter will discuss the design considerations which were taken into account during the design phase for the autonomous data collection device. The data collection method-ology to be used will be discussed and related to the design of the data collection device, any restrictions on its design due to the design and usage of the Mansell Power Lifter will be outlined, and alternative design options will be analysed.
3.2
Data Collection Methodology
3.2.1 Stress Testing
3.2 Data Collection Methodology 21
The extent of stress testing can be considered to fall into three general categories; stress screening (Chan & Englert 2001), accelerated degradation testing, and accelerated failure testing (McLinn 2016). Stress screening is essentially a form of quality control where all or a subset of the products produced are subjected to stress outside of their normal operating conditions after production in order to ensure that there are no manufacturing defects or weak components. This is intended to identify products with obvious issues and prevent them from entering service, in order to reduce the number of initial failures that are typically experienced. This corresponds to the first section of the “Bathtub curve”. However, the limitation of stress screening is that since it is performed on a large portion of the marketable products, the tests performed must not be severe enough to cause a deterioration in performance over the product’s rated life. Conversely though this means that there is a trade-off in the number of potentially defective items which are detected (Chan & Englert 2001).
Accelerated degradation and accelerated failure testing are in contrast much less mild. In both cases the goal is to induce a degradation of the product in order to identify de-sign inadequacies or component faults which do not manifest immediately under shorter test procedures. The primary difference between the two is that accelerated degradation testing aims to provide quicker results and shorter test durations by only looking for de-graded performance and then extrapolating to draw conclusions about the reliability of the product. In contrast, accelerated failure testing waits for an actual failure to occur before conclusions are drawn. Accelerated degradation and failure testing can also be used to estimate the expected life of a product (McLinn 2016).
3.2 Data Collection Methodology 22
3.2.2 Data Logging
Data logging is a useful tool for gathering in depth data on the operation of a system over a certain time period. While there are traditional measurement and data acquisition systems which operate in a laboratory style environment, and may be connected to a personal computer for direct access to data, such systems are not capable of easily gath-ering real world data from the operation of a system by its end users in the field, and are therefore only suitable for controlled or short term testing. Due to the limitations of such systems, an autonomous data logging device which stores data locally or transmits it though a communications channel to a remote server is more appropriate for gathering real world data in the field over long periods of time. However, due to their autonomous nature, a greater level of design effort is needed in order to ensure that autonomous data logging devices can perform the intended function and not hinder the use of the system under test in its normal fashion (Suzdalenko 2011).
Since an autonomous data logger is likely to be installed in a remote system for a period of time in order to gather data, there will be limited or no opportunities for the design or operation of the logger to be modified after deployment. It is therefore important that the design phase is thoroughly carried out and all of the design requirements are consid-ered. While the operation and functionality of a data logging device can vary significantly based on the specific application and requirements, all autonomous data logging systems will have four main components, a power source and supply circuitry, sensors to interface with the system under test, a processor to interface with the sensors and consolidate raw data, and a data storage or transmission medium (Suzdalenko et al. 2012).
3.2.3 Testing and Data Collection Plan
3.3 Hardware Design Considerations 23
obtained may not be indicative of real world units. Additionally, there is only a minimal amount of information known about the usage patterns of the Mansell Power Lifters in use in the field, and as a result it would be difficult to accurately replicate a real world usage scenario in the stress testing environment. Therefore, the best approach to data collection at this stage is likely to be through the application of the data logger system to Mansell Power Lifters in use in the field, with stress testing used as a supplement where it is deemed necessary to test particular circumstances.
3.3
Hardware Design Considerations
Before the development of the data collection system can begin there are a number of hardware design considerations to be explored in order to ensure that the data logger meets the design requirements. These are as follows.
3.3.1 System Integration
Since the Mansell Power Lifter is part of a medical system, it is important that the safety and usability of the system is not affected in any way as a result of the field testing. Attaching a data collection device to the Mansell Power Lifter which interferes with its normal operation could result in life threatening consequences for the patient. In order to prevent such a situation from occurring it will be important to design the data logger in such a way that even if it was to fail, there would be little or no impact on the normal operation of the Mansell Power Lifter. It is planned that this requirement will be achieved through two design approaches.
3.3 Hardware Design Considerations 24
very short period of time. It is hoped that by taking these design approaches into account the data logger will be safe enough to be confidently used on a Mansell Power Lifter being used to transport actual patients.
3.3.2 Power Supply Considerations
Very few real world data logging devices have the luxury of access to a continuously avail-able mains power source. Therefore, much thought needs to be put into the design of the power supply and the overall power consumption of the device to ensure that it is capable of operating in the desired application. Often this will involve the use of a battery to allow for completely autonomous operation and may be augmented by infrequent access to external power for charging or some form of renewable energy such as solar power. As a result of this limited power capacity, it is important to ensure that the power consump-tion of the data logger is minimised (Suzdalenko 2011).
Since the proposed data logger for the Mansell Power Lifter only needs to be powered when the linear actuators are being operated, it is possible that the data logger could be powered from the linear actuator power cables themselves, thus eliminating the need for a primary battery contained within the data logger or a direct connection to the Mansell Power Lifter main batteries. This will be possible, and will not have an impact on the op-eration or performance of the actuators, since the current consumed by the data logger is likely to be in the order of tens of milliamps (Suzdalenko 2011) compared to the multiple amps that the Linak LA34 actuators typically require (Linak 2015). The plan to power the data logger directly off of the Mansell Power Lifter actuator power cables fits within the design approach of connecting data logger components in parallel, since power can be tapped off each of the actuator power wires, and a fuse can be placed in series with the data logger to prevent short circuit conditions across the actuator power cables.
3.3 Hardware Design Considerations 25
the data logger power supply will need to contain voltage regulation in order to drop the operating voltage of the linear actuators, which could be either 12 or 24 volts depending on the operating conditions (Grant-Thomson 2014), and reduce it to the 5 or 3.3 volts required for the microcontroller and sensor systems.
3.3.3 Sensors and Data Acquisition
Sensors and data gathering circuits for data logging devices can be varied and will de-pend on the specific goals of the data logger which is being designed. Since the data logger for the Mansell Power Lifter is concerned with monitoring linear actuators con-taining DC motors, it can be assumed that the logger will at least contain voltage and current sensing circuitry in order to monitor the operational parameters of the motors (Suzdalenko et al. 2012). Voltage can usually be measured through the analogue to digital conversion functionality of modern microcontrollers with external resistor divider networks in order to translate the voltage being measured into the correct range for the converter (Holoubek 2013). Current can be measured through several techniques includ-ing measurinclud-ing the voltage across a series resistor, current transformers, and Hall Effect devices. However, all of these techniques still require an analogue-to-digital voltage con-version to be performed, either in the current sensor module itself or via a microcontroller (Yarborough 2015).
While there are several different methods for measuring current it should be noted that different current sensing techniques have different levels of invasiveness on the circuit in question. For current measurement through a series resistor, the very act of measuring the current requires that the current being measured flow through a resistor, causing a voltage drop and therefore power dissipation. This may not be an appropriate technique if the resulting voltage drop could affect the operation of the system. Additionally, if very high currents are being measured then very low resistance values will be required in or-der to minimise the voltage drop and power dissipation in the resistor (Yarborough 2015).
cur-3.3 Hardware Design Considerations 26
rent flows through a wire. By coupling this magnetic field into the detection circuit it is possible to detect the current flow. Current transformers achieve a voltage output by passing the current generated by the magnetic field in a secondary coil through a resistor. Hall Effect devices on the other hand use the difference between a local magnetic field and the perpendicular magnetic field created by the current in the wire to generate a voltage, this is known as the Hall Effect. Hall Effect devices have the advantage over current transformers of consuming less power due to not dissipating power in a resistor (Yarborough 2015).
Either a current transformer or Hall Effect current sensor circuit would be suitable for implementation in the data logger for the Mansell Power Lifter due to their non-invasive current sensing ability, which lines up with the design objective of minimising direct in-terference with system circuitry. However, a Hall Effect sensor has been chosen over a current transformer for this application, since analysis of the available sensor modules showed that Hall Effect sensors were more readily available in small integrated packages, which will help to keep the overall size of the data logger down. Specifically, a current sensor module containing the ASC712-30A current sensor integrated circuit from Allegro MicroSystems LLC was chosen to be used in the data logger. It has a current measure-ment range of±30A (Allegro Microsystems LLC 2012) which should be sufficient for the maximum current through the actuators of approximately 25A when the system is fully loaded (Keys 2014), and can withstand any motor current transients generated thanks to a transient tolerance of 100A for 100ms (Allegro Microsystems LLC 2012).
While the voltage and current measurement will make up the main sensor components required, it will also be necessary to have some form of temperature sensor to assist in determining if the temperature of the actuators is contributing to the failures, as theorised in one of the actuator failure occurrences. Ideally, temperature measurement would be performed by placing a temperature sensor on a point of interest on the actuator, such as the motor or internal circuit board. However, since it is a design objective that the data logger be as non-invasive to the Mansell Power Lifter as possible, and should be easily removed if problems are experienced, placing a temperature sensor inside the actuators will not be feasible.
3.3 Hardware Design Considerations 27
the ambient temperature could be used to identify any trends which could be contributing to the actuator failures. In particular a DS1631 integrated temperature sensor with I2C communications interface was chosen to be used. A number of DS1631’s are already in use in the Mansell Neocot and are therefore readily available and known to work reliably.
3.3.4 Microcontroller Selection and Considerations
The next component that needs to be considered is the system processor. The system processor is responsible for the task of retrieving the data measured by the various sensors, performing any calculations that are required to get the data into a usable state, and then recording the data to a storage medium or transmitting it to a remote server. The re-quirements for a system processor can vary greatly based on the rere-quirements of the data logger, however the most important considerations are the number of sensor inputs (gen-erally analogue to digital channels), the variety and number of supported communications protocols, power consumption, and the ease of implementation (Suzdalenko et al. 2012).
While there are a large number of low power microcontroller processors on the mar-ket which contain numerous analogue inputs and various communications protocols, one important consideration which can set them apart is the ease of implementation. The ease of implementation can be considered both in terms of physical hardware implementation and software development. The hardware implementation of a microcontroller is usually not as simple as just purchasing a single integrated circuit chip. Most microcontrollers on the market today will require a number of external components in order to properly function, such as crystal oscillator clock circuits, low voltage power supply circuitry, and programming interfaces. These additional requirements will need to be considered when choosing a microcontroller platform.
3.3 Hardware Design Considerations 28
an integrated microcontroller solution with all of the required external components on board and are available in various sizes. They also come with an integrated software development environment based on the C/C++ languages (Arduino 2016a) with a large number of libraries available for accelerated software development (Smith & Miller 2013).
In order to ensure that the data logger is able to spend sufficient time in the field to collect a useable data set, it is important to prevent the development process from taking too long. If a microcontroller solution can be obtained which does not require extensive hardware development in order to be implemented it will be possible to reduce the amount of development time required. While there are many other microcontroller products on the market, very few of them can offer small sized development boards which are ready to use out of the box, while at the same time providing free and easy access to a large range of software libraries.
Due to the ease of development, both in terms of hardware and software, and the fact that a number of communication software libraries will be required to interface with the planned hardware, it was decided to use an Arduino Nano as the microcontroller platform for the data logger. The Arduino Nano features the Atmel ATMega328P microcontroller running at 16MHz with 14 digital I/O pins, 8 analogue inputs, 32KB or flash memory, 2KB of RAM, and 1KB or EEPROM. The Arduino Nano board contains all of the re-quired microcontroller support circuitry and a USB interface for programming all within a small 45mm by 18mm form factor (Arduino 2016a). This small size will assist in keeping the overall size of the data logger low.
3.3.5 Data Storage and Accessibility
3.3 Hardware Design Considerations 29
Power Lifter, immediate retrieval of data is not of critical importance and will not be pursued due to the additional cost and complexity involved.
The alternative to remote data transmission is to store data locally in the data logging device. However, depending on the period over which the data logger is expected to be autonomous, and the frequency and quantity of data sampling, the required storage space may be very large. Also, since typical microcontrollers suitable for this application only have up to several kilo-bytes of on board non-volatile memory, an external data storage solution will be necessary (Suzdalenko et al. 2012).
Secure Digital or SD cards are one such, flash memory based, data storage solution which is popular for use in data logging devices. These memory cards are widely available and are typically used in digital cameras among other things. SD cards have the advantages of small physical size with standard and micro form factors, large data capacities of tens to low hundreds of gigabytes, are widely available, and use the Serial Peripheral Interface (SPI) bus for data communications (Ibrahim 2010). The SPI bus is available on the ma-jority of microcontroller platforms including the Atmel ATMega328P used in the Arduino Nano (Arduino 2016a). SD cards can also be easily connected to a personal computer to extract data files located on them (Ibrahim 2010).
For data logging applications, values recorded to file-based flash memory such as SD cards are typically written in Comma Separated Value (CSV) format where each data field is separated by a comma character. This format is widely used and allows for data to be quickly imported into software such as Microsoft Excel or MATLAB for analysis (Suzdalenko et al. 2012). In order to keep the overall size of the data logger small it was decided that a micro-SD card and associated microcontroller interface hardware would be used to record data from the various sensors.
3.4 Software Design Considerations 30
microcontroller, where they can be easily accessed and updated as necessary.
3.4
Software Design Considerations
In addition to the hardware design considerations, there will also be a number of software design considerations to be made. These are outlined as follows.
3.4.1 Software Reliability
Real-time systems are often thought of as computer controlled systems which must re-spond immediately to ensure the safety of the process that they are controlling. However, Laplante (2004) defines a real-time system as a system which must be able to perform not only the correct operation but also execute it within a timely manner, such that the system specification is not breached. Real-time systems may be further classified as soft, firm, or hard depending on the consequences and severity of a failure to meet the time requirements. Soft real-time systems have minimal consequences for failure and hard real-time systems have catastrophic consequences for failure (Laplante 2004).
In the case of the Mansell Power Lifter data logger, there are several reasons for con-sidering it to be a real-time system. Firstly, it is important for the reliability of the data obtained that sensor and time measurements are performed and processed at reg-ular intervals. For example, in order to record an accurate representation of the system parameters at a particular point in time it is important that all sensor readings be per-formed within the shortest timeframe possible.
3.4 Software Design Considerations 31
out any remaining data to the micro-SD card immediately to prevent data loss.
Since the failure of the data logger to meet its time requirements will at worst result in a partial loss of sensor data, and not have any impact on the operation of the Mansell Power Lifter, it can be considered to be a soft real-time system. While a failure to perform within the necessary time requirements would not result in a critical failure for either the data logger or the Mansell Power Lifter, it will be important to design the software of the data logger in such a way that the risk of a time related failure occurring is minimal. This can be achieved through careful specification analysis and software structure design along with the potential application of real-time system design techniques. In addition to the real-time system reliability requirements it will be necessary to perform an appropriate amount of in depth testing of the data logger software to ensure that there are no errors in its operation.
3.4.2 Program Structure
As with many embedded system designs the Mansell Power Lifter data logger software will take the form of a finite state machine. Finite State Machines are systems which can be thought of as operating in one of a number of defined execution states at any particular time. The system will have an initial starting state and one or more potential terminal states. Additionally, for each state there will be particular events which will trigger a transition to a different state of operation (Laplante 2004).
3.4 Software Design Considerations 32
Figure 3.1: An example of a Finite State Machine statechart showing nested states and state transitions (Laplante 2004).
M ={S, i, T,Σ, δ} (3.1)
M ={S, i, T,Σ,Γ, δ} (3.2)
One of the advantages of thinking about the software design of a system as a Finite State Machine is that statecharts can be used to easily represent the operation of the system and its movement between various operating states. Statecharts can also be used to represent common software design features such as nesting and multi-tasking. An example of a Finite State Machine statechart showing state nesting can be seen in Figure 3.1 (Laplante 2004).
3.5 Chapter Conclusion 33
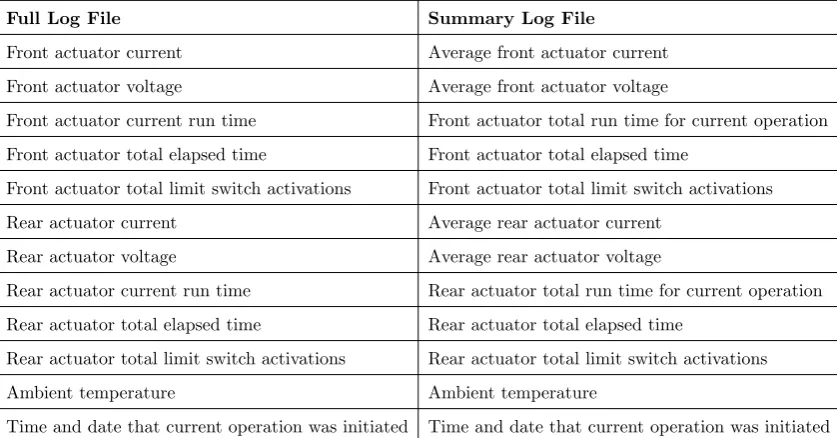
Table 3.1: List of parameters to be recorded by the data collection device.
Full Log File Summary Log File
Front actuator current Average front actuator current
Front actuator voltage Average front actuator voltage
Front actuator current run time Front actuator total run time for current operation
Front actuator total elapsed time Front actuator total elapsed time
Front actuator total limit switch activations Front actuator total limit switch activations
Rear actuator current Average rear actuator current
Rear actuator voltage Average rear actuator voltage
Rear actuator current run time Rear actuator total run time for current operation
Rear actuator total elapsed time Rear actuator total elapsed time
Rear actuator total limit switch activations Rear actuator total limit switch activations
Ambient temperature Ambient temperature
Time and date that current operation was initiated Time and date that current operation was initiated
3.5
Chapter Conclusion
This chapter has discussed the design requirements for the construction of a data col-lection system for the Mansell Power Lifter which will take the form of an autonomous data logging device. Specifically, a number of hardware considerations relating to data collection, processing, and storage were covered as well as the necessary implementation considerations relating to these functions. The relevant design concepts for the software side of the data logger were also considered.
Chapter 4
Data Collection System Hardware
Design
4.1
Chapter Overview
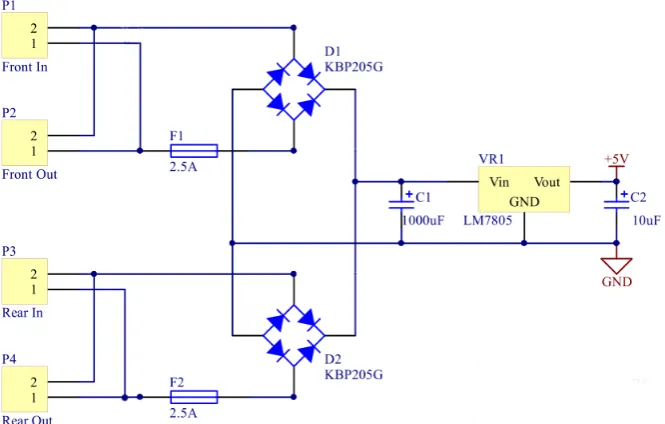
This chapter will discuss the design and development of the hardware aspects of the data collection system. The design considerations explored in the previous chapter will be applied to the final design of each of the aspects of the device. Each of the four main data logger component categories will be covered, power supply, sensors and data sources, the microcontroller, and data storage, as well as a discussion on the physical construction of the data logger. A block diagram of the data logger hardware can be seen in Figure 4.1 and a full circuit schematic can be seen in Appendix B. The software design of the microcontroller Arduino code will be discussed in Chapter 5.
4.2
Power Supply
4.2 Power Supply 35
Figure 4.1: Block diagram of the Mansell Power Lifter data logger showing major system components and connections. (Source: author)
since the linear actuators are directly driven by the Mansell Power Lifter power box, the voltage on the actuator power cables could be either polarity depending on the direction the actuators are being driven (Keys 2014). Finally, since it is desired that the data logger monitor the operation of both of the linear actuators it will be necessary to obtain power from either or both of the linear actuator’s power cables depending on whether the front actuator, rear actuator, or both actuators are running. It will therefore be necessary for a power supply to be designed which can meet these requirements.
4.2 Power Supply 36
the mains AC circuitry of a number of old battery chargers which were no longer in use. While these rectifiers are significantly over-rated for this application with mains voltage tolerance and a maximum current of 2A (Taiwan Semiconductor n.d.) they were readily available and have a compact size which will assist in keeping the footprint of the power supply small. While there will be a small voltage drop across the diodes in the bridge rectifier this should not have any effect on the operation of the power supply since the input voltage is significantly higher than the required output voltage.
In order to allow for the data logger to be powered from either the front or rear linear actuator power cables or both, depending on how the Mansell Power Lifter is being oper-ated, it was decided that two of the full-wave bridge rectifiers chosen would be connected to each of the actuator power cables and their outputs would be connected together. If one actuator was running but not the other, then it would not be possible for power to flow back into the non-powered actuator cables, due to the diodes in the bridge rectifier being reverse-biased. Additionally, there would be no risk of different voltages being ap-plied to each of the actuator power cables, and therefore producing a short circuit, since when the Mansell Power Lifter power box switches between 12V and 24V mode it switches both actuators simultaneously. To provide additional protection for the Mansell Power Lifter against faults in the data logger power supply, fuses were placed in series with each input to the power supply. If a short circuit condition within the power supply were to occur the corresponding fuse would blow and ensure that the actuators could continue to function normally.
The final power supply design requirement to be considered is the need to reduce the 12V or 24V supplied to the linear actuators down to the 5V which is required for the Arduino Nano and the various sensor modules. There are two common voltage regulation techniques used to reduce high supply voltages down to low digital logic voltages, linear regulators and switching regulators. The operation of these voltage regulation circuits will not be discussed here in detail. Linear voltage regulator circuits require very few components but can dissipate a large amount of power (PLoss = (VIN−VOU T)×I) and
4.2 Power Supply 37
linear voltage regulator in the power supply.
Specifically the LM7805 was chosen due to its wide availabilty and wide input voltage range of up to 35V (Fairchild Semiconductor 2014b). Aside from the main voltage regu-lator integrated circuit, a linear voltage reguregu-lator also requires a bypass capacitor across both the input and output (Zhang 2013). Typical values of these capacitors are 0.33µF for the input and 0.1µF for the output (Fairchild Semiconductor 2014b). However, it was identified that for the application of the data logger it would be necessary for the Arduino Nano microcontroller to remain powered on for a short time after the power was removed from the linear actuator power cables. This is necessary in order to ensure that any remaining data can be written to the micro-SD card successfully before the data logger turns off. Since the additional run time was only likely to be very short it was determined that this requirement could be achieved by increasing the values of the input and output capacitors on the voltage regulator.
While both the input and output capacitors were increased in size it was determined that increasing the size of the output capacitor significantly would not be appropriate since this would result in a significantly increased voltage rise time at power on. Instead it was decided to significantly increase the size of the input capacitor since the higher 12V or 24V applied to it would minimise the effects of the capacitor charge time at power on. An additional advantage of increasing the size of the input capacitor instead of the output capacitor is that voltage regulation will be retained for a significant time period instead of the immediate voltage drop initiation which would result from only increasing the output capacitor size.
4.2 Power Supply 38
Figure 4.2: Mansell Power Lifter data logger power supply test for performing power-off operations with 12V input voltage. (Photo: author)
To perform this test, channel one of the oscilloscope was connected to the actuator power cables to measure the input voltage and channel two was connected to digital pin four of the Arduino. The ground wires for both channels were connected to the data logger’s circuit ground. The oscilloscope was set to trigger on the falling edge of channel one when the power was disconnected. Screen captures of the oscilloscope while performing these tests can be seen in Figures 4.2 and 4.3 for 12V and 24V input voltage respectively. It can be seen that in both scenarios the Arduino Nano is able to complete its power-off tasks before the input voltage drops sufficiently low that it can no longer operate. After test-ing with various capacitor values for the voltage regulator input and output capacitors, it was determined that an input capacitor of 1000µF and an output capacitor of 10µF would be appropriate and provide enough power for the Arduino to perform its power-off operations.
4.2 Power Supply 39
[image:55.595.132.465.497.709.2]Figure 4.3: Mansell Power Lifter data logger power supply test for performing power-off operations with 24V input voltage. (Photo: author)
4.3 Sensors and Data Sources 40
4.3
Sensors and Data Sources
4.3.1 Voltage Sensing
Since the operating voltage of the actuators has been identified as an important parame-ter for the data logger to measure, it will be necessary to implement some form of voltage sensing. While the ATMega328P in the Arduino Nano has ten analogue voltage inputs it will not be possible to measure the voltage on the linear actuator cables directly since they are operating at a much higher voltage than the 5V used by the microcontroller. Not only would the ATMega328P not be able to measure voltages this high it would likely be severely damaged. It was decided that the high voltages on the linear actuator power cables could be converted to an appropriate voltage level for the microcontroller by implementing a resistor divider network. This technique is commonly used to scale down large voltages to a readable level, with the value read by the analogue-to-digital converter being scaled up in software using the calculated ratio of the resistor divider network (Holoubek 2013).
However, the resistor divider network is not the only consideration which needs to be made in the case of the data logger. Since the polarity of the voltage on the actuator cables could be reversed depending on which direction it is being driven, simply connect-ing a resistor divider network to the actuator cables will only work when the voltage is in a certain polarity. If the actuator is driven in one direction the voltage will be able to be measured, but if it is driven the opposite direction the resistor divider will be con-nected to ground. One way around this problem would be to implement four resistor divider networks, one for each actuator power cable wire for both actuators. However, this would require twice the number of microcontroller inputs and twice as many resistors.
4.3 Sensors and Data Sources 41
Instruments 2013). These two diodes are placed before the first resistor in the resistor divider network and will result in a small voltage drop which must be accounted for in order to obtain accurate voltage measurement. The half-wave bridge rectifier was imple-mented using standard 1N4004 diodes since they were readily available.
The resistor values of the resistor divider network were calculated based on a maximum possible actuator cable voltage of 25V representing a full scale 5V input to the microcon-troller analogue-to-digital converter. A reduction in voltage from 25V to 5V represents a division ratio of 5 for the resistor divider network. In order to prevent excessive current from being wasted in the resistor divider networks it was decided to keep the overall impedance at around 1MΩ. Thus in order to obtain a voltage division ratio of 5 it was decided to use a 1MΩ resistor followed by two 100KΩ resistors in series. The input to the microcontroller analogue-to-digital converter was taken from the point between the 1MΩ resistor and the two 100KΩ resistors.
While the resistor divider network designed would have approximately a uniform divi-sion factor of 5, the effects of the half-wave bridge rectifier diodes placed in series need to be considered. The 1N4004 is specified to have a 0.6V forward voltage drop at 10mA (Fairchild Semiconductor 2014a), though given the very high impedance of the resistor divider network the actual current is likely to be much less. Additionally, since diodes are non-linear in their forward voltage behaviour, as their forward current changes it is likely that the voltage across the diode will be variable depending on the input voltage. In order to test the linearity of the voltage dividers with the rectifier diodes, various input voltages were fed into the data logger power supply, and the output of the resistor divider was measured and recorded. The results were imported into MATLAB and both a first and second order polynomial fit was performed and compared to the original data. A graph showing the results of the test can be seen in Figure 4.5.
4.3 Sensors and Data Sources 42
Figure 4.5: Mansell Power Lifter data logger input voltage resistor divider network division factor linearity testing. (Source: author)
divider network gain and use it as a constant across the entire voltage input range, it was decided that it would not be computationally unreasonable to implement the second order polynomial, in order to achieve the most accurate voltage measurement results. The results from the polynomial fit performed in MATLAB showed that the coefficients of the division factor polynomial would be as shown in Equation 4.1.
VIN = 0.1155VM easured2 −0.8175VM easured+ 7.6267 (4.1)
The final schematic for one of the data logger voltage sensing circuits can be seen in Figure 4.6 and the full schematic for the entire data logger can be seen in Appendix B.
4.3.2 Current Sensing
4.3 Sensors and Data Sources 43
Figure 4.6: Mansell Power Lifter data logger input voltage resistor divider network schematic. (Source: author)
Figure 4.7: An Allegro ACS712-30A Hall Effect current sensor module as used in the data logger. (Photo: author)
100ms (Allegro Microsystems LLC 2012). One additional benefit of using the ACS712-30A is that it is available from a number of sources as a low cost pre-made module on a printed circuit board, with screw terminals for easily connecting to the current source being measured. This will reduce the development time required to implement the ACS712-30A significantly since it is only available as a surface mount component which would otherwise require a custom printed circuit board to be manufactured. A picture of the ACS712-30A current sensor module can be seen in Figure 4.7.
4.3 Sensors and Data Sources 44
same direction at the same time the output of their corresponding ACS712-30A current sensors should be of the same polarity to ensure that the results can be interpreted cor-rectly. The output of each ACS712-30A current sensor will be an analogue voltage from 0V to 5V corresponding to a current range of -30A to +30A with 0A being represented by 12VCC or approximately 2.5V (Allegro Microsystems LLC 2012). Each ACS712-30A
voltage output will be connected to an analogue-to-digital converter input on the Arduino Nano’s ATMega328P.
4.3.3 Temperature Sensing
As discussed in the design considerations in Chapter 3 the Mansell Power Lifter data logger will feature a single temperature sensor located within the data logger itself to monitor the ambient temperature that the system is operating in. The DS1631 temper-ature sensor from Maxim Integrated was chosen over a simpler thermistor tempertemper-ature sensing arrangement due to the higher precision and reliability of an integrated solution straight out of the box. The DS1631 has a measurement range of -55◦C to 125◦C with an accuracy of±0.5◦C from 0◦C to 70◦C. It has a configurable conversion resolution of 9 to 12 bits and communication is performed over the I2C bus. Since the temperature conver-sion time for the DS1631 increases as the number of bits of resolution increases (Maxim Integrated 2015a) it was decided to use the lowest resolution of 9 bits to ensure that the ambient temperature could begin being logged as soon as possible after the data logger was powered on. With 9 bits of resolution the maximum