A RANDOMIZED CLINICAL TRIAL COMPARING THE EFFECTS
OF THREE DIFFERENT CHOLECALCIFEROL
SUPPLEMENTATION PROTOCOLS ON SERUM 25 HYDROXY
VITAMIN D LEVEL IN ASYMPTOMATIC VITAMIN D DEFICIENT
CHILDREN
THESIS
SUBMITTED IN THE PARTIAL FULFILLMENT OF THE REQUIREMENTS
FOR THE DEGREE OF M.D. PEDIATRICS
OF
CHRISTIAN MEDICAL COLLEGE VELLORE
CERTIFICATE
This is to certify that the dissertation entitled
“A RANDOMIZED
CLINICAL TRIAL COMPARING THE EFFECTS OF THREE
DIFFERENT CHOLECALCIFEROL SUPPLEMENTATION
PROTOCOLS ON SERUM 25 HYDROXY VITAMIN D
LEVEL IN ASYMPTOMATIC VITAMIN D DEFICIENT
CHILDREN”
is
the
bonafide
original
work
done
by
Dr. PRAGATHESH. P
in partial fulfillment of the requirements for
the M.D. Pediatrics examination of The Tamil Nadu Dr.M.G.R.
Medical university to be held in April 2013. The work done in
association with this thesis has been done by the candidate himself
and is genuine.
GUIDE
Dr. ANNA SIMON
Professor and Head,
Department of Paediatrics,
Christian Medical College, Vellore.
CHRISTIAN MEDICAL COLLEGE VELLORE
CERTIFICATE
This is to certify that the dissertation entitled
“A RANDOMIZED
CLINICAL TRIAL COMPARING THE EFFECTS OF THREE
DIFFERENT CHOLECALCIFEROL SUPPLEMENTATION
PROTOCOLS ON SERUM 25 HYDROXY VITAMIN D
LEVEL IN ASYMPTOMATIC VITAMIN D DEFICIENT
CHILDREN”
is
the
bonafide
original
work
done
by
Dr. PRAGATHESH.P
in partial fulfillment of the requirements for
the M.D. Pediatrics examination of The Tamil Nadu Dr.M.G.R.
Medical university to be held in April 2013. The work done in
association with this thesis has been done by the candidate himself
and is genuine.
Dr. ANNA SIMON
Professor and Head
,
Department of Paediatrics,
ACKNOWLEDGEMENT
My first and foremost gratitude to God for His abundant grace that sustained
me throughout and has blessed the works of my hands.
I am extremely grateful to
Dr.Anna Simon, Professor and Head of the
Pediatrics Department
, Christian Medical College, Vellore, for her
encouragement and guidance in this project from its very beginning to the end.
I am immensely thankful to
Dr.Leena Priyambada, Assistant Professor,
Department of Pediatrics,
Christian Medical College, Vellore, for her
patience, support and guidance.
I am also extremely grateful to
Dr. B. Antonisamy, Professor of the
Biostatistics Department ,
Christian Medical College, Vellore, for helping me
in the analysis of my study.
I thank the registrars and staffs in the pediatric department, for their effort in
recruiting children for my study.
CONTENTS PAGE NO
1. INTRODUCTION 01
2. AIMS AND OBJECTIVES 11
3. LITERATURE REVIEW 13
4. MATERIALS AND METHODS 32
5. RESULTS 46
6. DISCUSSION 57
7. CONCLUSION 76
8. LIMITATIONS 78
9. ANNEXURE 80
1
INTRODUCTION
2
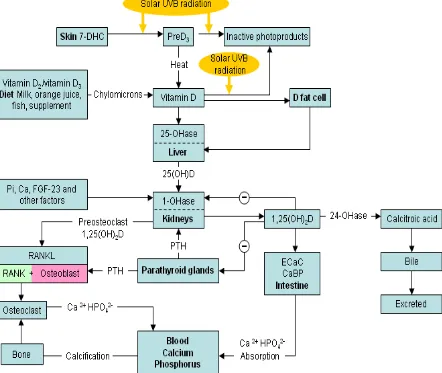
Vitamin D is a secosteroid and its role in musculoskeletal health is known for almost a century. In the past two decades there have been a lot of research to explore the influence of vitamin D on skeletal and extraskeletal health and its action at molecular level. Vitamin D deficiency is pandemic(1) and vitamin D deficiency has been attributed to play a significant role in autoimmune diseases, malignancy, ischemic heart disease etc.
METABOLISM (Fig 1):
3
4
Recent research over the past decade, shows that 1alpha hydroxylase, (mitochondrial CYP27B1 enzyme) is expressed in many extrarenal tissues like keratinocytes, hair follicles, epithelial cells, granulomas, parasympathetic ganglia, adrenal medulla, cerebellum, cerebral cortex, pancreas, placenta etc(3–5). This enzyme converts 25OHD to active vitamin D which has local autocrine and paracrine actions.
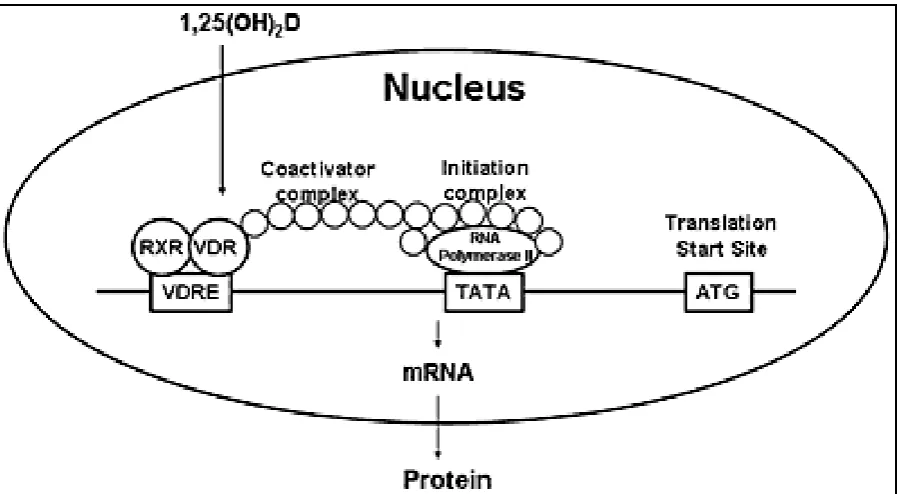
MOLECULAR ACTION (Fig 2):
5
6
FUNCTIONS OF VITAMIN D:
The various musculoskeletal and extraskeletal actions of Vitamin D are numerous (as follows) which makes prevention and treatment of this vitamin (now considered as a hormone) of utmost importance.
CALCIOTROPHIC ACTION:
7
1,25-dihydroxy vitamin D3 induces absorption of calcium and phosphorous from the small intestine, and in the kidneys promotes absorption of filtered calcium. Heaney et al(12) showed the differences in dietary calcium absorption with varying Se 25OHD levels, and concluded that to have optimum calcium absorption, Se 25OHD should be much higher than 30ng/ml. Though vitamin D has no direct action on osteoclasts, it favours the formation of osteoclast precursors and stimulates osteoblasts to synthesize factors that favour the differentiation of osteoclasts. Osteoclasts favour bone remodelling by resorption, thereby shifting calcium from the bone to the plasma and maintaining calcium homeostasis. Calcitonin decreases mobilization of calcium from the skeletal tissue by directly acting on osteoblasts and osteoclasts(7,10).
VITAMIN D AND HEALTH:
RICKETS:
8
bearing pattern, the deformity can vary. Posterior bowing of tibia and forearm deformities are commonly seen in infants, while genu varus is commonly seen in toddlers as they start to walk. Windswept deformity (valgus deformity of one leg and varus deformity of the other) may be seen in older children.
Radiological features of rickets are well appreciated at sites where rapid bone growth occur. These changes are well appreciated in the distal ulna and metaphyses adjacent to the knees(15). Widening of the physeal plate and loss of the provisional zone of calcification at the epiphyseal - metaphyseal interface are the early signs of rickets . In later stages, cupping, splaying, fraying and stippling may be seen. Other features are osteopenic long bones with thin cortices and delayed appearance of the epiphyseal centres. Spine changes include scoliosis, biconcave vertebral body, triradiate pelvis etc. Skull changes include basilar invagination, indistinct sutural margins, delayed tooth eruption etc.
VITAMIN D AND EXTRASKELETAL EFFECTS:
9
deficiency is more prevalent in diabetic patients(18). In a study done by Moreno at al , he showed vitamin D supplementation and regular sunlight exposure prevents type I DM(19). Al-Daghri et al showed improvement in metabolic syndrome with vitamin D supplementation(20).
Vitamin D plays a significant role in the innate and adaptive immunity through various mechanisms. Korf H et al showed vitamin D regulated the inflammatory and T cell stimulatory function of macrophages through IL-10 mediated mechanisms(21). Campbell et al showed that vitamin D mediated-autophagy plays a significant role in prevention of HIV infection(22). Grey et al showed the association of vitamin D deficiency with pulmonary tuberculosis(23).
Vitamin D modulates cellular proliferation and differentiation. Thus vitamin D deficiency plays a significant role in various malignancies like breast cancer(24), colon cancer(25), prostate cancer(26), cutaneous malignancies(27) etc.
10
11
12
To analyze the effect of vitamin D (cholecalciferol) supplementation on serum 25OHD level in asymptomatic Vitamin D deficient children: Comparison of three different vitamin D supplementation protocols.
i. Primary Outcome:
a. To compare the efficacy of three different vitamin D supplementation protocols in raising Se 25OHD levels.
ii. Secondary Outcomes:
a. To analyse the side effects of cholecalciferol supplementation, if any, in children.
13
14
Dr. Daniel Whistler and Professor Francis Glisson were the first to scientifically describe rickets in 17th century, although Hippocratus has described bony disease similar to rickets as early as 130 AD. In 18th century, cod liver oil was used to treat rickets and further research showed some vital substance in the cod liver oil responsible for the curative effect. Several research were done in 18th and 19th century, showed that diet has certain important factors especially in fat, which is required for bone growth. 7-dehydrocholesterol, the precursor of vitamin D was first described by Goldblatt and Soames in 1923, and proved that when this precursor is irradiated by sunlight, an active fat soluble vitamin is produced which helps in curing rickets. Similarly, Hess and Steenbock in 1924 named the substance in the skin activated by sunlight as “provitamin D”. The native vitamin D was first isolated by Professor A. Windaus in 1930, for which he received the Noble prize. Since then, there continues to be a lot of research being done worldwide to explore further metabolism of vitamin D, its action at molecular level and its role in diseases other than rickets.
SOURCES OF VITAMIN D:
15
The availability of vitamin D from unfortified food is negligible and very few. The food sources rich in vitamin D are cod liver oil(8000 – 30,000 units/100g), shark liver oil(4000 units/100g), liver and some fish(200-1200 units/100g). Availability of fortified foods in the developing countries are rare and as opposed to that of Western countries. Centre for Disease Control and Prevention(CDC) recommends regular supplementation of all breast fed infants because the amount of vitamin D in human milk is very less (approximately 25 units per litre)(30).
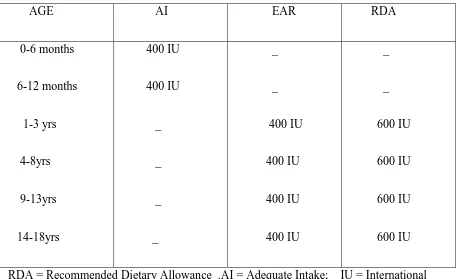
DIETARY REFERENCE INTAKE:
The Dietary Reference Intake (DRI) of vitamin D and calcium as recommended by The Food and Nutritional Board, the Institute of Medicine (The National Academy of Sciences) in 2011 has been summarized in the tables 1 and 2. The DRI is a common term to represent various reference values like Recommended Dietary Allowance(RDA), Adequate
Intake(AI), Estimated Average Requirement(EAR) and Tolerable Upper Intake level(UL). RDA: Average daily intake sufficient to meet the requirements of nearly all healthy people. AI: Level assumed to ensure adequacy of the nutrition, when evidence is not enough to develop RDA.
16
Table 1:DIETARY REFERENCE INTAKE(DRI) FOR VITAMIN D (IU/day)*: AGE AI EAR RDA 0-6 months 6-12 months 1-3 yrs 4-8yrs 9-13yrs 14-18yrs 400 IU 400 IU _ _ _ _ _ _ 400 IU 400 IU 400 IU 400 IU _ _ 600 IU 600 IU 600 IU 600 IU RDA = Recommended Dietary Allowance .AI = Adequate Intake; IU = International Unit; EAR = Estimated Average Requirement;
*Dietary Reference Intakes for Calcium and Vitamin D (2011), Food and nutrition board, Institute Of medicine, THE NATIONAL ACADEMY OF PRESS.
17
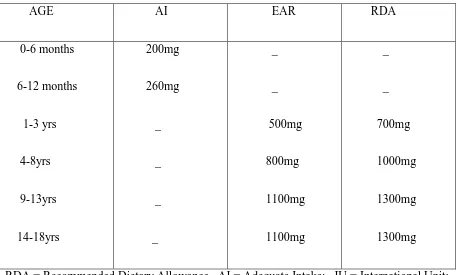
Table 2:DIETARY REFERENCE INTAKE(DRI) FOR CALCIUM (mg/day)*: AGE AI EAR RDA 0-6 months 6-12 months 1-3 yrs 4-8yrs 9-13yrs 14-18yrs 200mg 260mg _ _ _ _ _ _ 500mg 800mg 1100mg 1100mg _ _ 700mg 1000mg 1300mg 1300mg
RDA = Recommended Dietary Allowance . AI = Adequate Intake; IU = International Unit; EAR = Estimated Average Requirement;
*Dietary Reference Intakes for Calcium and Vitamin D (2011), Food and nutrition board, Institute Of medicine, THE NATIONAL ACADEMY OF PRESS.
18
FACTORS DETERMINING VITAMIN D STATUS:
In humans, 90% of vitamin D requirement is met through cutaneous synthesis and the rest from the diet(31). Even though India is a sunny country throughout the year, there is a high prevalence of vitamin D deficiency, the reasons being primarily cultural and lifestyle related, inappropriate timing and lesser duration of sunlight exposure, pollution, less
amount of body surface area exposed, skin pigmentation, sunscreen, and genetic factors(31). To maintain optimum cutaneous synthesis of vitamin D, 40% of the body surface area should be exposed to the sunlight between 10 A.M and 3P.M, when there is predominant UVB radiation(32).
Al Attia et al(33) showed that the dressing patterns significantly influence the vitamin D status. Matsuoka et al(34) showed that black wool clothes significantly attenuate UVB radiation compared to cotton clothes, thereby decreasing the cutaneous production of vitamin D. Norman et al(35) showed that cutaneous melanin is a natural sunscreen, which interferes with the peneteration of UVB rays into stratum basale where
7-dehydrocholesterol is abundant. Hollick et al(36) showed that Asian children require three times more the sun exposure compared to light skinned person.
19
showed that vitamin D deficiency is more prevelant in Korean adolescents during winter season(39), similary Lu HK et al also showed vitamin D deficiency is more prevalent during winter season in Chinese population(40). We recruited the participants by block randomization to avoid the bias due to seasonal variation.
Sunscreen with sun protection factor(SPF) of 8 decreases cutaneous production of
vitamin D by 95% and sunscreen with SPF of 15 decreases cutaneous synthesis by 98%(41). Hollick et al(42) showed that vitamin D deficiency is more prevalent above 37 degrees latitude especially in winter months because of decrease in the amount of UVB radiation. Agarwal et al(43) and Humayun et al(44) showed that vitamin D deficiency is more
common in people living in areas of high atmospheric pollution.
20
CAUSES OF VITAMIN D DEFICIECNY: 1.DECREASED VITAMIN D SYNTHESIS: A. Skin pigmentation
B. Physical agents blocking UVB exposure: clothing, shade, sunscreen, and chronic eczema.
C.Geography: Altitude, Latitude, season and atmospheric pollution 2.DECREASED NUTRITIONAL INTAKE OF VITAMIN D
3.FACTORS INTERFERING WITH VITAMIN D ABSORPTION/METABOLISM: A. Malabsorption syndromes.
B. Chronic liver disease C. Chronic renal disease
21
VITAMIN D DEFICIENCY:
[image:27.595.73.523.401.556.2]The criteria to define vitamin D deficiency has been changed from time to time. Institute of Medicine defined vitamin D deficiency as Se 25OHD less than 11ng/ml way back in 1997 (46), Since then it has been revised multiple times. Misra et al (31) considered Se 25OHD level below 15ng/ml as vitamin D deficiency and level between 15-20ng/ml as vitamin D insufficiency. The most widely accepted definition for vitamin D deficiency is Se.25OHD less than 20ng/ml(2,47,48). Craig et al(49) classified vitamin D deficiency into mild, moderate and severe based on se 25 OHD level(Table 3)
Table 3:Calssification of vitamin D deficiency based on Se 25OHD levels: VITAMIN D STATUS Se 25OHD level
Mild Vitamin D deficiency Moderate Vitamin D deficiency Severe Vitamin D deficiency
10-20 ng/ml (25-50nmol/L) 5-10 ng/ml (12.5-25nmol/L) <5 ng/ml (<12.5nmol/L)
22
Practice Guideline consider Se 25OHD level between 21-29ng/ml as Vitamin D insufficiency and <20 ng/ml as deficiency (47).
PREVALENCE
The prevalence of vitamin D deficiency vary from place to place. In a study done by Buyukinan et al(52) in 106 Turkey children, he found that 62% were vitamin D deficient and 34% were vitamin D insufficient. He also documented that vitamin D deficiency is more common in pubertal age group and there is strong correlation of insulin resistance with vitamin D deficiency.
Santos et al(53), studied the prevalence of vitamin D deficiency and genetic polymorphism of vitamin D receptor in girls living in South Brazil. Among 234 girls 36.3% had vitamin D deficiency and 54.3% had vitamin D insufficiency. He also found that VDR gene polymorphism(Apal, TaqI and BsmI variants of VDR gene) is associated with vitamin D deficiency.
Gordon et al(54) have done a cross sectional study to find the prevalence of vitamin D deficiency in infants and toddlers (population =365) and found that 12.1% had vitamin D deficiency and 40% had vitamin D insufficiency. Uush et al(55) have done a study in Mongolian children and found that 21.8% had vitamin D deficiency and 20% had vitamin D insufficiency.
Al-23
Othman et al(57) studied vitamin D status in 331 Saudi children and found that all the participants were vitamin D deficient.
Even the sunny Indian subcontinent is not spared, with all parts of the country documenting a high prevalence of vitamin D deficiency. Puri et al(58) studied the vitamin D status in 3,127 school girls from different socioeconomic strata in Delhi and found that only 11.5% had clinical vitamin D deficiency but asymptomatic (biochemical) hypovitaminosis D was seen in more than 90% (91.9% in upper socioeconomic group and 89.6% in lower socioeconomic group). of the study population.
Marwaha et al(59) studied vitamin D status in 5137 north Indian children and found that 85% of children in upper socioeconomic group had vitamin D deficiency, 92.6% of children in lower socioeconomic group had vitamin D deficiency and 10.8% had clinical evidence of vitamin D deficiency.
Harinarayanan et al(60) studied vitamin D status in Southern India (on adults) and showed that vitamin D deficiency is more prevalent in urban population compared to rural population. In rural population, vitamin D deficiency was observed in 44% men and 70% women compared to urban population where 62% men and 75% women had vitamin D deficiency.
24
But in South Asian countries vitamin D deficiency was equally prevalent in all age groups. The seasonal variation, cultural factors and latitude also influence vitamin D status.
PHARMACOLOGICAL PREPARATIONS AVAILABLE IN INDIA
In India, vitamin D is available mainly as cholecalciferol sachets (60,000 units/sachet), {tablets of 1000 units cholecalciferol (rarely)} and in combination with calcium containing tablets (usually 250U or 500 U/tablet). There are various treatment/daily maintenance doses proposed for the treatment of hypovitaminosis D. The therapy proposed in western population prescribe cholecalciferol in doses of 400 units, 600 units, 1000 units etc(48). In India, vitamin D is not available in such small doses, so most of the pediatricians prefer to use cholecalciferol sachet and divide the granules into equal parts based on the dose required. The cholecalciferol granules are heat and light sensitive, and hence should not be re-used if once the sachets are opened.
VITAMIN D PHARMACOKINETICS:
25
therapy at three months of therapy, but there is no difference between the groups after 6 months.
Ergocalciferol is the plant source for vitamin D, while cholecalciferol is the animal source for vitamin D. Ergocalciferol is metabolized quickly compared to cholecalciferol. Armas et al(62) compared the effectiveness of vitamin D2 with Vitamin D3 and found that the initial response was similar in both the groups, but Se 25OHD tend to fall after third day in Vitamin D2 group and reach the baseline by day 14. Logan et al(63) showed that long term cholecalciferol therapy is more effective than ergocalciferol therapy in maintaining steady state of Se 25OHD. Endocrine Society Clinical Practice Guideline (47) recommends that either vitamin D2 or Vitamin D3 can be used to treat hypovitaminosis D, but the treatment should be followed by maintenance therapy. In India, Vitamin D2 is not available. In our study, we used vitamin D3 for the treatment and compared daily therapy with weekly therapy.
DOSING SIZE AND SCHEDULE
There are very few studies in children with oral daily doses of vitamin D supplementation for asymptomatic vitamin D deficient children. We mention the few relevant studies. Majority have been stoss therapies for treatment of rickets.
26
weeks. Participants were analysed one week after completion of treatment. They used one way ANOVA for continuous measures and Fisher‟s test for dichotomous variables. All the treatment regimens increased the vitamin D level by three fold . The effect difference compared between between daily Vitamin D2 and weekly Vitamin D2 was 12% but it was insignificant (p=0.66). Similarly the effect difference compared between daily Vitamin D2 and daily Vitamin D3 was 7% which was also insignificant(p=0.8). The mean change in Se calcium level was minimal and similar in all the groups. At recruitment , 8 participants had elevated PTH level and it returned to normal after treatment. The greatest response was seen in participants who received Vitamin D2 weekly compared to othe two groups. But it is not statistically significant(p=0.74). There was no evidence of hypervitaminosis D in this study. But the main limitation in this study is the small sample size.
Endocrine Society Clinical Practice Guideline(47), recommends 2000 units of ergocalciferol or cholecalciferol daily or 50,000 units of ergocalciferol or cholecalciferol weekly once for 6 weeks to treat vitamin D deficiency in infants. The dosage is sufficient enough to raise the Se 25OHD above 30ng/ml.. After 6 weeks all the patients should be started on maintenance vitamin D (i.e) 400-1000 units / day of vitamin D. The vitamin D toxicity is unlikely with these regimens. Endocrine Society Clinical Practice recommnends(47) 2000 units of ergocalcifreol or cholecalciferol daily or 50,000 units of ergocalciferol or cholecalciferol weekly once for 6 weeks to treat vitamin deficiency in children aged 1 to 18 yr. To maintain Se 25OHD level above 30ng/ml, the treatment should be followed by maintenance vitamin D theapy(600-1000 units of vitamin D/day)
27
and children with hypovitaminosis D in New Zealand and Australia. They suggest vitamin D should be supplemented to all breast fed infants till 12 months of age to prevent hypovitaminosis D. They recommend 400 units of vitamin D daily as vitamin D prophylaxis for children. If compliance is an issue, they advise 1.5 lakh units of vitamin D yearly once. Either ergocalciferol or cholecalciferol was advocated for treatment of hypovitaminosis D. The treatment for vitamin D deficiency was 1000 units/day for neonates, 3000 units/day for infants and 5000 units/day for children more than 1yr of age for a period of 3 months followed by maintenance vitamin D supplementation.
Shah et al(64) used of oral stoss therapy (3 lakh/6lakh units of vitamin D2 or vitamin D3 as single or three to four divided doses) for treating hypovitaminosis D and found that there is significant improvement in Se 25 OHD levels but the risk of hypervitaminosis do exist, especially in younger children.
Cesur et al (65) compared three different treatment regimens for treating nutritional vitamin D deficiency in children less than 3 years. The three treatment regimens are single dose of 1.5 lakh units, single dose of 3 lakh units and single dose of 6 lakh units. Out of 56 patients , 52 were followed up. There was significant improvement in vitamin D status in all the participants irrespective of the groups. But six children who received single dose of 6 lakh units and 2 children who received single dose of 3 lakh units developed hypercalcemia. .
28
hypotonia, wide open anterior fontanel, enlarged wrist joint, harrison‟s sulcus and delayed dentition. The most common biochemical abnormality other than low Se 25OHD was elevated Se alkaline phosphatase(100%), low Se phosphorous(75%) and then low Se calcium(12.5%). Se Calcium, Se Phosphorous and Se 25OHD normalized after 1 month , while Se alkaline phosphates and Se PTH normalised after 3 months. After 3 months of IM injection, 12.5% had Se 25OHD <20ng/ml and 87.5% had Se 25OHD >20ng/ml. Hypercalcemia was not observed in any participant. Clinically significant improvement in rickets was noticed in all the participants. Radiologically 95% of children showed complete healing of rickets. This study shows IM vitamin D therapy has slow and sustained response compared to oral therapy which has rapid response but the response last only for short duration.
Zabihiyeganeh et al (66) conducted a randomized interventional study comparing oral with intramuscular vitamin D therapy. He recruited 92 patients and randomized them into two groups. One group received single dose of 3 lakh units of cholecalciferol IM and the other group received 3 lakh units cholecalciferol oral in six divided doses over a period of three months. There was significant improvement in the Se 25OHD in both the groups. The delta change of Se 25OHD at 3 months was higher with oral therapy (90 ± 11nmol/L) compared to IM injection group (58.8 ± 8.9nmol/L) which is statistically significant (p=0.03). But the delta change of Se 25OHD in oral therapy group(52± 7.6nmol/L) and injection group (62.2±6.7nmol/L) was similar(p=0.3) after 6 months.
29
months. Se 25OHD and other biochemical parameters were measured two weeks before and two weeks after supplementation. Se 25OHD levels significantly increased within 2 weeks but values returned to normal before the next dose (p<0.001). After the first dose, 1,25 dihydroxy vitamin D3 increased in all the infants(p<0.005), but there was no consistent pattern following subsequent doses. Fourteen infants developed hypercalcemia during the course of the study. There is no evidence of cumulative increase in Se 25OHD levels even after high dose intermittent therapy.
Carnes et al(68) compared the effectiveness of two treatment protocols in treating adolescents with vitamin D deficiency. In his study, 22 healthy adolescents with Se 25OHD were recruited. One group received oral 3,00,000 units 6 monthly, other group oral 1,50,000 units 6 monthly with contol group which received placebo for 1year. After 12 months, the mean Se 25OHD in the group which received 3,00,000 units was 63nmol/L, in the group which received 1,50,000 units it was 41.1nmol/L and was 35.8nmol/L in the placebo group. The difference between the group that received high dose compared to the placebo group was significant(p=0.004). There were no complications observed in any participant. This study shows 3,00,000 units once in every six months can be used in treating adolescents with vitamin D deficiency.
30
groups showed significant response in Se 25OHD. Children who received low dose stoss therapy showed better response compared to group that received daily therapy(p<0.001). There was no evidence of hypervitaminosis in any participant.
Studies have shown that dietary deficiency of calcium alone can lead to rickets(70). Aggarwal et al(71) conducted a randomized interventional study to compare the effectiveness of three different treatment regimens in healing rickets in children. Sixty seven children with rickets were recruited and randomized into three groups. One group received 6 lakh units IM cholecalciferol, second group received only calcium(75mg/kg/day ) and the third group received both cholecalciferol and calcium for 12 weeks. At 12 weeks biochemical and radiological evidence of healing were evident in all the participants. After treatment, complete biochemical and radiological healing are seen in 50% of children who received combined therapy, 15.7% of children who received vitamin D alsone, and 11.7% in group which received calcium alone. This shows combined vitamin D and calcium therapy is more effective in treating rickets.
EFFECT OF BMI :
31
normal weight mother,despite similar serum levels. Though studies have shown that BMI has significant influence on treatment response(76), there is paucity of literature regarding whether dosing should be based on BMI, weight or severity of vitamin D deficiency.
SIDE EFFECTS OF VITAMIN D SUPPLEMENTATION
Hypervitaminosis D is defined as Se 25OHD more than 150ng/ml(76), but vitamin D toxicity has been observed when Se 25OHD more than 300ng/ml(750nmol/L) (75). Hypervitaminosis D is not an uncommon phenomenon observed with treatment for vitamin D deficiency. Probable reasons could be 1) because most of the treatment regimens recommend uniform dosing irrespective of age or weight., 2) dosing is probably given without monitoring and 3) misuse. Whether age or weight is a determinant for vitamin D dosing is not known and in our study we have taken a lower dose for smaller weight children to avoid Vit D toxicity.
32
33
STUDY DESIGN:
Randomized parallel group interventional trial.
STUDY PERIOD:
A period of 12 months from December 2011 to November 2012.
STUDY SUBJECTS Inclusion Criteria
Children aged 1 year to 18 years presenting to the Paediatric Outpatient Department of Christian Medical College, Vellore with serum 25OHD level < 20ng/ml and residing within 300 km of Vellore.
Exclusion Criteria:
1. Children with symptomatic vitamin D deficiency (including skeletal manifestations of rickets)
2. Serum Calcium < 8.0 mg/dl.
3. Children already receiving calcium and vitamin D supplements.
4. Presence of conditions that can interfere with vitamin D absorption and metabolism. i. Malabsorption syndromes, liver disease and renal disease
34
35
SUBJECTS
Children residing within 300km in and around Vellore (Latitude 12° 55' N) and with vitamin D deficiency (Se 25OHD level less than 20ng/ml) were evaluated for features of vitamin D deficiency like hypocalcemia (Se Calcium< 8mg/dl), clinical features of rickets, and for any other secondary causes that interfere with vitamin D absorption and metabolism like malabsorption syndrome, renal disease, liver disease and drugs like antituberculous therapy, antiepileptics etc. Children with features of vitamin D deficiency, or with secondary causes that could interfere with vitamin D absorption and metabolism and those already on vitamin D and calcium were excluded from our study.
We discussed with the participating children (wherever applicable) and their parents/guardians regarding the study protocol, and recruited them after getting written informed consent. Once the child was recruited, he/she was randomized by block randomization and allocation was done through opaque envelopes which were serially allocated to participants. They were randomized into three groups
GROUP A: received 6000 units of vitamin D3 daily oral GROUP B: received 10,000 units of vitamin D3 daily oral
GROUP C: received 60,000 units of vitamin D3 weekly once oral All the groups received the supplementation for a total period of 6 weeks.
Children who weighed less than 15 kg received half the dose of cholecalciferol than their respective counterparts (i.e., Group A-6000 units alternate day, Group B-10,000 units alternate day and Group C- 30,000 units once weekly).
36
RANDOMIZATION: PERMUTATED BLOCK RANDOMIZATION
Participants in the three treatment groups were arranged into six blocks by permutation and combination. The six blocks were arranged based on randomly assigned numbers. Participants were recruited uniformly throughout the year.
The three treatment groups were:
A- 6000 units of oral cholecalciferol/day B- 10,000 units of oral cholecalciferol/day C- 60,000 units of oral cholecalciferol/week
If the participant weighed less than 15 kg, we used half the dose compared to their counterparts in each group(i.e) Group A-6000 units alternate day, Group B-10,000 units alternate day and Group C-30,000 units weekly once for 6 weeks
ALLOCATION CONCEALMENT:
Pre-numbered identical opaque covers; which were administered serially to the participants.
37
participant was contacted in person by the principal investigator, weekly once to ensure they were compliant and taking the drug in the prescribed way.
38
ANALYTICAL METHODS: Vitamin D:
Vitamin D levels in serum were assayed using the Sandwich electrochemiluminescence immunoassay (Automated Roch modular E170).
Test principle: Competition principle
Sample processing: Due to possible evaporative effects samples must preferably be measured with in two hours
Measuring range: 4-100ng/ml (10-250nmol/L) Lower detection limit – 4ng/ml
Upper detection limit – 100 ng/ml
Interference:
Samples showing visible signs of haemolysis (Haemoglobin concentrations >0.1g/dl) may cause falsely elevated results. Assay unaffected by icterus, lipemia and biotin or
Rheumatoid factor.
Reliability:
39
Se Calcium, Se ALP and Se Phosphorous analysis was carried out in Roche modular P800.
Se Calcium:
Test principle: calorimetric end point method. Calcium forms purple coloured comples with o-cresol phthalein complexone in an alkaline medium. The intensity of the colour measured at 540nm is propotional to the Se Calcium. This measures total calcium in the blood.
Se Phosphorous:
Test principle: Inorganic phosphate reacts with ammonium molybdate and sulphuric acid to form unreduced phosphomolybdate complex. The absorbance of this complex at 340nm is propotional to the inorganic phosphorous in the blood.
Se Alkaline phosphatase:
Test principle: ALP is measured by hydrolysis of 4-nitrophenyl phosphate in alkaline ph. The substrate is converted to 4-nitro phenol in alkali with increased absorbance at
40
Se PTH:
41
Table 4: Parameters monitored during the study period:
At recruitment 3rd week 8th week 14th week
Weight/ Height
BMI/BMI centile
Se. Calcium
Se.Phosphorous
Se.Alkaline phosphatase
Se.25OHD
Se.PTH
Se.Albumin
Se.Creatinine
Urine spot calcium/ creatinine ratio
42
43
STATISTICAL ANALYSIS:
Baseline characteristics were analysed and summarized according to the three trial arms. Continuous variables are summarized as mean (SD) or median (IQR) if non-normal
44
SAMPLE SIZE CALCULATION:
Sample size was calculated based on difference between two means.
Sample size(n) = 2 SD2 (Zalpha + Z beta)2 [ SD- standard deviation (M1-M2) Zalpha_type I error = 1.96 Zbeta – type II error= 0.84 M1/M2- mean ]
= 2 x 52 x (1.96 + 0.84)2 [SD-5; M1-M2: 5]* 52
45
ETHICS APPROVAL:
Institutional ethics committee(The Instituional Review Board, Christian Medical College, Vellore) approval was obtained and all subjects gave written informed consent.
CLINICAL TRIAL REGISTRY-INDIA:
46
RESULTS
47
We recruited 39 asymptomatic children with vitamin D level less than 20ng/ml. The details of each participant regarding demographic profile, past and current medical ailments, weight, height, Body Mass Index(BMI) and BMI centiles were gathered. The details regarding duration of and factors limiting sunlight exposure, like clothing, sunscreen etc were also recorded.
They were randomized based on block randomization into three groups. Group A: 6000 units oral cholecalciferol daily
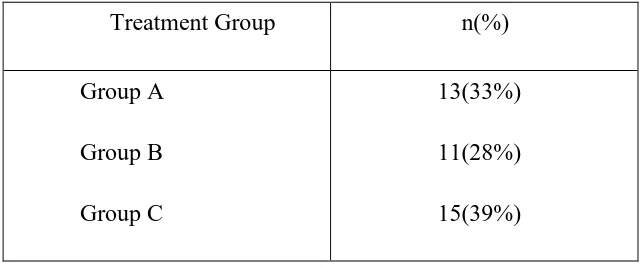
[image:53.595.107.429.378.511.2]Group B: 10,000 units oral cholecalciferol daily Group C: 60,000 units oral cholecalciferol weekly Table 5: Study population and Treatment Group;
Treatment Group n(%) Group A
Group B Group C
13(33%) 11(28%) 15(39%)
48
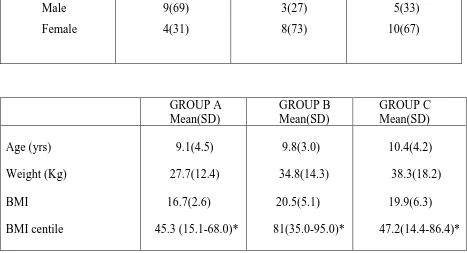
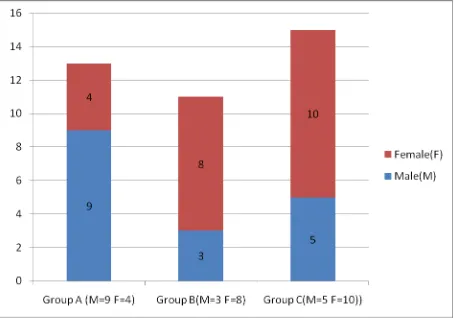
Table-6 : Baseline demographic and clinical characteristics of the study population compared across the groups:
GROUP A (n=13) n (%)
GROUP B (n=11) n (%)
GROUP C (n=15) n (%) Gender Male Female 9(69) 4(31) 3(27) 8(73) 5(33) 10(67) GROUP A Mean(SD) GROUP B Mean(SD) GROUP C Mean(SD) Age (yrs) Weight (Kg) BMI BMI centile 9.1(4.5) 27.7(12.4) 16.7(2.6) 45.3 (15.1-68.0)* 9.8(3.0) 34.8(14.3) 20.5(5.1) 81(35.0-95.0)* 10.4(4.2) 38.3(18.2) 19.9(6.3) 47.2(14.4-86.4)* SD-standard deviation IQR: Interquartile range BMI-body mass index
*to read as median(IQR)
49
50
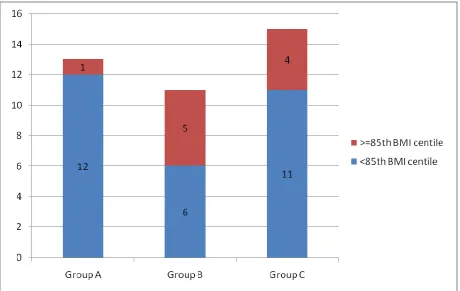
Fig 4: DISTRIBUTION OF OVERWEIGHT/OBESE BETWEEN THE GROUPS:
51
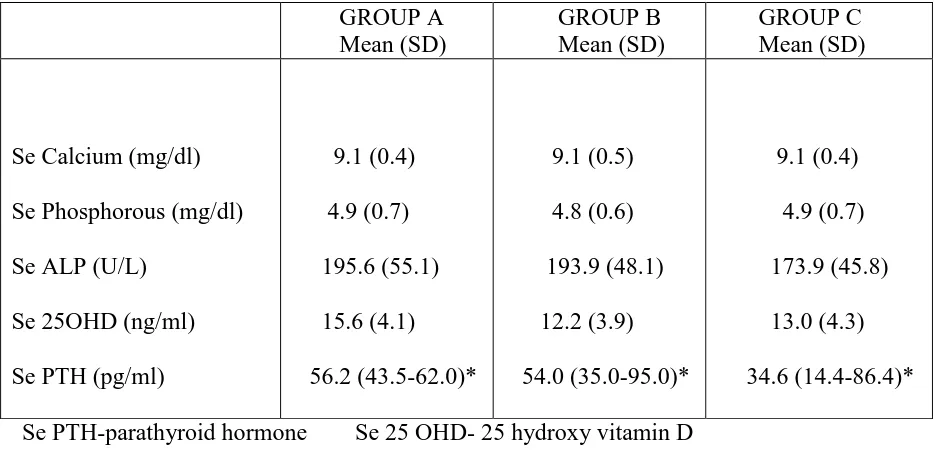
Table-7 : Baseline biochemical characteristics of the study population compared across the groups: GROUP A Mean (SD) GROUP B Mean (SD) GROUP C Mean (SD)
Se Calcium (mg/dl) Se Phosphorous (mg/dl) Se ALP (U/L)
Se 25OHD (ng/ml) Se PTH (pg/ml)
9.1 (0.4) 4.9 (0.7) 195.6 (55.1) 15.6 (4.1) 56.2 (43.5-62.0)* 9.1 (0.5) 4.8 (0.6) 193.9 (48.1) 12.2 (3.9) 54.0 (35.0-95.0)* 9.1 (0.4) 4.9 (0.7) 173.9 (45.8) 13.0 (4.3) 34.6 (14.4-86.4)* Se PTH-parathyroid hormone Se 25 OHD- 25 hydroxy vitamin D Se ALP- Alkaline phosphatase SD-standard deviation IQR: Interquartile range
*to read as median (IQR)
52
THIRD WEEK PARAMETERS:
At the third week of therapy, 22 (56%) participants were screened for Se Calcium and urine spot calcium/creatinine ratio. Four participants (Group A: n=1 and Group C-n=3) had elevated urine spot calcium/creatinine ratio but Se Calcium was within normal range and there were no other features of hypervitaminosis D.
EIGHTH WEEK PARAMETERS:
53
Table 8: EIGHTH WEEK PARAMETERS COMPARED BETWEEN GROUPS: GROUP A (n=11)
Mean (SD)
GROUP B (n=8) Mean (SD)
GROUP C (n=12) Mean (SD)
Se Calcium (mg/dl)
Se Phosphorous (mg/dl)
Se ALP (U/L)
Se 25 OHD (ng/ml)
Se PTH (pg/ml)
9.2 (0.4)
4.6 (0.6)
177.0 (58.2)
59.1 (17.3)
25.3 (21.0-39.7)*
9 (0.3)
4.6 (0.7) 196.6 (43.7) 47.0 (10.0) 34.8 (31.7-44.1)* 9.3 (0.4) 4.3 (0.9) 157.2 (36.8) 51.9 (10.1) 35.4 (14.3-39.7)*
SD-standard deviation BMI-body mass index Se PTH-parathyroid hormone Se 25 OHD- 25 hydroxy vitamin D3 Se ALP- Alkaline phosphatase
IQR: Interquartile range *to read as median (IQR)
54
The mean Se 25OHD level at the eighth week was 59.1 ± 17.3 ng/ml in group A, 47.0 ± 10.0 ng/ml in Group B and 51.9 ± 10.1 ng/ml in group C. Paradoxically though group B received the highest total supplementation (cumulative dose), an expected maximal rise was not seen. The mean Se calcium was similar in all the groups (Group A: 9.2 ± 0.4 mg/dl, Group B: 9.0 ± 0.3 mg/dl and Group C: 9.3 ± 0.4 mg/dl). The median PTH was similar in Group B (34.8 pg/ml) and Group C (35.4 pg/ml) compared to Group A (25.3 pg/ml). The mean Se Phosphorous was also similar in all the groups (Group A: 4.6 ± 0.6 mg/dl, Group B: 4.6 ± 0.7 mg/dl and Group C: 4.3 ± 0.9 mg/dl). The mean Se ALP was 177 ± 58.2 U/L in Group A, 196 ± 43.7 U/L in Group B and 157 ± 36.8 U/L in Group C. The urine spot calcium/ creatinine ratio was normal for all the participants in the eighth week. The elevated urine spot calcium/ creatinine ratio observed in the third week normalized by the eighth week.
FOURTEENTH WEEK PARAMETERS:
55
Table 9: FOURTEENTH WEEK PARAMETERS COMPARED BETWEEN GROUPS: GROUP A (n=11)
Mean (SD)
GROUP B (n=9) Mean (SD)
GROUP C (n=14) Mean (SD)
Se Calcium (mg/dl)
Se Phosphorous (mg/dl)
Se ALP (U/L)
Se 25 OHD (ng/ml)
Se PTH (pg/ml)
9.1 (0.3)
4.6 (0.6)
193.2 (69.1)
45.5 (13.6)
35.1 (30.7- 44.1)*
9.0 (0.5)
4.7 (0.5)
194.7 (40.7)
32.0 (8.5)
38.6 (32.1- 48.2)*
9.1 (0.4) 4.5 (0.8) 178.7 (46.6) 44.7 (15.6) 40.6 (34.6-52.4)*
SD-standard deviation BMI-body mass index Se. PTH-parathyroid hormone Se.25 OHD- 25 hydroxy vitamin D3 Se.ALP- Alkaline phosphatase IQR: Interquartile range *to read as median (IQR)
56
Phosphorous was similar in all the groups (Group A: 4.6 ± 0.6 mg/dl, Group B: 4.7± 0.5mg/dl and Group C-4.5 ± 0.8mg/dl). The mean Se ALP was similar in Group A (193.2 ± 69.1U/L) and Group B (194.7 ± 40.7 U/L) compared to Group C (178.7 ± 46.6 U/L). The urine spot calcium/creatinine ratio was normal for all the participants in the fourteenth week.
57
DISCUSSION
58
We recruited 39 children with Se 25OHD less than 20ng/ml. They were evaluated for features of rickets clinically and for evidence of secondary causes that interfere with vitamin D absorption or metabolism. The predominant secondary causes that interefere with vitamin D absorption and metabolism in children are malabsorption syndrome, chronic renal disease and chronic liver disease. We screened all the participants for Se albumin and Se creatinine to rule out chronic renal disease and chronic liver disease. Se albumin and Se creatinine were normal for all the children and there were no features of rickets or malabsorption in any of the participants.
59
pg/ml) and Group B (54.0 pg/ml) and comparatively higher than Group C (34.6pg/ml). The mean Se Calcium and Se Phosphorous were similar in all the groups(Table 7).
The amount of UVB radiation available from sunlight depends on the angle at which the sun‟s rays strike the earth which in turn depends on the latitude of the place. We recruited participants from in and around Vellore (Latitude 12° 55' N), so that participants were limited to a similar latitudinal area. In our study, as our participants were recruited throughout the year based on block randomization serially, the influence of seasonal bias on the treatment groups results is possibly avoided .
Though Se 25OHD is not the active form of Vitamin D, it is the major circulating form and it depicts the invivo status of vitamin D (47). A minimal alteration in Se Calcium can cause reciprocal PTH changes maintaining normal or increased 1,25 dihydroxy vitamin D3 (which is the active form of vitamin D) even when the body is actually deficient in Vitamin D (2). Moreover the half-life of 1,25 dihdroxy vitamin D3 is only 4 hours, compared to 3-4 weeks in case of 25OHD (2). Endocrine Society Clinical Practice Guidelines recommend using Se 25OHD as a reliable marker for vitamin D status and not 1,25 dihydroxy vitamin D3.
60
evidence that Se PTH remains suppressed only when Se 25OHD level is more than 20ng/ml and rickets/osteomalacia rarely occurs when Se 25OHD is more than 20ng/ml (47). In a study done by Clianferotti et al,(50) it is preferable to maintain vitamin D level above 75nmol/L (30ng/ml) to maximize the effects of vitamin D on musculoskeletal system. Haroon et al(51) also showed that higher levels of vitamin D is required to maintain adequate musculoskeletal health. Holick et al(47) suggest that vitamin D level more than 30ng/ml is required to satisfy the VDR receptor cellular level to maintain adequate extraskeletal health. Endocrine Society Clinical Practice Guidelines suggest Se 25OHD less than 20ng/ml as vitamin D deficiency and levels between 21-29 ng/ml as vitamin D insufficiency to stress the importance of maintaining adequate vitamin D level more than 30 ng/ml for optimum musculoskeletal and extraskeletal health (47). In our study we considered Se 25 OHD level less than 20 ng/ml as vitamin D deficiency as per the guidelines.
Armas et al(62) compared the effectiveness of vitamin D2 with vitamin D3 after a single oral dose of 50,000 units and found that the initial response was similar in both groups, but Se 25OHD continued to rise in vitamin D3 group compared to vitamin D2 group, in which Se 25OHD level tend to fall after 3 days and reach the pretreatment level by day 14. Logan et al(63) also showed that long term cholecalciferol supplementation is more effective than vitamin D2 in maintaining Se 25OHD level..
61
toxicity was observed when the dose exceeded 10,000 units daily(77) or if single oral dose exceeded 3 lakh units(78). In our study, we compared three oral cholecalciferol supplementation therapies- 6000 units daily (Group A), 10,000 units daily (Group B) and 60,000 units weekly (Group C). We used half the dose of cholecalciferol for children weighing less than 15kg (i.e) 6000 units alternate day in group A, 10,000 units alternate day in group B and 30,000 units weekly once in group C as studies have shown that lower dose of vitamin D is sufficient to have adequate response in infants and toddlers (48) and these dosing schedules fall well within the standard recommendations for treatment of vitamin D deficiency.
Armas et al(62) showed that peak response after oral administration of vitamin D3 occur approximately after 14 days and Se 25OHD level tend to fall by 1 month and then reach the baseline by 2-3 months. We analyzed the participants at 8th week (2 weeks after completion of the total supplementation, expecting the peak response at that time) to compare the peak response between the groups in raising Se 25OHD level. We again analyzed them at 14th week of the study (8 weeks after completion of supplementation) to compare the effectiveness between the groups in maintaining steady state of Se 25OHD. The biochemical parameters measured at 8th was summarized in Table 8..
62
also similar in all the groups (Group A: 4.6 ± 0.6 mg/dl, Group B: 4.6 ± 0.7 mg/dl and Group C: 4.3 ± 0.9 mg/dl). The mean Se ALP was 177 ± 58.2 U/L in Group A, 196 ± 43.7 U/L in Group B and 157 ± 36.8 U/L in Group C. The urine spot calcium/ creatinine ratio was normal for all the participants in the eighth week.
63
Table 10: Vitamin D response(change in vitamin D level) from 0-8th week: comparision between groups. Vitamin D response Group A (n=11) Mean (SD) Group B (n=8) Mean (SD) Group C (n=12) Mean (SD) p value
0-8th week
43.8 (17.5)
34.2 (9.2)
38.3 (11.0) 0.30
Though Group A showed better response at 8th week , there is no statistically significant difference in response between the groups (p=0.30). Paradoxically the group which has received the maximum cumulative dose(Group B) has shown lesser response compared to other groups, but this is also statistically non significant(p=1).
The mean reciprocal decline in the Se PTH value from the time of recruitment to 8th week in Group B (-30.9 ± 36.5 pg/ml) was more than Group A (-25.5 ± 17.6 pg/ml) and Group C (-17.1 ± 17.6 pg/ml), but Jonckheere-Terpstra Test analysis showed that the response is not statistically significant (p=0.172). The improvement in Se alkaline
phosphatase was observed in all the groups but the difference between the groups was not statistically significant (p=0.7). The spot urine calcium/creatinine ratio was within normal range for all the participants at the 8th week of the study.
64
FOURTEENTH WEEK:
Thirty four children (87%) were followed up (Group A-11 out of 13, Group B-9 out of 11and Group C-14 out of 15). Biochemical parameters done for the study participants in the fourteenth week are summarized in Table 9.
The mean Se 25OHD levels at the fourteenth week were similar in Group A (45.5 ± 13.6 ng/ml) and Group C (44.7 ± 15.6 ng/ml) compared to Group B (32.0 ± 8.5 ng/ml). The mean Se Calcium was normal and similar in all the groups (Group A:9.1 ± 0.3 mg/dl, Group B: 9.0 ± 0.5 mg/dl and Group C: 9.1 ± 0.4 mg/dl). The median PTH value in Group A was 35.1 pg/ml, in Group B was 38.6 pg/ml and in Group C was 40.6 pg/ml . The Se phosphorous was similar in all the groups (Group A: 4.6 ± 0.6 mg/dl, Group B: 4.7± 0.5 mg/dl and Group C-4.5 ± 0.8 mg/dl). The mean Se ALP was similar in Group A (193.2 ± 69.1U/L) and Group B (194.7 ± 40.7 U/L) compared to Group C (178.7 ± 46.6 U/L).
65
Table 11: Treatment group A- Vitamin D and PTH measured at 8th and 14th week
8th week (n=11) Mean (SD)
14th week (n=11) Mean (SD)
Se Vitamin D (ng/ml)
Se PTH (pg/ml)
59.1 (17.3)
25.3(21.0-39.7)*
45.5 (13.6)
35.1(30.7-44.1)*
SD-standard deviation Se PTH-parathyroid hormone Se 25 OHD- 25 hydroxy vitamin D3 IQR: Interquartile range
*to read as median (IQR)
66
Table 12: Treatment group B- Vitamin D and PTH measured at 8th and 14th week
8th week(n=8) Mean(SD)
14th week(n=9) Mean(SD)
Se 25OHD (ng/ml)
Se PTH (pg/ml)
47.0(10.0)
34.8 (31.7-44)*
32.0(8.5)
38.6(32.1-48.2)*
SD-standard deviation Se PTH-parathyroid hormone Se 25 OHD- 25 hydroxy vitamin D3 IQR: Interquartile range
PG THESIS: ABSTRACT
TITLE
To analyze the effect of vitamin D supplementation on
serum 25 hydroxy vitamin D level in asymptomatic Vitamin D deficient children : Comparison of three different vitamin D supplementation protocols.
DEPARTMENT
: Department of Pediatrics, Christian Medical CollegeNAME OF THE CANDIDATE : Dr. PRAGATHESH.P DEGREE AND SUBJECT : M.D Pediatrics
NAME OF THE GUIDE : Dr. ANNA SIMON
Head of the Department, Department of Pediatrics, CMC, Vellore.
OBJECTIVES:
The objective was to compare effectiveness of three different vitamin D supplementation protocols and to establish the effective protocol with minimal side effects for asymptomatic vitamin D deficient children.
METHODS:
Children (1-18years) with asymptomatic hypovitaminosis D (serum 25OHD <20ng/ml) were randomized into 3 different oral cholecalciferol supplementation protocols (6000 units daily/10,000 units daily/60,000 units weekly once) for 6 weeks. Clinical and biochemical (including serum 25OHD, calcium) parameters were monitored at baseline, 2weeks and 8 weeks after completing treatment. The results were analyzed with repeated measures analysis of covariance (ANCOVA) using statistical package for social sciences (SPSS) and STATA.
RESULTS:
CONCLUSIONS:
67
Table 13: Treatment group C- Vitamin D and PTH measured at 8th and 14th week
8th week (n=12) Mean (SD)
14th week (n=14) Mean (SD)
Se 25OHD (ng/ml)
Se PTH (pg/ml)
51.9 (10.1)
35.4 (14.3-39.7)*
44.7 (15.6)
40.6 (34.6-52.4)*
SD-standard deviation Se PTH-parathyroid hormone Se 25 OHD- 25 hydroxy vitamin D3 IQR: Interquartile range
68
[image:76.595.64.524.429.600.2]At 14th week of the study (8 weeks after completion of the treatment), there is a decline in Se 25OHD in almost all the participants as expected, except two children in group C who showed increase in Se 25OHD from the 8th week values. This decline in Se 25OHD at 8 weeks after cessation of Vitamin D supplementation reiterates the recommendation for continuation of supplementing daily requirements or adopting better sunlight exposure practices. The mean change in Se 25OHD from the 8th week to 14th week is summarized in Table 14.
Table 14: Vitamin D response (decline in vitamin D level) from 8th-14th week: comparision between groups Vitamin D response Group A (n=11) Mean (SD) Group B (n=9) Mean (SD) Group C (n=14) Mean (SD) p value
8th -14th week
13.5 (10.3)
14.5 (7.9)
5.8 (10.1) 0.009
69
(13.5 ± 10.3 ng/ml) and Group B(14.5 ± 7.9 ng/ml) which was statistically significant (p=0.009) (Table 14). There is paucity of literature in this aspect in children. In adults daily versus weekly dosing has found variable results regarding stability of 25OHD levels after a few weeks of supplementation. In other words, Se 25OHD levels were maintained for a longer time with weekly dose as compared to a similar magnitude of daily dose regimen after discontinuation of cholecalciferol supplementation. As expected there is relative increase in Se PTH in all the groups at 14th week, but Jonckheere-Terpstra test didn‟t show significant difference between the groups (p=0.117).
70
Table 15: Vitamin D response over a period of 14 weeks: Intergroup comparision (Post Hoc comparision using BONFERONI):
TREATMENT GROUP TREATMENT GROUP
Std. Error Sig.
Group A Group B 3.95 .08
Group C 3.55 1.0
Group B Group A 3.95 .08
Group C 3.88 .33
Group C Group A 3.55 1.0
71
72
INFLUENCE OF BMI ON TREATMENT:
Twenty nine participants who were <85th BMI centile showed greater response of Se 25OHD at 8th week of supplementation (42.9 ± 13.4 ng/ml) compared to children who were >85th centile (28.3 ± 5.2 ng/ml), irrespective of the treatment group and this difference was statistically significant (p=0.02) (Table 16). Similar results have also been documented by Sioen et al(76) who showed that BMI has significant influence on vitamin D status in young Belgian childrens. In another study done by Saliba et al(72), BMI was shown to have inverse relation with vitamin D response on vitamin D supplementation. This is similar to our observation (i.e) children with BMI <85th centile showed better response compared to those with BMI>85th centile.This has a practical significance that children who are overweight and obese require higher doses of vitamin D to achieve a similar increase in Se 25OHD as compared to non-obese children. With this significant finding, we recommend that vitamin D supplementation doses should be based on BMI rather than weight or age of the patient. Larger cohorts need to be studied to reconfirm this association and to make recommendations on dosing of Vitamin D.
73
Table 16: Influence of BMI (centile) on vitamin D response between 0-8th week and 8th -14th week:
Vitamin D response BMI centile <85 n=23 Mean(SD)
BMI centile >85 n=8
Mean(SD)
p value
0-8th week
42.9(13.4)
28.3(5.2) 0.02
8th -14th week
11.9(11.2)
74
INFLUENCE OF AGE AND GENDER ON TREATMENT:
Using repeated analysis of covariance, we analysed the correlation between Se 25OHD and age and with gender. We found that age (p=0.9) and gender (0.08) had no significant influence on treatment response. Endocrine Society Clinical Practice Guidelines
recommend uniform dose for children (with vitamin D deficiency) from 1-18 yrs (47). The preplanned comaparision between children weighing <15kg and >15 kg could not be done in view of the small size of the sample <15 kg.
INFLUENCE OF SEVERITY OF BASELINE VITAMIN D DEFICIENCY ON TREATMENT:
We analyzed the association of severity of baseline vitamin D deficiency (Se 25OHD level) on treatment response using repeated measure analysis of covariance. The severity of Vitamin D deficiency at recruitment doesn‟t show any influence on the treatment response (p=0.3) and there is paucity of literature in this aspect in children. Further research is needed to compare the severity of vitamin D deficiency and treatment response and also whether the supplementation should be based on the severity of vitamin D deficiency (Se 25OHD level) rather than giving uniform treatment to all asymptomatic children
75
HYPERVITAMINOSIS D:
Misra et al suggested vitamin D excess as Se 25OHD >100 ng/ml and vitamin D
intoxication as Se 25OHD >150 ng/ml. Jones G et al considered 250nmol/L (approximately 100ng/ml) of Se.25OHD as safety (upper) limit of vitamin D status (75).
Among 22 participants, who were screened at the 3rd week of supplementation, four were found to have elevated urine spot calcium/creatinine ratio (Group A-1 and Group C-3), but there were no other clinical features of hypervitaminosis D. Moreover the Se Calcium was within normal range and Se 25OHD was within 100ng/ml in these children. The urine spot calcium/creatinine ratio of these four participants normalized in the subsequent sampling (next couple of weeks). At 8th and 14th week, Se Calcium, Se 25OHD and urine spot calcium creatinine ratio were normal in all the children..
76
77
1. All the three Vitamin D supplementation protocols (oral cholecalciferol 6000units daily; 10,000 units daily and 60,000 units weekly once; for 6 weeks) showed similar efficacy in raising Se 25OHD levels and there was no statistically significant
difference between the groups.
2. The decline in Se 25OHD at 8 weeks after cessation of Vitamin D supplementation reiterates the recommendation for continuing supplementation of daily Vitamin D requirement or adopting better sunlight exposure practices.
3. BMI has a significant influence on the treatment response during the initial
phase(i.e.), children with BMI > 85th centile require a higher dose of cholecalciferol for a similar rise in Se 25OHD as compared to children with BMI <85th centile.
4. There was no evidence of hypervitaminosis D as measured by Se 25OHD levels and Se calcium levels, but hypercalciuria was observed during the initial weeks of
supplementation in a few participants especially in the group recieving the high dose weekly oral cholecalciferol.
78
79
1. Since our sample size was small, we require further research adequately powered to authenticate our observation.
80
82 RANDOMIZED TRIAL COMPARING THE EFFECT OF THREE DIFFERNT VITAMIN D SUPPLEMENTATION
PROTOCOL IN VITAMIN D DEFICIENT CHILDREN
1. NAME: 2. SEX: MALE/FEMALE 3. DATE OF BIRTH/ AGE:
4. RESIDENCE: 5. HOSPITAL NO:
6. PRIMARY DIAGNOSIS:
7. ANY OTHER ILLNESS:
8. MEDICATIONS:
9. SUNLIGHT EXPOSURE :
SUNLIGHT EXPOSURE
BEFORE RECRUITMENT AFTER RECRUITMENT
CLOTHING (BSA EXPOSED)
AVERAGE DURATION OF EXPOSURE PER DAY
SUNSCREEN
83 11. PARAMETERS:
TIME OF
SAMPLING
PARAMETERS
0 WEEK 3rd WEEK 8th WEEK 14th WEEK
DATE
Weight
Height
BMI and BMI percentile
Se.Calcium
Se.Phosphorous
Se. ALP
Se.25 OHD
Se.PTH
Se. Albumin
Se. Creatinine
Ur. Ca/creatinine ratio
85
ABBREVATIONS
SEX: 1- Male 2-Female
TREATMENT GROUP: 1- Group A 2-Group B 3-Group C
BMI: Body mass index
BMI%: Body mass index centile
Se Ca: Serum calcium mg/dl
Se Po4: Serum phosphorous mg/dl
Se ALP: Serum alkaline phosphatase U/L
Se PTH: Se Parathyroid hormone pg/ml
86 S.NO
AGE(YRS
) SEX
TREATMEN T GROUP
WEIGH T 1(KG)
HEIGHT
1(CM) BMI 1 BMI % 1 S.Ca 1
1 8.5 1 3 48 114 36.9 99.7 9.4
2 12 2 2 36.9 140 18.8 60 9.4
3 12 1 1 32.3 147 14.9 5.2 9.1
4 11.5 2 2 45.5 150 20.2 81 8.1
5 15 1 3 79 163 29.7 97.6 9.2
6 15 2 1 36.4 151 16 3.1 8.8
7 12.5 2 3 37.4 135 20.6 77 9.4
8 9 1 2 22 119 15.5 35 9.5
9 2.5 1 1 9.4 84 13.3 0.1 9.7
10 6 2 1 15 104 13.8 6.9 9
11 3.5 2 2 13.5 97 14.3 10 9.8
12 8 2 3 22.8 124 14.8 24 8.9
13 15 1 1 43 145 21 58 9.1
14 15 2 3 41 161 15.8 2.5 9.2
15 12 2 2 37 140 19 61 9.4
16 12.5 1 2 45 136 24.3 93.5 9.6
17 12 1 1 38 147 18 46 9
18 10.5 2 3 45 150 20 80 8.1
19 3.5 2 1 13 92 15.5 45.3 9.8
20 13 2 3 51.5 162 19.6 61.5 9.2
21 15 2 3 39 152 16.8 9.5 9
22 11 1 3 57 150 25.3 97.3 9.2
23 13 2 1 38 150 16.8 22.2 8.2
24 12 2 2 56 140 28.6 98.3 8.9
25 5 1 1 15 94 16.6 81.5 9.2
26 8 2 3 24 126 15.3 34 8.9
27 6 2 2 15 105 13.6 7.5 8.2
28 15 2 3 43 152 18.6 30 9
29 7 1 1 25 116 17 78 9.2
30 11 1 3 43 145 20.9 86.4 9.2
31 12.5 1 2 40 134 22.2 89 9.4
32 2 2 3 8.2 77 13.8 1.4 8.7
33 9 1 1 38 129 22.8 96 9.5
34 9.5 2 3 25.6 125 16.3 47.2 9.6
35 10.5 2 2 49 131 28.5 95.1 9.3
36 5 1 1 16 102 15.3 48 9.5
37 14.5 1 1 42 161 16.2 6.7 9
38 2 1 3 10.3 82 15.3 14.4 9.9
87 S.NO S.Po4 1 S.ALP 1 S.Vit D 1 PTH 1
WEIGH T 8
HEIGHT
8 BMI 8 BMI % 8
1 6 281 9.2 75.8
2 4.8 188 12.2 54
3 5.7 232 17.9 77.7 32 148 14.6 5.2
4 4.2 206 7.7 72.1 46 151 20.2 80
5 3.5 90 19.2 69.1 80 165 29.4 97.5
6 4.3 60 6.59 62.2 36.5 151 16 3.1
7 5.3 164 12.6 55.1 38 135 20.2 75
8 4.3 197 18.4 36.3 23 119 15.5 35
9 4.9 181 16.7 15.9 10 88 13.2 0.1
10 4.5 166 18.6 59.7
11 5.2 108 11 23
12 5.9 195 8.3 33.7
13 5 200 13.2 35 44 147 20.8 56
14 4.7 126 14.5 34
15 4.6 189 12.2 56 37.5 140 19.2 61
16 6.1 262 16.2 47.1 46 136 24.8 94.5
17 5.3 230 17.8 80 38.4 148 17.5 45
18 4.2 200 7.7 72 46.5 150 20 80
19 5.2 250 16.5 56.2
20 5.2 168 18.6 103 52 163 20 61.6
21 3.9 128 16.2 25 39.6 152 17.1 12
22 5.2 200 13.1 34.6 58 150 25.7 97.3
23 4 130 7.2 62.2 38.5 150 17 22.5
24 4.4 208 9.3 189
25 6.7 265 17.1 57 15.6 94.6 16.8 81
26 5.2 196 8.1 33 24.5 126 15.4 41
27 4.2 149 15 45.2 15.4 105 13.9 11
28 4 128 16 25 43 152 18.6 30
29 4 197 18.4 35 26.5 117 17.6 78
30 5.2 200 13.1 34.6 44 145 20.9 88.7
31 5.6 162 16.5 57.1 40 134 22.2 89
32 4.5 149 19.8 43.7 8.4 77 14 3
33 4.3 244 16