H
'b1
European
Investment
Bank
•'
Research Department
lnve tment
inth
Community
CONTENTS
Introduction
CHAPTER 1 - Investment 3
1.1 The economic background to investment 3
1.2 Investment in the Community countries by sector: business capital 8 expenditures, housing construction, and public authorities' investment
CHAPTER
2-
Financing of Investment 172.1 The financial background 17
2.2 Financing in the Community countries by sector: personal and corporate 24 savings, new capital issues on domestic markets, bank and other credits to the econom~
2.3 Debt issues by Community borrowers on the Swiss and U.S. markets 39
CHAPTER 3- International Capital Markets 41
3.1 Public bond issues on the European international market and issues by 41 non-residents
em
national markets3.2 International medium-term credits 44
CONVERSION OF NATIONAL CURRENCIES
All statistical data published in this Report are provisional for 1975 and often for 1974 as well. Throughout this Report data for the Community as a whole refer to the present nine member countries: statistics for years prior to 1973 have been adjusted to add data for the three new Member Countries to those of the original "Six".
The equivalent in units of account of amounts in national currencies has been calculated at exchange parities or central exchange rates as appropriate. For currencies which began floating in 1972 exchange parities declared to the Inter-national Monetary Fund were replaced as from mid-1972, initially by the middle closing rate on 29th December 1972. For the currencies which began floating in early 1973, exchange parities were replaced initially by the middle closing rate on the 19th or 20th of March, as appropriate. The conversion rates for currencies with floating exchange rates were subsequently altered whenever the monthly average of market rates varied by more than 5% from the conversion rate in use. These conversion rates were applied to the available statistical material in the following manner:
- for individual operations and for amounts outstanding at any particular time, the conversion rate appropriate to the period was used
- for annual totals (such as for Gross National Product or Gross Fixed Invest-ment), a weighted average of conversion rates in force during the year was used.
The conversion rate for the EURCO which consists of the sum of fixed amounts of the currencies of all the Member Countries of the European Community was taken to be that in force when the first EURCO issue was made in September 1973.
INTRODUCTION
The first economic recession to affect the European Community as a whole which began to develop in 1974 increased in severity in the first half of 1975. This downswing in the business cycle was probably accentuated by the decline in the volume of investment which took place in most Member States in 1974 and became general throughout the Community in 1975.1n the prevailing conditions of slack demand, however, inflationary pressures began to abate while in most countries reduced imports led to an improvement in the balance of payments. The authorities thus had room to manoeuvre in introducing or reinforcing measures aimed at restimulating economic activity and at checking the serious and widespread rise in unemployment.
The running-down of stocks by enterprises in the first half of the year, while tending to depress output still further in that period, paved the way for the be-ginning of a restocking movement in some countries in the second half of the year and thus helped to strengthen the impact of official counter-cyclical measures. This improvement in the investment outlook came too late to affect the out-turn in the fixed investment of businesses in 1975, although by the end of the year orders for plant and machinery were beginning to rise in some countries.
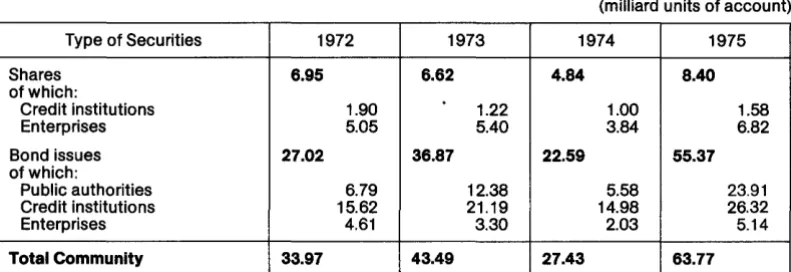
The general relaxation of monetary and fiscal policy in the Community paved the way for a further reduction in short-term interest rates from the very high levels which had prevailed on most markets during a substantial part of 1973 and 1974. As a result of the re-establishment of a more normal relationship between short-term interest rates and long-term yields (see Chart V), bond markets were able once more to attract investors who showed increasing willing-ness in the last quarter of the year to purchase longer-dated securities. Bond markets thus ended 1975 in a healthier state than for nearly two years. Prices rose also on all share markets except that of Italy, though the amount of new share issues was perhaps less than it might have been because of the continuing uncertainty of the economic outlook.
The volume of personal saving was exceptionally high in 1975. It would appear that individuals tended to save more, partly as a precautionary measure in the face of rising unemployment, but partly also as an adjustment to higher price levels and rates of income. Financial intermediaries tended to have means for lending as well as for investment but demand for credit by enterprises was relatively weak, except in some countries during the fourth quarter when stocks began to be rebuilt.
%
lower profitability, the financial structure of enterprises was impaired by the effect of inflation on the replacement cost of fixed assets in comparison with which provisions for depreciation, based on the historic cost of existing fixed assets, were inadequate. For these reasons the capacity of enterprises to finance the acquisition of new fixed assets from internal resources appears to have
sufferedfurtherduring197~
Chart I - Growth in Gross Community Product,
1971-1975
1971
Growth in volume
(percentage change from previous year)
1972 1973
Growth in value
1974 1975
Implied price index
CHAPTER 1
INVESTMENT
1.1. THE ECONOMIC BACKGROUND TO INVESTMENT
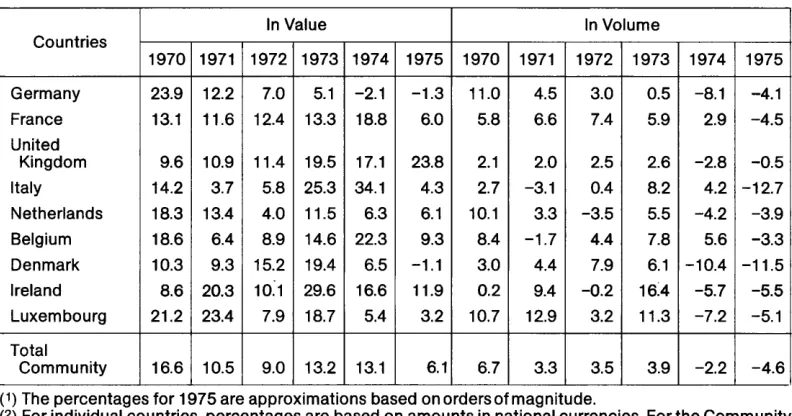
The extentto which the Gross National Product of the Member States declined in real terms in 1975 is indicated in Chart I. As explained in the Introduction, most of the fall occurred in the first half of the year and was followed in the second half by beginnings of a revival of activity in a number of countries. Gross fixed invest-ment was already declining, by over 2 ·per cent in volume, in 1974 and probably helped to accentuate the depth of the recession in 1975 when itfell byafurther4.6percentorso.Coupled with a lower rate of inflation than in 1974, this performance resulted in an increase of just under 6 per cent in current prices compared with over 13 per cent the previous year.
The preliminary statistics in Table 1 of gross fixed investment suggest that its fall in volume varied considerably from one country to an-other. The sectoral pattern, however, was fairly consistent in that most of the decline was con-centrated in the business sector accompanied by a small fall in the total for. housebuilding, while fixed investment by public authorities generally rose under various plans for stim ulat-ing economic activity.
The deterioration in investment in 1975 was most rapid in three countries, Italy, Belgium and France, where there was still some growth in volume in 1974. In two other countries, Den-mark and Luxembourg, where the volume of investment was already declining in 197 4, there was a further but limited deterioration in 1975. In the Netherlands, in the same manner, the contraction of investment continued at a slight-ly faster pace while in Germany it fell to a smaller extent in 1975. The United Kingdom and Ireland also experienced less of a fall in invest-ment in 1975. These two countries, however, were distinguished from all the others, with the
exception of Italy, by their relatively high rates of inflation which resulted in their recording the largest increases in investment in current price terms.
ln/ta/y, the decline in investmentactivityin1975 was at the core of the recession in the economy, as the volume of total fixed capital expenditures, after rising by over 4 per cent in 197 4, contracted by nearly 13 per cent. This movement was most marked in the first half of 1975 with some re-covery occurring late in the year. The Gross National Product declined by about 4.5 per cent in volume terms, reflecting the worst economic recession for over 25 years. Owing to the constraints placed on the shedding of labour by employers, the numbers of unem-ployed rose only moderately, despite the se-verity of the recession. On the other hand, short-time working and partial unemployment were considerably higher and would in turn have tended to depress demand further. The slackening of consumer demand and new orders, reinforced by the disposal of finished product stocks, contributed to a decline in in-dustrial production of about 10 per cent in 1975. But the slowing in industrial activity was perhaps not sufficient by itself to account for the much greater decline in business investment: in this respect the very tight restrictions on credit introduced by the authorities in 1974 together with a sharp reduction in profitability, undoubted-ly played a role in decisions to postpone or abandon investment planned for 1975.
attain-Table 1 -Gross fixed investment in the Community(l) (2) Percentage change from previous year
In Value In Volume
Countries
1970 1971 1972 1973 1974 1975 1970 1971 1972 1973 1974 1975
Germany 23.9 12.2 7.0 5.1 -2.1 -1.3 11.0 4.5 3.0 0.5 -8.1 -4.1
France 13.1 11.6 12.4 13.3 18.8 6.0 5.8 6.6 7.4 5.9 2.9 -4.5
United
Kingdom 9.6 10.9 11.4 19.5 17.1 23.8 2.1 2.0 2.5 2.6 -2.8 -0.5
Italy 14.2 3.7 5.8 25.3 34.1 4.3 2.7 -3.1 0.4 8.2 4.2 -12.7
Netherlands 18.3 13.4 4.0 11.5 6.3 6.1 10.1 3.3 -3.5 5.5 -4.2 -3.9
Belgium 18.6 6.4 8.9 14.6 22.3 9.3 8.4 -1.7 4.4 7.8 5.6 -3.3
Denmark 10.3 9.3 15.2 19.4 6.5 -1.1 3.0 4.4 7.9 6.1 -10.4 -11.5
Ireland 8.6 20.3 10:1 29.6 16.6 11.9 0.2 9.4 -0.2 16:4 -5.7 -5.5
Luxembourg 21.2 23.4 7.9 18.7 5.4 3.2 10.7 12.9 3.2 11.3 -7.2 -5.1
Total
Community 16.6 10.5 9.0 13.2 13.1 6.1 6.7 3.3 3.5 3.9 -2.2 -4.6
( 1) The percentages for 1975 are approximations based on orders of magnitude.
(2) For individual countries, percentages are based on amounts in national currencies. For the Community
total, amounts in national currencies have been converted into units of account at exchange rates prevailing in the relevant year.
ment of a much reduced rate of price inflation. The year-on-year increase in the consumer price index to December1975was 11.2 percent compared with a rise of 24.5 per cent during the previous twelve months. However, this improvement has proved short-lived since wage rates at end-year were increasing at a rate about double that of inflation.
As did Italy, Belgium experienced its worst economic recession since the second World War. GNP declined in constant price terms by close to two per cent in 1975 compared with a gain of four per cent in the previous year. Con-sumer demand tended to be sustained if at a low level but, as a substantial part was met by running down stocks of finished goods rather than from new output, industrial production fell by around 10 per cent. This downturn was most acutely felt in the business sector of the economy where the ensuing decline in con-fidence, coupled with lower capacity utilization and profitability, led to a reduction in invest-ment in new plant and equipinvest-ment. Because the threat of an increase in inflationary pressures still persisted, when the Belgian Government
felt compelled to adopt counter-cyclical fiscal and monetary policies, it instituted price control measures beginning in May 1975.1nitially there was a two month freeze which was subsequent-ly eased to exempt selected items. Controls had a limited success in checking inflation since the rate of increase in retail prices di-minished on a year-on-year basis from 15.7 per cent in December 1974 to 11.0 per cent in December of last year. The effort to limit the rise in prices tended to squeeze company profitability. Nevertheless the inflation rate was relatively high compared with some of Belgium's main trading partners.
Total fixed capital expenditures by all sectors of the economy declined in real terms by 3.3 per cent in 1975, after having risen by 5.6 per cent in 1974. At current prices however, total fixed capital expenditures rose by 9.3 per cent in 1975, reflecting the comparatively high rate of price inflation.
[image:8.484.59.455.91.299.2]order to check the serious growth of u nemploy-ment, official policy which in the preceding year had sought to reduce inflation and to halt the deterioration in the balance of payments shifted towards a selective restimulation of the economy. The change of attitude was made easier by falling interest rates abroad, by a de-clining rate of inflation on the domestic market and by an improvement in the external trade balance. This last feature, however, resulted from a reduction in imports rather than from an increase in exports and was in turn partly explained by a sharp contraction in domestic demand and partly by the running down of stocks of industrial raw materials, particularly of petroleum. The measures aimed at stimulat-ing the economy, on the other hand, were neutralised for a while by an increased volume of precautionary saving and it was not until the last quarter of the year that demand and, finally, output began to recover but not enough to prevent a fall of 3 per cent in the volume of Gross Domestic Product.
The weakness of demand affected business confidence to the extent that investment by private enterprises fell sharply in volume in 1975 and outweighed an increase in ment by public enterprises. Housing invest-ment was also lower in 1975 after rising rapidly to mid-1974. Only investment by public author-ities showed any real advance in 1975.1n total, fixed investment fell by 4.5 per cent in volume whereas in 1974 it rose by nearly 3 per cent.
In Denmark the impact of the economic re-cession was less than in the three foregoing countries, being mitigated to a large extent, at least in the personal sector, by government counter-cyclical policies. The decline in volume of GOP was limited to a relatively modest 1 per cent in 1975, although gross fixed investment calculated at constant prices fell a little faster than in 1974. The authorities played a very active role in introducing measures to stimulate con-sumer spending and new investment with the aim of checking the growth of unemployment. At the very beginning of 1975 direct taxes on
personal incomes were reduced, raising dis-posable income by about D.Kr. 7 milliard, and thus contributing to a simultaneous growth of consumer expenditures and personal savings. In September a major programme was instituted which included the reduction of the value-added tax rate, until end-February 1976, from
15 per cent to 9.25 per cent. This also helped to restore the volume of personal spending to where it stood before the decline which oc-curred in 197 4 but, to the extent that rising demand was met from imports, official policy did not entirely succeed. The number of reg-istered unemployed rose by about 30 per cent during the year to December 1975, though the worsening trend seemed to be flattening out by the fourth quarter. On the other hand the steps taken by the Government in the general climate of reduced economic activity had a dampening effect on earnings and price increases. The initiative of the authorities in March 1975 in freezing collective wage agreements was part-ly responsible for the lqwering of the rate of expansion in annual earnings to about 15 per cent in the year. The simultaneous freezing of company profit margins exercised a restraining influence on price rises while the temporary cut ·in VAT introduced in September lowered the consumer price index by almost 4 per cent. As a result, this index rose by only 4.3 per cent during 1975compared with 15.5 percent during the previous year.
factor in the build-up of surplus industrial capacity and in the rise of unemployment.
The Luxembourg economy suffered particular-ly from the extent of the cutbacks in the steel industry in 1975 which had an adverse effect upon unemployment, business income, invest-ment and exports, and were largely responsible for a serious 7.7 per cent decline in the volume of GOP. The steel industry provides almost 60 per cent of industrial output of the country and so the decline of 31 per cent in its production last year was severely felt, though by the end of the year an upturn in new orders indicated that the lowest point of the recession had prob-ably been passed. During 1975 the public authorities engaged on a two-pronged pro-gramme -amounting to some Flux 640 million-involving first, the promotion of selective schemes to create employment opportunities and secondly, the compensation of firms for retaining workers on a part-time basis. How-ever, industries orientated towards the domestic market, such as agriculture and the service industries, experienced rather better trading conditions which helped to soften the impact of the recession.
With the exception of public authority expend-iture programmes, gross fixed investment de-clined again last year. After a fall in volume of over 7 per cent in volume in 1974, it declined by about 5 per cent in 1975. Taking into account the relatively rapid rise in the prices of invest-ment goods, there was an increase of 7 per cent in capital expenditures at current prices compared with the previous year. Anti-infla-tionary fiscal and monetary policies in fact met with only very limited success, owing in part to the openness of the Luxembourg economy, as the consumer price index rose 10.9 per cent during the twelve months to December 1975, virtually the same as the 11.2 per cent recorded in the previous year.
The downturn of economic activity in the Netherlands last year was severe but perhaps less pronounced than in many other Community countries. At the same time certain underlying
structural problems in the economy, notably the need for higher profitability in the enter-prise sector to encourage new investment, were coming into sharper focus. In volume GOP declined by about 1.8 per cent in 1975 compared with a rise of 3.3 per cent in the pre-vious year. Much of this fall resulted from con-tractions in the volume of new fixed investment of 4.2 per cent in 197 4 and 3.9 per cent in 1975, although in both years there was a rise of between 6 and 7 per cent at current prices. The run-down of stocks in 1975 combined with a 5 per cent reduction in the volume of exports to bring about a contraction in demand for new production, as exemplified by the 7 per cent decline in industrial output last year. In certain other sectors of the economy, however, there-cession had less effect. Consumer spending, in which purchases of cars figured prominently in the early part of the year, rose in volume by 3.5 per cent in 1975- somewhat faster than the 2.5 per cent achieved in the previous year. But unemployment rose as businesses sought to cut back on labour costs which were mounting rapidly at a time of reduced output and produc-tivity. In addition there was concern as to the shortfall in employment opportunities related to investment expenditure.
the pressures on corporate profit margins by not allowing growth in nominal wage rates to compensate for the_ rise in the cost of living in the first half of the year, and restricting the growth in real wages in the second half-year to zero. Nevertheless during 1975 hourly wage rates rose by 12.5 per cent compared with a rise in the consumer price index of 10.2 per cent. This performance of wage rates last year no doubt contributed to the smallness of the decline in the rate of price inflation over the year. Manufactured exports declined in volume by about 6.5 per cent in 1975, rather more sharply than the average of world trade, a feature which raised concern about the con-tinued competitiveness of Dutch products.
In common with the rest of the Community, Germany suffered during 1975 from a severe business recession, but the economy dis-played greater strength than others as the year progressed. GNP which was still increasing, if marginally, in 197 4, declined last year by 3.2 per cent in terms of volume. The contraction of activity would have been even greater but for higher government expenditures resulting from the implementation of counter-cyclical fiscal measures. These official steps were successful to the extent that from July onwards industrial output began to rise and other signs of recovery to appear. Thus, despite the relative-ly poor out-turn for 1975 taken as a whole, a change of direction was achieved.
The volume of gross fixed investment declined in 1975 by 4.1 per cent compared with a con-traction of 8.1 per cent in the preceding twelve months. The fall in investment for two consec-utive years no doubt reflects the extent to which business confidence was undermined by the recession; in turn it contributed to the decline in activity. A further factor was the strength of price competition which developed on the domestic market and export markets in conditions of reduced demand. The volume of exports of goods and services, for example, fell by 8.7 per cent in 1975. While these dif-ficulties impeded the raising of product prices and so contributed towards overcoming
in-flationary tendencies, they often resulted in a serious erosion of profit margins and a con-sequent discouragement of business ment. A large part of the fall in volume of invest-ment was therefore concentrated in that of the business sector and the only growth in 1975 was in the Government sector but even this was much lower than in the previous year.
During the second half of 1975, however, the outlook improved in all sectors of the German economy. The public authorities introduced new measures in late August to aid in the economy's recovery, aimed particularly at the construction sector. With the strengthening of the domestic market and with a faster inflow of orders from abroad, the business sector started to raise its investment intentions in the latter part of the year. This improvement was particularly evident in the demand for machinery and equipment.
the problem was less likely to be solved by the simple stimulation of internal demand.
As external as well as internal demand in fact fell, industrial production declined sharply in the second quarter of the year and for 1975 as a whole was 4.9 per cent lower than in the pre-vious year. The deflationary incomes policy and the disposal of stocks of finished goods were further factors in reducing the need for new production although some of their impact was absorbed by a lower growth in the volume of imports. Under such conditions, unemploy-ment continued on its rising trend and by De-cember represented 5.0 per cent of the labour force compared with 3.1 per cent at the be-ginning of 1975. Some signs that the trough of the recession had been reached by early autumn had not been followed by any significant upturn by year-end. Businesses were operating below capacity throughout the year and did not need to invest. Total fixed capital investment by all sectors of the economy thus declined by 0.5 per cent at constant prices in 197 5 follow-ing a decline of 2.8 per cent in the previous year. The inability to improve profitability, either because of competitive pressures on shrinking markets or because of a system of administra-tive controls on prices and profit margins, does not seem to have been a major influence in 1975.
In Ireland a fall in volume of 6 per cent and a rise in value terms of 12 per cent in gross fixed investment in 1975 covers a wide difference between that undertaken by enterprises and by public authorities during 1975. The invest-ment plans of enterprises suffered a serious set-back from world recession. A sharp fall in domestic and foreign demand affected manufacturing and service industries at a time when non-agricultural labour incomes were rising relatively fast under the terms of the 1975 National Pay Agreement. Because de-mand was so depressed stocks were run down sharply, leading to further cut-backs in pro-duction and apparently also to a lowering of productivity. Agricultural output and exports were exceptions in an otherwise sombre picture
in that net output was over 12.5 per cent up in volume and exports rose by47 percent in value compared with 1974 but, even in this sector, demand was met partly through the running down of stocks. The net result was a fall of 1.0 per cent in GNP in volume terms, although in current price terms there was an increase of 21.6 per cent. A turning point was, however, reached during the year after approximately eight months of decline. During the remaining months a modest recovery began as industrial output and exports improved. At the same time consumer demand had become buoyant and the rise of unemployment was halted.
The combination of falling output and rapidly rising prices deterred not only domestically owned enterprises from extending their pro-ductive capacity, but also some foreigners from investing in Ireland as the inflow of private capitalwhichwas£144millionin1974dwindled to about £ 5 million in 1975. The public author-ities, on the other hand, were striving to com bat the recession by stimulating economic activity while at the same time aiming at a reduction in the rate of inflation. With these two not easily reconcilable aims in view measures were in-troduced in June in the form of cuts in value-added tax, the introduction of subsidies and increased capital expenditure. The beginning of a recovery of manufacturing output in the fourth quarter of 1975 may have been partly a consequence of these measures. The in-crease in public capital expenditure in areas such as housing, industry and telephones in 1975 was particularly marked, as a result of which total fixed investment by the public authorities probably did not fall at all in volume in 1975.
1.2. INVESTMENT IN THE COMMUNITY COUNTRIES BY SECTO.R:
BUSINESS CAPITAL EXPENDITURES, HOUSING CONSTRUCTION, AND PUBLIC AUTHORITIES INVESTMENT.
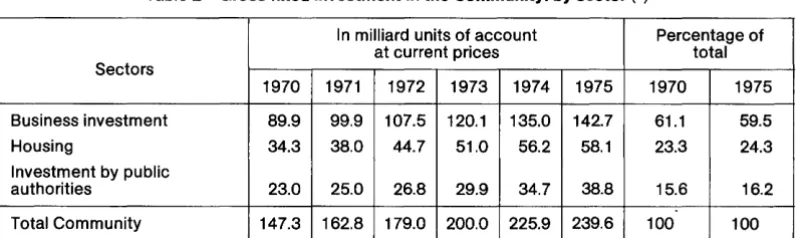
1975 in all the three sectors shown in Table 2. In the business sector, however, the increase of 5.7 per cent over1974 was well below that of prevailing rates of price increases and implies a substantial fall in volume. The reasons for this are not far to seek in the circumstances of world-wide recession; low demand, surplus capacity, low profitability, the general un-certainty of the economic outlook all no doubt played a part in influencing business decisions to cut back or postpone investment projects. In some countries, however, it seems possible that towards the end of 1975 a number of businesses were beginning to take a more optimistic view as an upturn in economic activ-ity began.
Housing construction increased by only 3.4 per cent at current prices during 1975 and so prob-ably fell more sharply in volume than business investment. In some countries the overhang of new unsold houses which appeared in the re-cent past seems to have exercised a dampen-ing influence. As regards private housebuild-ing, it seems probable that there was general reticence on the part of individuals to embark on the purchase or construction of new dwell-ings while unemployment was rising and the economic outlook remained uncertain.
As might be expected, the selective investment programmes initiated or reinforced by public authorities throughout the Community with the common aim of restimulating their separate economies resulted in a fairly sharp increase in their total capital expenditure of almost 12 per
cent during 1975. This was less than_ the 16 per cent rise recorded during the previous year but, if allowance is made for the reduction in the rate of inflation in the interval, the growth in terms of volume during the two years was probably similar.
Changes in investment in the business, housing construction and public authorities sectors in individual countries appear in Chart II while the proportions that fixed investment in these sectors form of the total is shown in Table 3. Both are represented in terms of current prices and in the circumstances of wide differences in price increases as between countries and as between sectors, Table 3 is perhaps a more reliable guide to relative performance. The combination of a shrinking proportion of busi-ness investment with a rise in the share of in-vestment by public authorities, characteristic of the trough of a recession in whiyh _official measures to restimulate activity had been brought into play, stood out clearly in most Member States. The fall in the proportion formed by business investment was particular-ly marked in the smaller countries, Ireland and Luxembourg, counterbalanced in the latter by an equally sharp rise in the share of investment by the public authorities. In Denmark also the public authorities' share increased substantial-ly. The same pattern appeared in less sharp relief in France, Italy and Belgium. In the Nether-lands, on the other hand, the business sector maintained its share while in Germany it ac-counted for an increased proportion ofthe total; in both these countries public authorities'
in-Table 2- Gross fixed investment in the Community: by sector (1)
In milliard units of account Percentage of
at current prices total
Sectors
1970 1971 1972 1973 1974 1975 1970 1975
Business investment 89.9 99.9 107.5 120.1 135.0 142.7 61.1 59.5
Housing 34.3 38.0 44.7 51.0 56.2 58.1 23.3 24.3
Investment by public
authorities 23.0 25.0 26.8 29.9 34.7 38.8 15.6 16.2
Total Community 147.3 162.8 179.0 200.0 225.9 239.6 100 100
[image:13.484.28.432.523.642.2]vestment also rose in relation to the total and only housing construction contracted. The main exception to the general pattern was the United Kingdom in which both business investment and housing construction increased propor-tionately while the share of public authorities was reduced.
In Ireland, the depressed business outlook and the squeeze on profit margins resulting from reduced output and higher costs largely ex-plain the relatively small rise of about 6 per cent in the value of gross fixed investment by enterprises in 1975. In terms of volume this meant a not surprising fall of the order of 11 per cent, there being little incentive to expand productive capacity. The building of factories and of business premises generally seems to have suffered more in this contraction than the installation or replacement of plant and machinery.
Residential construction which increased by a quarter in value in 1975 showed real growth in that the number of new houses rose by over 2 per cent. This was entirely attributable to the housebuilding activities of local authorities which, having received substantial financial support from the Central Government, rose by some 45 per cent at current prices. In the un-certain economic and financial climate, private housebuilding performed less well, falling by about 7 per cent in volume.
Apart from their effort in housing, the public authorities in Ireland increased their capital expenditure by 22 per cent at current prices. Their fixed (non-housing) investmenttherefore probably increased slightly in volume and in two areas at least, that of improving telecom-munications, and of providing capital for in-dustrial promotion, there was significant real growth.
The pattern of investment in Luxembourg dif-fered slightly from that in Ireland in that it was non-housing investments by the public author-ities rather than housing construction which offset the fall in the share of investment by enterprises.
In Luxembourg, the latter form of investment declined by about 11 per cent in volume and by one per cent in terms of current prices. Profitability was reduced and with surplus capacity becoming available as output de-clined, particularly in the steel industry, there was less incentive to undertake the installation of new plant and equipment. Consequently, capital expenditures tended last year to be limited to the replacement of obsolete or worn-out equipment. New investment by the services sector or by the publicly owned railways was less severely curtailed than in industry.
Residential construction also declined by over 20 per cent in volume in 1975, largely because the bulge in housing requirements of recent years had been met and the need for new hous-ing stabilised at a lower rate. A rise in con-struction prices of the order of 15 per cent was an additional element affecting decisions on new housing investment. New residential build-ing permits issued in 1975 declined by 42 per cent, and those for new apartments declined to an even greater extent. However, after re-strictions on the granting of mortgage credit had been eased in September there was a limited revival towards the end of the year in the number of new housing units planned.
The increased emphasis by the Luxembourg government on counter-cyclical programmes was a principal factor in raising public authority investment at current prices by about 22 per cent in 1975. This was directed mainly towards educational building and equipment, telecom-munications and infrastructural projects.
%
30
Chart II - Elements of gross fixed investment (1)
Percentage change 1975/1974 at current prices, based on amounts in national currencies
%
0
-10
Germany France United Kingdom Italy Netherlanda Belgium Denmark Ireland Investment
(') Estimates based on orders of magnitude. by Enterprises
abroad was accentuated in March by the freez-ing of gross profit margins. However, govern-ment programmes allowing accelerated de-preciation on new investments, and granting tax credits and subsidies, which were intro-duced in June and September, moderated the decline in new capital expenditures towards the end of1975. Nevertheless, fixed investment by enterprises declined by about 15 per cent at constant prices last year. Reflecting this, the amount of new industrial and commercial building commenced in 1975 was 35 per cent lower than in the previous year.
Residential construction on the other hand suffered from the consequences of the very
•
Investment of public authoritiesThe easing of restrictions on capital expend-itures by the Central Government in October 1974, and by the local authorities in August 1974 and in February of last year, as part of an overall plan to counter the rise in unemploy-ment, particularly in the construction industry, culminated in an increase of around 6 per cent in the volume of investment by the public authorities for 1975. This was the only area of investment to expand significantly. A major programme of public works totalling D.Kr. 650 million was introduced in September 1975 but much of this investment is likely to be made in the current year.
Changes in the sectoral distribution of invest-ment in France, as recorded at current prices, conformed to the general pattern, but were not so marked as in some of the smaller Member Countries. The proportion of the total formed by fixed investment by the business sector shrank by only 2 percentage points during 1975, although in volume terms this category of investment fell by 7.2 per cent in comparison with 1974. Apart from the food manufacturing industry which was able to maintain the level of its production, industries generally were working below capacity. This was largely because demand was lower but the liquidation of the excess stocks built up during 1974 also played a part. In addition profits were falling and the capacity for financing investment from internal resources seems in many instances, particularly in the steel and chemical industries, to have been impaired. As the outlook did not improve until the autumn, there was little in-centive for privately-owned businesses to en-large their productive capacity. Publicly owned enterprises, on the other hand, invested 13.1 per cent more in volume terms than a year earlier, largely because investment pro-grammes were accelerated in order to help restimulate the economy. Most of the increase was concentrated in telecommunications, energy and transport and many of the projects were related to regional development. As a result of the additional effort made by public
enterprises, the decline in investment by the business sector was limited to 7.2 per cent.
The volume of housing construction also fell during 1975, by about 5.2 per cent, as a result of lower demand. House buyers were under-standably reluctant to commit themselves to paying the higher prices demanded for new dwellings while the economic outlook remained uncertain and borrowing was relatively ex-pensive. The cost of building was perhaps rising a little less rapidly by the end of the year as inflationary pressures abated. This together with an easing of costs of borrowing from the autumn onwards probably helped to revive house purchases.
In marked contrast to the performance of other sectors, the public authorities increased the volume of their investment by about 9 per cent during 1975. This resulted from budgetary pro-visions which were aimed at restimulating the economy. The infrastructural projects that were financed in this context were related mainly to regional development programmes and laid the foundations for future industrial redeployment.
with the central bank, were progressively re-leased to the borrowers.
Residential construction was similarly affected by the legacy of high borrowing costs of the previous year, and of the difficulties in obtain-ing mortgage funds. New housobtain-ing units started were sharply lower towards the end of 1974 and during 1975 as a whole, so that work in progress was reduced last year. Construction costs of new housing had risen quite sharply in 1974 and this, in conjunction with the rent freeze in force during the year, no doubt cut into the profitability of providing new rented accomodation. Investment in new residential construction declined by nearly 10 per cent in volume terms but rose by 6.5 per cent in value. While the Central Government set aside (in August) an additional sum of Lit. 600 milliard for the promotion of social housing, it seems evident that the benefits of this injection of funds had not been felt by end-1975.
Investment expenditure by the public author-ities, in rising in value by 12.6 per cent in 1975, was the least affected by the economic re-cession. However, there was probably a small reduction in the volume of fixed investment, which would represent a continuation of the declining trend of recent years. The counter-cyclical fiscal measures introduced during the spring and summer included an amount of Lit. 1000 milliard for increasing public works (notably hospitals) but because of the inevitable time lag in activating such investment pro-grammes, they had little impact on the out-turn for1975.
In Belgium, a carry-over of investment activity in the business and housing sectors helped to soften the impact of the recession but other-wise the experience of the various sectors con-formed to the general pattern. A decline in the capacity utilization ratio from 85.1 per cent in May 1974 to only 71 per cent in October last year tended to be concentrated in certain dustries. In the steel, chemical and textile in-dustries trading conditions were particularly difficult but in contrast the automotive industry
had a good year and the services sector in general was less affected by the recession. Rising unemployment moreover did not reflect the full extent of the deterioration in capacity utilization which led to reduced productivity on account of the lower output, and was ac-companied by substantially higher labour costs and narrowed profit margins. The general outlook discouraged embarking on new invest-ment projects and the volume of capital ex-penditure would have been even less but for the completion of existing projects. In the event, investments by enterprises declined by between three and four per cent in 1975 in constant price terms; but in value terms, invest-ments rose by about seven per cent.
Table 3 -Shares of capital investment in Community countries (1)
Gross fixed investment Gross
National Sectoral shares in %
Product
Countries at current As o/o of
market gross Housing Investment
national Business
prices
product investment construe-tion by public
authorities
Germany, DM milliards 1974 997.0 22 59 23 18
1975 1 043.6 21 60 21 19
France, FF milliards 1974 1 281.0 27 61 27 12
1975 1 405.0 26 59 27 14
United Kingdom, £ millions 1974 82333 20 64 19 17
1975 103 039 20 65 20 15
Italy, Lit. milliards 1974 99056 23 58 29 13
1975 111809 21 56 29 15
Netherlands, Fl. milliards 1974 188.1 22 58 25 17
1975 204.3 21 58 24 18
Belgium, BF. milliards 1974 2105.6 22 58 28 14
1975 2348.8 22 56 29 15
Denmark, Kr. milliards 1974 186.95 22 56 24 20
1975 206.55 20 54 22 24
Ireland, £ millions 1974 2928 25 58 25 17
1975 3561 23 54 28 18
Luxembourg, Flux. milliards
1974 82.28 25 53 24 23
1975 79.34 27 51 21 28
Total Community
u. a. milliards 1974 975.6 23 60 25 15
1975 1 082.5 22 60 24 16
(1) This table is based on estimates, at current prices, of orders of magnitude. Strict comparisons of gross
fixed investment cannot validly be made because of differences of definition and composition from one Member Country to another.
a relatively low growth in real terms of 2.4 per cent in 1975 despite the extensive investment programmes put forward by the Government during the year. To some extent this tendency was due to the normal lag between the initiation of projects and the commencement of con-struction, and to some extent to delays in obtaining legislative approval for investment programmes.
In contrast to the majority of countries capital expenditure by enterprises in the Netherlands maintained its position in relation to such ex-penditure in other sectors in 1975, but its volume declined further, by about 4.8 per cent follow-ing a reduction of only 0.1 per cent in 1974. In
labour saving machinery and equipment. This often involved replacing equipment which was becoming obsolescent at an increasing pace and resulted in new investment taking place in capital-intensi"ve rather than labour-intensive industries.
The decline in the volume of residential con-struction of 6.8 per cent last year was smaller than the 12.8 per cent recorded the previous year but, as this was due to improved statistics of construction, it should not be interpreted as a slowing of the downtrend which resulted from a virtual over-supply of housing in the early part of the decade. 0 n a small scale, there has also been shift in the form of supply from new con-struction to the renovation of old houses. There were 120800 new dwellings completed in 1975 which compares with an average of about 150000 units completed in each ofthe previous three years. The number of housing units started had declined sharply in 1974 and the lower overall demand for housing continued into 1975. The reduced activity in construction, both residential and non-residential, would probably have been greater but for special government programmes to counteract this and the rise in the number of unemployed.
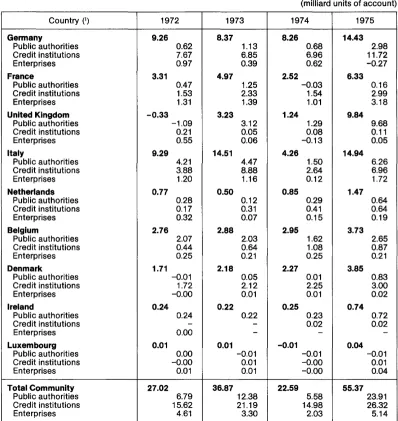
An important part of the special government measures introduced in late 1974 and early 1975 was designed specifically to boost the construction sector, often through public works programmes in economically retarded regions. There was a considerable injection of funds into the economy which contributed to an in-crease in the public sector financing require-m entfrorequire-m Fl. 5.1 require-milliard in 197 4 to an estirequire-mated Fl. 9.9 milliard last year. Nevertheless, the ex-pansion of public authority investments last year reversed a decline in this sector which had persisted for a number of years. Capital ex-penditures by the public authorities rose by 4 per cent in volume terms in 1975 and by about 14 per cent at current prices.
Business investment in Germany continued to be affected adversely during a large part of 1975 by the cyclical decline in sales and output
which had begun a year earlier, but appeared to be more resistantthan in most other Member States, including the Netherlands. It accounted for a larger proportion of total fixed investment in the German economy than in the previous year and by the last quarter of 1975 was even rising sharply in volume. The favourable in-fluence of reductions in raw material prices and a distinctly smaller wage increase in the 1975 round of wage negotiations were insufficient, at least in the earlier part of the year, to com-pensate for the effect on investment intentions of seasonally declining sales, falling output, a negligible rise in productivity and the generally uncertain economic outlook. In the second half of the year, however, the prospects for invest-ment improved as sales picked up. Investinvest-ment in machinery and equipment began to increase after mid-year and the influence carried through to industrial and commercial building during the fourth quarter. In the fourth quarter also, construction permits granted increased by around 30 per cent compared with the same period of the previous year. The investment grant scheme continued to be a major factor behind this improvement, because some build-ing permits, requested before the end-June expiry of the scheme, were not issued until the fourth quarter. Taking 1975 as a whole, how-ever, total business capital expenditures de-clined by about 3.3 per cent at constant prices. With price inflation much reduced, business investment at current prices increased by about 0.6 per cent.
Following the major effort made by the German public authorities in 1974 when they increased their fixed investment by over 20 per cent in value and about 11 per cent in volume in order to counteract recessionary influences, the further growth in investment in this sector during 1975 of 2 per cent in volume and 4.5 per cent in value was relatively modest. The very much higher public sector borrowing require-ment in 1975 at DM 65 milliard, compared with the DM 24 milliard required the previous year, was not attributable to the implementation of Government investment programmes but mainly to social security payments.
For a variety of reasons, including the general effect of a historically high rate of inflation which exceeded that in other Member Countries, the pattern of expenditure at current prices on fixed investment in the United Kingdom during 1975 differed from patterns established else-where. The share of enterprises and of house-building rose while that of the public authorities fell. In terms of volume, however, the relatively small 1.5 per cent decline in business capital expenditures covers a divergence of trends in its various sub-sectors. The volume of new investment in the m~nufacturing industries declined abruptly during 1975, by 13.9 per cent, or to about the same extent as during the pre-vious year. This reduction stemmed principally from the adverse trading conditions, in volume terms, both on the domestic market and in export sales. With the decline in industrial out-put last year, the proportion of companies re-porting their operations as being below full capacity reached a record of 78 per cent as of January 1976. In addition, the need for enter-prises to bring financial commitments more into line with their available cash flow which, despite inflation, was often no higher in 1975 than in previous years, resulted in a closer ap-praisal of the likely return on capital projects. This was made more pressing since the impact of price inflation of the order of 27 per cent on capital investment expenditures was particular-ly severe last year.
Certain measures were introduced by the government in late 1974 and during the course
of last year to boost investment, particularly in the manufacturing industries, but these seem to have had only a marginal effect in slowing the decline in business capital expenditures general-ly. Nevertheless, one area of expansion was that of capital equipment for the development of oil and gas supplies. With the onset of the production phase of North Sea development, expenditures on extraction equipment, port facilities, pipelines and processing plants for gas and oil have assumed some importance in the overall pattern of business investment in the United Kingdom. The nationalised industries also increased their capital spending in con-stant price terms by more than 10 per cent in 1975.
Residential capital expenditures last year re-covered some of the ground lost in the previous two years in rising by 6 per cent in volume and by 27.5 per cent at current prices. Private housebuilding was relatively more expansive than that of the public sector, with new housing units started during 1975 being 40 per cent higher than in the previous year compared with an increase of 13 per cent in the public sector. The private housing market thus experienced a limited recovery from the very depressed conditions existing in 1974. This improvement may have been due, in part, to the slower rise in new house prices than in previous years (and slower than the rise in incomes), and in part to the ready availability of funds from the Building Societies. Nevertheless, a relatively large stock of completed but unsold houses continued to hang over the private residential market at the end of 1975 and the volume of investment was still about one-sixth below the peak in 1972.
CHAPTER 2
FINANCING OF INVESTMENT
2.1. THE FINANCIAL BACKGROUND
The problems which had loomed large at the beginning of 197 4, inflation and the financing of large balance of payments deficits on current account, diminished in size during 1975. The rise in prices tended to moderate as demand contracted and the most serious recession since the Second World War took hold. At the same time the imports of most industrialised countries, fell in volume while the oil exporting countries began to spend their newly gained wealth more freely. This left room for a further easing of monetary and fiscal policies in de-veloped countries in the interests of restimulat-ing economic activity.
Demand for credit by the private sector re-mained weak. On the part of businesses, the uncertain outlook tended to lead to a running-down of stocks which lessened the require-ment for working capital and to an abandonrequire-ment or a postponement of investment plans. Private individuals, on the other hand, tended to hesitate over taking on new commitments while unem-ployment was rising strongly and to save a higher proportion of their incomes than in the recent past. In consequence banking systems were generally very liquid.
Against this, the increased expenditure of public authorities both on current and capital account resulted in a sharp increase in budget-ary deficits in most countries and to historically large public sector borrowing requirements. The decline in short and long-term interest rates which occurred during 1975 might have been larger but for substantial demands made by public authorities for finance from capital markets. As it was, short-term interest rates fell during 1975 to well below bond yields on all markets, re-establishing a more normal interest rate structure than that which had prevailed, in many instances, for more than a year.lnvestors
accordingly found it profitable once more to invest at longer term and towards the end of 1975 it became possible to launch bond issues with longer maturities, even if these maturities were not quite as long as those regarded as normal before the inflationary crisis.
Up to a point the performance of the inter-national capital market was similar. Short-term interest rates on euro-currency deposits de-clined appreciably in the first five months of 1975, but then rebounded for the next four months before declining again in the final quarter of the year. International syndicates were not faced, as in 1974, with demands from national authorities for massive euro-currency credits for the pre-financing of expected oil deficits though, on the other hand, they received less in the way of deposits fr~m oil exporting countries. The initial fall in short term aura-currency rates was nevertheless large enough to revive the interest of investors in the euro-bond market where the volume of issuing activity rose markedly in 1975 and perhaps ruled out the possibility of a further fall in longer term interest rates.
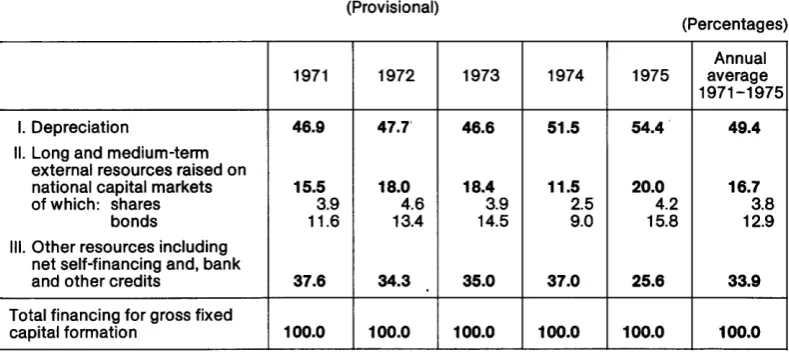
Table 4 - Methods of financing the fixed investment of enterprises in the Community (Provisional)
(Percentages)
Annual
1971 1972 1973 1974 1975 average
1971-1975
I. Depreciation 46.9 47.7' 46.6 51.5 54.4 49.4
II. Long and medium-term external resources raised on
national capital markets 15.5 18.0 18.4 11.5 20.0 16.7
of which: shares 3.9 4.6 3.9 2.5 4.2 3.8
bonds 11.6 13.4 14.5 9.0 15.8 12.9
Ill. Other resources including net self-financing and, bank
and other credits 37.6 34.3 35.0 37.0 25.6 33.9
Total financing for gross fixed
capital formation 100.0 100.0 100.0 100.0 100.0 100.0
During 1975, fiscal and monetary policies in France were directed increasingly towards re-stimulating the economy while avoiding the creation of new inflationary pressures. In recent years the budget has normally been in balance, but the need to provoke a revival of economic activity led the authorities to budget for a deficit in 1975 of F.fr. 43 milliard, equivalent to 3.4 per cent of GOP, and with more than 80 per cent of this being financed by the banking system. The main programmes covered by the additional expenditure were announced in April and Sep-tember. In April the decision was taken to inject some F.fr. 20 milliard into critical sectors of the economy of which F.fr. 1 milliard was to be allocated for lending to public enterprises; only F.fr. 6.9 milliard of the total represented new money to be obtained from sources external to the Government. Also within the overall pro-gramme, F.fr. 5 milliard was intended to be raised in the form of a joint-issue by various public institutions and carrying a government guarantee, the proceeds of which were to be devoted to the purchase of machinery and equipment for installation in productive enter-prises. The measures, totalling F.fr. 30.5 milliard, announced in September went further than the provision of finance for investment. In addition to an amount of F.fr. 15.9 milliard allocated for financing public and industrial orotherforms of productive investment, some F.fr. 5 milliard
was earmarked for stimulating consumption and the final date for the payment of company taxes amounting to F.fr. 9.6 milliard was post-poned. It seems probable that the September measures played a significant role in the bright-ening of economic prospects in the fourth quarter of the year.
Monetary policy also played an important role during 1975 in creating conditions which favoured the restimulation of the- economy. Policy had not really been restrictive during the last quarter of 197 4 but at the end of the year short-term interest rates nevertheless re-mained higher than long-term rates, standing in an inverse relationship which clearly needed to be corrected in the changed circumstances of 1975. The authorities were nevertheless anxious not to impair the progress that had been made in combatting inflation and in re-storing equilibrium in the balance of payments on current account.
by mid-year and to 2 per cent by the end of the third quarter, thus freeing a total of some F.fr. 35 milliard of resources. Increases in bank credit were permitted under a system of progressive ceilings on a monthly basis adjusted for seasonal influences. In September these ceilings were raised for financial institutions specialising in term credits in support of other measures aimed at a selective stimulation of consumer expenditure. The structure of short-term interest rates declined fairly steadily during the year and the discount rate ofthe Bank of France, having been reduced in four steps during the first six months of 1975 from 13 per cent to 9.5 per cent, was cut further in September by 1.5 per cent to 8 per cent. Meanwhile, in line with the intentions of the authorities to reduce the cost of credit to enterprises adversely affected by the recession, the easing of monetary policy induced the banks to lower their base lending rate in stages, from 11.9 per cent in January 1975 to 8.6 per cent in December. The reduction in short-term interest rates on a broad front helped to turn the attention of investors from the short-term money market to longer term placements on the bond market.
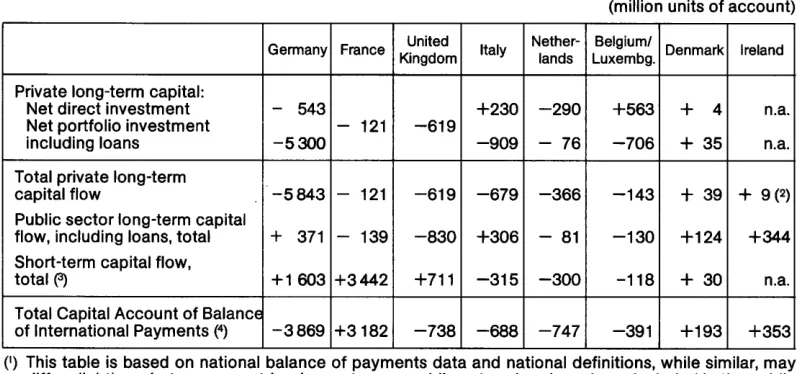
At the same time the substantial long-term capital inflow from abroad which was a feature of the balance of payments in 1974, as France sought to cover the merchandise trade deficit resulting from the increase in oil prices, dis-appeared and was replaced by a small outflow in 1975. The inflow of short-term capital was, however, larger in 1975, and by mid-year the strength of the franc facilitated its re-entry, at least temporarily, into the European currency snake.
While interest rates in the Netherlands moved downwards during 1975 virtually in parallel with those in France, the movement had very dif-ferent origins. Initially there was a carry-over of the effects of rapid monetary expansion in 197 4 and subsequently the authorities were engaged in promoting capital outflows to offset the balance of payments surplus on current ac-count. The broad objective of monetary policy towards the end of 1974 and in early1975 was
to lower the growth in the monetary aggregates, which had increased rapidly during 1974, as a part of overall anti-inflationary policy. These aims were pursued through raising the liquid reserve requirements on short-term deposit liabilities so as to reduce the margin of free liquidity of the banks, and the reintroduction of a ceiling on credit expansion was actively considered. Towards mid-1975, however, the rate of growth of credit expansion had flattened out and the authorities reduced the liquid re-serve requirement on short-term deposits .. In addition the target margin of free liquidity was raised to a minimum of 2 per cent from the 0.5-1 per cent which had prevailed since July 197 4. With a lower pattern of loan demand from the private sector the banking system became highly liquid from mid-May onwards. The con-sequent decline in interest rates helped the authorities in persuading the banks to place funds abroad, thus increasing their net foreign assets.ln this way it was hoped to avoid a major increase in the country's official external re-serves which would otherwise result from the excess of the current account surplus in the balance of payments over the expected capital outflow. The outflow of funds was also actively encouraged by the opening at mid-year of the capital market to public placements by foreign governments and private borrowers (private placements had been allowed previously). Around the same time the local authorities were granted direct access to the capital market instead of being required, as in the pre-ceding ten years, to seek funds only from certain specialised credit institutions.
by October the demand for credit was reviving in the Netherlands and the banks' obligatory reserves were again reduced to zero.
Interest rates declined in Germany between the beginning and end of 1975 but not without some tension in the third and part of the fourth quarter. A further decline in the rate at which prices were increasing left the authorities with room for manoeuvre in their attempts to re-stimulate the economy. In the field of monetary policy, the discount rate of the Bundesbank was reduced in stages between February and Sep-tember by two and a half percentage points to 3.5 per cent. During the same period the Bun-desbank's Lombard rate for advances against security was brought down even further, from8 per cent to 4.5 per cent. These moves which were sometimes synchronised with increases in discount ceilings or releases from the banks' legal reserve requirements were aimed initially at persuading the banks to reduce their interest rates on term loans which had come down less than the interest rates which they had offered on their deposits. The money supply, widely defined (M 3), nevertheless grew relatively slowly at a seasonally adjusted annual rate of 3.4 per cent during the first half of the year for which slackness of loan demand from the busi-ness sector was largely responsible.
Towards the middle of the year, however, in-vestors began to expect an up-turn in long-term interest rates. The main reason was the fear that an additional strain would be placed on the bond market by the covering of financial deficits in supplementary budgets introduced by the Federal Government and some of the Lander. Investors were also disturbed by a temporary rise in the rate of inflation around mid-year. A third factor was a rise in long-term interest rates in some external capital markets. In order to give the bond market an opportunity to regain its strength, it was closed to new issues by public sector borrowers from 11 July until almost the end of the year. The Federal Government announced plans for improving the structure of its budget and for avoiding deficits over a period of several years but,
during the suspension of new issues, it covered its borrowing requirements by placing debt certificates and Treasury bills with financing institutions up to August and by resorting there-after to obtaining loans from the banking system. An increase in money supply (M 3) during the second half of the year at an annual rate of 13.8 per cent eased the task of the public authorities in raising the necessary finance.
The impact of external transactions during 1975 on the capital market was quite minor. The reduction over the year as a whole of the net outflow of capital was partly attributable to the steps taken at the end of August to allow banks to pay the same interest rates on non-resident deposits as on non-resident deposits, and to borrow abroad on behalf of public authorities through placings of notes, though it is a little early to judge the precise effect. Thus the open-market operations of the Bundesbank to which the authorities found it necessary to resort during the third and part of the fourth quarter were occasioned mainly by the weakened confidence of domestic investors. These open-market operations which reached a total of OM 8 milliard by the time they were suspended in the fourth week of October, were success-ful in that they prevented yields on bonds issued by public sector borrowers from rising more than marginally on the secondary market. When towards the end of the year public sector borrowers were again permitted to launch new bond issues, a part of the public sector's financial requirements for 1976 had been covered and the market itself was in better shape, being willing to accept longer-dated securities than previously.
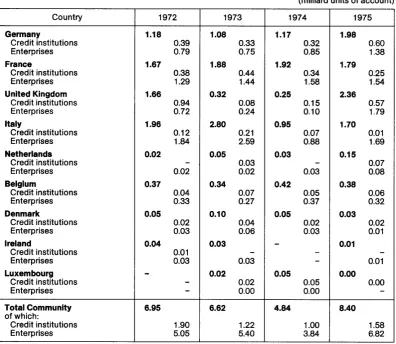
Table 5 - Financing of the non-government sector from the domestic market
and banking sources
{milliard units of account)
Country 1972 1973 1974 1975
Germany 30.63 27.50 23.65 17.42
France 22.09 22.53 24.16 27.88
United Kingdom 21.67 20.73 14.07 8.36
Italy 15.75 20.97 14.13 18.42
Netherlands 5.17 6.75 8.10 7.94
Belgium 2.92 3.35 3.61 4.22
Denmark 2.77 3.51 3.07 3.44
Ireland 0.68 0.59 0.42 0.53
Luxembourg -(a) 0.18 0.28 0.28
Total
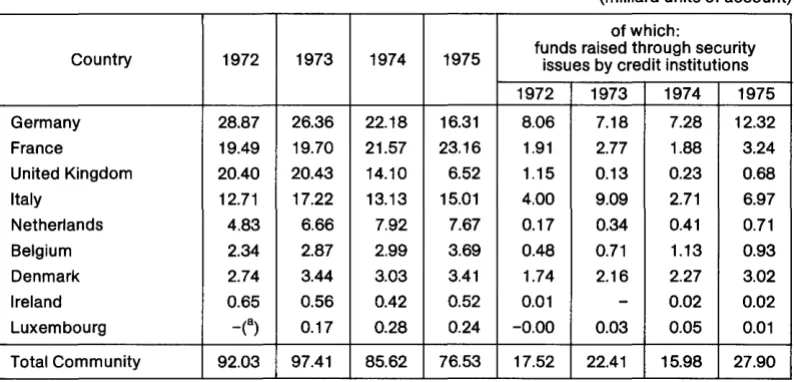
Community 101.68 106.11 91.49 88.49
of which: shares 5.05 5.40 3.84 6.82
bonds 4.61 3.30 2.03 5.14
short, medium and long-term
credits 92.03 97.41 85.62 76.53
(a) Estimates are incomplete
commitments rose moderately, actual utiliza-tion of credit lines barely increased at all owing to the slowing in business activity. On the other hand there was extensive liquidity in the finan-cial system as personal savings were ex-ceptionally high in 1975. The ready availability of funds, combined with the low demand for credit, enabled the financial institutions to take up a much larger amount of new issues on the bond market at interest rates below those of the previous year. Much of the liquidity stemmed from the sharp increase in the Central Govern-ment's budget deficit. The need to finance this in a non-inflationary manner prompted the Government to embark on a very large D.Kr. 6 milliard programme of bond issues under the favourable conditions which existed during the summerandearlyautumn.Asafurthermeasure to reduce liquidity, the banks were required from November until the end of the fiscal year at the end of March 1976 to place special re-serve deposits with the central bank.
An important facet of Danish monetary policy in recent years has been the need to maintain
a strong inflow of capital from abroad in the form of business and financial loans to the private sector. This has been necessary to off-set the current account deficit of the balance of payments and to maintain the country's ex-ternal reserves. Thus, the monetary authorities have had to maintain a delicate balance in credit policy, in providing adequate liquidity to finance a revival of activity while not allowing interest rates to fall too far.lf too easy, terms for borrow-ing on the domestic market could encourage some switching from foreign markets.
The next three countries, the United Kingdom, Ireland and Italy also experienced a decline in interest rates during 1975, though they were grappling with rather more serious inflationary problems than others. In the United Kingdom, the financial setting last year was dominated by the extent of price inflation, and its con-sequent impact on financial assets and on the external competitive position. As noted in an earlier section, retail prices rose by 25 per cent in 1975, which was at least twice as much as in any continental Community country. Capital markets, however, provided more funds than in 1974. Individuals greatly expanded their savings with the financial intermediaries even though there was a negative real rate of return. The external financing requirements of in-dustrial and commercial companies were sub-stantially reduced through cutting back ex-penditures on fixed investment and not re-placing stocks. Capital markets were also aided, more particularly from mid-year on-wards, by greater optimism that the govern-ment's incomes policy would be successful and that inflation would decline.