An Efficient Scheme for Aggregation and Presentation of
Network Performance in Distributed Brokering Systems
Gurhan Gunduz
[email protected]
Department of Electrical Engineering & Computer Science, Syracuse University
Syracuse, NY 13244
Shrideep Pallickara and Geoffrey Fox
{spallick and gcf} @indiana.edu
Community Grid Labs, Indiana University
Bloomington, IN 47404
ABSTRACT
The Internet is presently being used to support increasingly complex interaction models as a result of more and more applications, services and frameworks becoming network centric. Efficient utilization of network and networked-resources is of paramount importance. Network performance gathering is a precursor to any scheme that seeks to provide adaptive routing capabilities for interactions. In this paper we present a network performance aggregation framework that is extensible and appropriate for distributed messaging systems that span multiple realms, disparate communication protocols and support different applications.
Keywords: performance aggregation, network monitoring, distributed messaging, performance forecasting, publish /subscribe systems.
1. INTRODUCTION
The predominantly passive interaction model, with interactions initiated by clients and driven by web servers running on the ubiquitous port 80, though still accounting for a large share of the data being routed to clients has found its share reduce considerably. The Internet is presently being used to support increasingly complex interaction models as a result of more and more applications, services and frameworks becoming network centric. The entities, with which applications and services need to interact, span a very wide spectrum that includes desktops, PDAs and other handheld devices, appliances, and other networked resources. Furthermore, supported clients have transient connection semantics and are themselves originators of voluminous content.
Services are usually implemented on a distributed network of routing nodes, with each routing node making decisions regarding the route requests or responses take en route to their final destination(s). The processing and servicing of requests is itself a distributed problem that involves several nodes and the links that connect them. As the scale of the system increases effective interactions between clients and services, in these settings, is dictated not just by the processing power of the nodes hosting a specific service but also by the network cycles expended during these interactions.
Network usage has generally not been metered, at least not in terms of network accesses and the amount of bytes that have been sent over communication channels. Service providers
relying on faster processors have ignored premiums associated with network utilizations. Under conditions of high load, visible degradations in response times are attributed to network clogging (a feature out of hands-on control) and it is expected that these response-times would improve either due to an attenuation of network traffic or due to advances (long-term) in networking technology.
Moore’s law while ensuring that the nodes in the network fabric would be more and more powerful provides no such solace as far as network usage goes. Bandwidths, though they will improve (at comparatively lower rates), would always be outstripped by demand. Furthermore, depending on the popularity of the service, there is seldom any attenuation in the network traffic directly controlled by the service.
Poor solutions to network utilizations lead to buffer overflows, queuing delays, network clogging and other related problems that add up considerably over a period of time. Straitjacketing clients by allowing a fixed set of accesses, preventing certain types of interactions, limiting the type of content that is routed to them or even restricting accesses to a fixed number of clients is not the solution.
Although multicasting and bandwidth reservation protocols such as RSVP [1] and ST-II [2] can help in better utilizing the network they require support at the router level, more conceited effort is need at higher levels. There needs to be a conceited effort to ensure the efficient utilization of networks and networked resources. The onus of providing an efficient service that takes network conditions into account rests with the middleware.
The middleware thus has to ensure that its routing strategy adapts to changing network conditions, while eschewing decisions that lead to congestion and concomitant problems. To arrive at such intelligent decisions what is needed is the ability to snapshot the state of middleware network fabric, which is a precursor to empowering routing solutions. We may enumerate issues to be addressed within the distributed middleware pertaining to gathering this network state:
1. Link Metrics: This pertains to the ability to measure
performance metrics on communication links originating from a node.
2. Non-intrusive measurements: Information should be
3. Protocol and metric independence: The communication links should not be constrained to work with any specific transport protocol. Also, communication links will report different performance metrics.
4. Accumulating link metrics: A node should be able to
expose all the performance metrics accumulated over all the communication links originating from that node.
5. Aggregation of node metrics: Performance aggregator
instances would aggregate performance information from multiple nodes (usually from a certain realm) and thus provide information regarding the state of the fabric at that realm.
6. Support for multiple aggregator instances: The entire
distributed middleware would possibly span multiple domains and realms controlled by different administrators. It is entirely conceivable that administrators of certain realm would restrict access to performance metrics gathered within its realm. Routing within the realm would then be done by metrics aggregated within that realm. 7. Assimilate performance data from other services: Ability
to integrate information from other network monitoring services is also needed. Different networking monitoring services measure different metrics, which could also be used in arriving at better decisions.
8. Knowledge Discovery: The aggregated performance
information should be amenable to discovering information that would aid routing algorithms.
9. Reporting scheme: Network administrators should be able to specify thresholds on specific or a combination of performance metrics. A reporting scheme would then alert administrators when these thresholds have been reached.
We base our investigations, for providing a performance aggregation framework, on our advanced research prototype NaradaBrokering [20-28]. The smallest unit of this messaging infrastructure is able to intelligently process and route messages while working with multiple underlying communication protocols. We refer to this unit as a broker, where we avoid the use of the term servers to distinguish it clearly from the application servers that would be among the sources/sinks to messages processed within the integrated system comprising the messaging infrastructure and applications. For our purposes (registering, transporting and discovering information), we use the term events/messages interchangeably where events are just messages − typically with time stamps. NaradaBrokering provides an interesting test bed for our investigations since it supports traditional client-server, distributed and peer-to-peer (P2P) [3] interactions. Current research in NaradaBrokering is also focused on deploying the distributed brokering system to federate multiple service realms, which provides Grid based services or traditional Web services. In addition to the reasons enumerated earlier, the performance aggregation infrastructure needs to be in place in NaradaBrokering for reasons itemized below:
1) State of realms: NaradaBrokering infrastructure would
span multiple realms. Having an aggregation infrastructure in place would allow us to track the state of different realms. The state of the broker network, in a certain realm, provides an excellent indicator of the state of that realm.
2) Deployment of interactions: NaradaBrokering supports
different types of interactions, some of which are funneled through the broker network and some of which are P2P interactions over the edge of the network. These interactions are fundamentally different, and utilize networks differently. Based on the state of the network
reflected in the aggregation framework, decisions can be made regarding the deployment of different types of interactions.
3) Best available broker: NaradaBrokering provides users
with access transparency, where services hosted on the brokering system can be accessed from any broker. The aggregated information can be used to identify the best available broker node, within a realm, that a client could connect to.
4) Application specific support: NaradaBrokering has been
deployed to support real time audio/video conferencing and also in distance education based collaboration systems. Different applications utilize networks and transport protocols in different ways. Knowledge of the state of the network is a precursor to deploying transports efficiently for different applications.
The remainder of this paper provides details pertaining to implementing the aggregation service within the distributed NaradaBrokering system. This paper is organized as follows. Section 2 provides an overview of the related work in this area. In section 3 we provide an overview of the NaradaBrokering System. In section 4 we outline the NaradaBrokering transport framework. The transport framework should be such that it abstracts transport details while ensuring that each link is amenable to performance monitoring. The transport framework is crucial to enabling performance monitoring/aggregation and incorporating strategies to alleviate network congestion. Details pertaining to performance aggregation and monitoring are discussed in section 5. Finally, we outline future work that would build on the work described in this paper.
2. RELATED WORK
There are many efforts in the area of Internet measurement. IP Provider Metrics, which is a subgroup of IETF’s Bench Marking Working Group (BMWG), is trying to develop a set of standard metrics that can be applied to the quality, performance and reliability of Internet data delivery services [4]. Cooperative Association for Internet Data Analysis (CADIA) [5], a collaborative effort in engineering and maintenance of the Internet, provides and analyses measurement tools currently available. The Network Weather System (NWS) [6, 7] collects end-to-end throughput and latency information and uses that information to forecast future performance. Metrics are collected by sensors, which are organized as a hierarchy of sensor sets called cliques in order to prevent contention and also to provide scalability. The measurement intervals can be adjusted so that intrusiveness is limited while ensuring scalability. The sensor interface in NWS is designed such that it can easily incorporate data from other network performance tools. In addition to network metrics, collected over the TCP/IP transport protocol, NWS also accumulates CPU and available non-paged memory information from various nodes.
In [8, 9] congestion and bandwidth of the links are measured by actively probing the network between designated hosts. The two tools deployed for achieving this are bprobe and cprobe. Bprobe measures the maximum possible bandwidth along the bottleneck link of a given path, while Cprobe estimates the current congestion along the same path. All measurements are non-intrusive.
network state. Remos maintains both static and dynamically changing information and is based on SNMP measurements on the router nodes in the network. It has two main components, a
collector and a modeler. The collector process in Remos
retrieves information from routers using SNMP, while the modeler is a library that satisfies application requests based on the information provided by Collector. Remos’ API for accessing the information is similar to that provided by Globus MDS [11] and Legion Resource Directory [12] but mostly focused on network information.
Topology-d [13] is a service which periodically computes end-to-end latency and available bandwidth and uses that information to estimate the state of the network and the networked resources. Topology-d computes the logical topology of a set of internet nodes and conducts a series of performance experiments (TCP, UDP). The gathered performance data is then used to provide resource scheduling mechanisms such as AppLeS [14], SmartClients [15] and MARS [16]. The performance graph Topology-d produces is calculated relatively infrequently (once per hour). Netperf [17] is a throughput measurement tool. TReno [18] is another measurement tool which tries to measure bulk transfer capacity of network links. Pathchar [19] is a tool for internet performance monitoring and analysis.
3. NARADABROKERING
To address the issues [27] of scaling, load balancing and failure resiliency, NaradaBrokering [20-28] is implemented on a network of cooperating brokers. Brokers can run either on separate machines or on clients, whether these clients are associated with users or resources. This network of brokers will need to be dynamic since we need to service the needs of dynamic clients. The distributed cluster architecture in NaradaBrokering results in the creation of small-world [29, 30] networks which allows us to support large heterogeneous client configurations that scale to arbitrary size.
Communication within NaradaBrokering is asynchronous and the system can be used to support different interactions by encapsulating them in specialized events. Clients reconnecting after prolonged disconnects, connect to the local broker instead of the remote broker that it was last attached to. This eliminates bandwidth degradations caused by heavy concentration of clients from disparate geographic locations accessing a certain known remote broker over and over again.
NaradaBrokering goes beyond other operational publish/subscribe systems [34-39] in many ways (support for Java Message Service (JMS) [31], P2P interactions, audio-video conferencing, communication through firewalls among others). Grid Services (including NaradaBrokering) being deployed in the context of Earthquake Science can be found in [25]. NaradaBrokering supports both JMS and JXTA [32, 33] (from juxtaposition), which are publish/subscribe environments with very different interaction models. In addition to this NaradaBrokering provides support for RTP (A Transport Protocol for Real-Time Applications) [40], which allows it to support audio/video conferencing for RTP clients.
4. NARADABROKERING’S TRANSPORT FRAMEWORK
Here we consider the communication subsystem, which provides the messaging between the resources and services. Distributed messaging infrastructures thus must manage communication between external resources, services and clients to achieve the highest possible system performance and reliability. We suggest that we only need solve this problem “once” i.e. that all communication – whether TCP/IP, UDP, RTP, RMI, XML/SOAP [41] or you-name-it be handled by a single messaging or event subsystem. In the distributed NaradaBrokering setting it is expected that when an event traverses an end-to-end channel across multiple broker hops or
links the underlying transport protocols deployed for
communications would vary. The NaradaBrokering Transport framework aims to abstract the operations that need to be supported for enabling efficient communications between nodes. These include support for:
1. Allowing easy addition of transport protocols within the framework.
2. Allowing for deployments of specialized links to deal with specific data types.
3. Negotiating the best available communication protocol between two nodes
4. Allowing for adaptability in communications by responding to changing network conditions.
5. Accumulating performance data measured by different underlying protocol implementations.
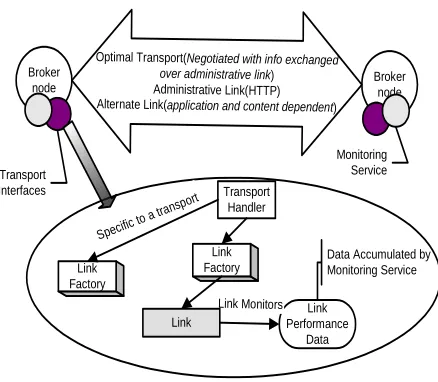
Operations that need to be supported between two communication endpoints are encapsulated within the “link” primitive in the transport framework. The adaptability in communications is achieved by specifying network constraints and conditions under which to migrate to another underlying protocol. For e.g. a UDP link may specify that when the loss rates increase substantially communication should revert to TCP. Though there is support for this adaptability in the transport framework, this feature is not yet implemented in the current release. Figure 1 provides an overview of the NaradaBrokering transport framework.
TCP, UDP, Multicast, SSL, HTTP and RTP based implementations of the transport framework are currently available in NaradaBrokering. It is also entirely conceivable that there could be a JXTA link, which will defer communications to the underlying JXTA pipe mechanism. NaradaBrokering can also tunnel through firewalls such as Microsoft’s ISA [42] and Checkpoint [43] and proxies such as iPlanet [44]. The user authentication modes supported include Basic, Digest and NTLM. A comprehensive discussion of the NaradaBrokering transport framework can be found in Ref [45].
Link Performance
Data Transport
Handler
Link Factory Link
Factory
Specific to a tran
sport
Link Monitors
Broker node
Transport Interfaces
Broker node
Monitoring Service Optimal Transport(Negotiated with info exchanged
over administrative link) Administrative Link(HTTP) Alternate Link(application and content dependent)
Link
[image:4.612.62.281.48.239.2]Data Accumulated by Monitoring Service
Figure 1: Transport Framework Overview
Each implementation of the Link interface can expose and measure a set of performance factors. Measurement of performance factors over a link requires cooperation from the other end-point of the communication link; this particular detail should be handled within the Link implementation itself. How the Link implementation computes round trip delays, jitter factors, bandwidth, loss rates etc. should be within the domain of the implementer. The Link also has methods which enable/disable the measurement of these performance factors. Links expose the performance related information in the
LinkPerformanceData construct using which it is possible to retrieve information (type, value, description) pertaining to the performance factors being measured.
5. PERFORMANCE MONITORING AND AGGREGATION
The monitoring and aggregation framework is integrated within the distributed NaradaBrokering framework. This integration will allow brokers, individually or collectively, to make decisions on the best possible approach to route packets based on the state of the network fabric and the type of interactions being routed. The performance monitoring scheme within the distributed broker network needs to have two important characteristics. First, it should be able to work with different transport protocols with no straitjacketing of the performance factors being measured. The Link and LinkPerformanceData
primitives that abstract transport details and performance data respectively, as outlined in the preceding section, ensure the ability to work with unlimited performance factors over different transport protocols. Different nodes, with different types of links originating from them, can end up measuring a different set of performance factors. Second, the scheme should be to federate with other network measurement services such as NWS.
5.1 Gathering performance metrics over a Link
Metrics computed and reported over individual links, originating from a given broker node, include bandwidth, jitter,
transit delays, loss rates and system throughputs. To measure performance metrics over a link, cooperation is needed at both
ends of the link. A lot of metrics rely on measurements that require echo behavior from the sink end of the link. For example, the easiest way to measure transit delay over a link is to send a message with a timestamp, and have this message echoed back from the sink end of the link. This obviates the need for clock synchronizations and also the need to account for clock drifts. Each node between which a link is established has the option to reset the intervals at which performance measurements are made. Furthermore, each node also has the option to turn off measurement of metrics over the links.
Factors are measured in a non-intrusive way in order to ensure that the measurements do not further degrade the metrics being measured in the first place. Factors such as bandwidth measurements, which can pollute other metrics being measured, are measured at lesser frequencies. Furthermore, once a link is deemed to be at the extreme ends of the performance spectrum (either very good or very bad), the measurement of certain factors are turned off while other metrics are measured at a far lower frequency. Each link can measure and report a different set of performance metrics. For e.g. loss rates are an important metric for UDP communications but an insignificant one for TCP. Similarly, depending on the type of application data being routed over a link, the link may be called upon to enable or disable the measurement of certain metrics. The jitter metric, for example, is an important metric for audio/video conferencing applications but is not very relevant in the context of text messaging.
5.2 Accumulating performance metrics for a Node
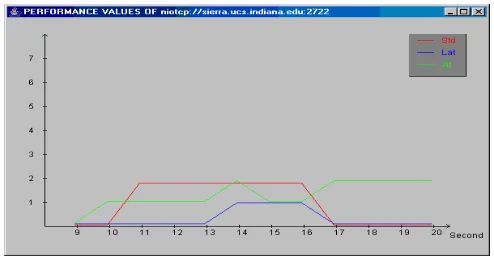
Every broker in NaradaBrokering incorporates a monitoring service (as shown in Figure 2) that monitors the state of the links originating from the broker node. The TransportHandler
[image:4.612.339.559.478.616.2]within the NaradaBrokering transport framework maintains a list of all links originating from a node. The Monitoring Service cycles through this list of links at regular intervals to retrieve performance information from each link. Since each link is assigned an ID, the performance data can be associated with specific links. Monitoring service has an interface as shown in figure 3. It can also show the chart of the performance values of a link as shown in figure 4.
Broker Node
Link Data
Broker Node Link Data Performance Aggregation
Service
Aggregates info from nodes in a certain domain
Monitoring Service
Control Exchange Message
Figure 2: Aggregation Service Overview
control the frequency at which individual links measure and report performance data. Since the monitoring service deals with Link instances which abstract transport details, the monitoring service is not constrained by the transports that it measures. The monitoring service at individual broker nodes is akin to sensors in NWS.
[image:5.612.52.299.281.410.2]Figure 3: Monitoring Service Interface
Figure 4: Chart of Link Performance Values
Each monitoring service instance is configured to report performance data, measured over links originating from a node, to a performance aggregator. The performance aggregator node aggregates information from monitoring services running at multiple nodes. The performance aggregators exchange information with the monitoring services pertaining to the measurement and reporting of performance factors. For example, the aggregator can instruct the monitoring service running at a broker node to stop (or modify the intervals between) the measurement of certain metrics. Similarly, an aggregator may instruct the monitoring service to report only certain performance metrics and that too, only if the factors have varied by the amount (absolute value or a percentage) specified in its request. The monitoring service at a node can in turn direct links to disable (or vary the intervals for) measurements of certain metrics. Performance aggregators monitor the state of the network fabric at certain realms.
5.3 Aggregating performance metrics from multiple nodes To gather state of the network fabric that spans multiple realms, the aggregators themselves may exchange information with each other. Figure 5 depicts the scenarios where multiple aggregators monitor different realms and also exchange performance information with each other. Since link implementers in NaradaBrokering can measure any metric over their implementations, performance aggregation is not constrained to a specific subset of transport protocols.
Furthermore, individual monitoring services can themselves use a variety of transport protocols, to report data to the aggregator. An added feature would be to allow administrators to monitor specific realms or domains.
5.3.1 Encapsulating performance data
The monitoring service that runs at every node encapsulates performance data gathered from each link in an XML structure. XML is a structured document format, in that it represents not only the information to be exchanged, but the metadata encapsulating its meaning, and the structure of the information to be exchanged. XML’s data encapsulation properties allow us to access relevant fields in the performance data easily. Tags, attributes and element structures provide context information, which can then be used to interpret the meaning of the content which provides intelligent data mining. Also, considering the volume of data that would be aggregated, XML’s data description capabilities allow us to mine the data efficiently and effectively.
This encapsulation also enables to deploy sophisticated XPath queries to diagnose network conditions and also to specify thresholds on metrics for administrator notifications. We are also investigating issues pertaining to storing the aggregated performance metrics in a light weight XML database. Knowledge discovery can be achieved by issuing queries to these distributed XML databases.
PAS Control Message
Exchange
Aggregates info from nodes in a certain domain Monitoring
Service
PAS
PAS
PAS Broker
Node
PAS info interchange
Figure 5: Multiple Performance Aggregators monitoring different domains/realms
5.4 Accumulation of data in a portal
Once data is accumulated at an aggregated node, this data needs to be available to interested entities. There are two important issues pertaining to the access to this data. First, there is the issue of easy access to this data. Users should be able to access this aggregated information from disparate locations. Enabling access to this information through browsers (which are now available even for hand-held devices) would be an excellent choice while also obviating the need to develop proprietary solutions to view the data.
[image:5.612.327.560.324.510.2]some users may need information pertaining to the broker nodes that they manage. This calls for presenting different views of the aggregated data to different users.
Portals fill this need of easy accessibility and restricted views to the same data sets. Information accumulated within the aggregators will be made accessible to users via a portlet residing in a portal. A portal is a system that gathers a variety of information sources and services into a single Web page, while portlets are specialized modules that plug into and run inside a portal. A portlet and a servlet are the same thing, where servlet is an application within a Web server and a portlet is an application within a portal. Portlets can contain variety of information such as sports scores, world news and stock quotes. Portlets interact with web clients indirectly through portals using a request/response paradigm implemented by the portlet container (HTTP). Multiple portlets can be assigned to one or more portals. Portlets are stored in portlet catalog where users can browse and add them into a desired location in their own portal pages and configure them to display personalized content. Portlets are developed, managed and displayed independent of other portlets. Portals provide API’s for portlet creation.
There are many commercial portal environments available from companies such as IBM, Sun, Microsoft and BEA Systems Inc. Beside those there are also free and open source portal implementations available. We are currently using Apache Jetspeed Enterprise Information Portal[46] as our portal environment. We chose Jetspeed because it is free and open source, which makes custom modifications possible.
5.4.1 Advantages of using portals to display information Portals can display multiple HTML code generated by entities. Portals can also collect content from disparate remote sources such as HTML, XML and images into one page. Besides sophisticated session management, portals also facilitate customized user and group views. The latter feature allows us to restrict access to network performance data by ensuring that different users/groups have access to different features of the aggregated performance metrics. Some entity, either user or group, may thus have access to the entire performance set, while others may have access only to usage patterns or specific metrics or a subset of the aggregated performance data.
5.4.2 Viewing the aggregated performance data
There are two different approaches that can be deployed to view aggregated performance data in the portal environment. The first approach would be to use the XSLT portlet, which comes with the Apache Jetspeed Enterprise Information Portal, to access the XML data created by the performance aggregator, convert it into an HTML file using the given XSL style sheet and display them inside the portal. Jetspeed provides for grouping of portlets under a given name. This is useful for providing customized views of the performance metrics. Details pertaining to the viewing of aggregated network performance data inside portals while providing customized user views can be found in Ref [47]. Another approach is to write a customized portlet, which accesses an XML database to retrieve the performance metrics, process the XML data and then display it in a portal. The feature would be useful while dealing with light weight distributed XML databases, outlined in an earlier section.
5.5 Federating with other network performance monitoring services
Since the information returned to the aggregators encapsulated in an XML structure, it is very easy to incorporate results gathered from another network monitoring service such as NWS. All that needs to be done is to have a proxy, residing at a NWS node that encapsulates the monitored data into an XML structure. This proxy can then report this data measured by NWS to the aggregator node, which would use this data for knowledge discovery. Administrators can also specify thresholds on metrics measured by other network monitoring services such as NWS.
5.6 Determining the best available broker
Based on the aggregated information it should be possible to determine the best broker that a client can connect to within a certain realm. Scaling algorithms, which add new brokers to deal with increased load, would benefit greatly from this strategy by incorporating newly added broker nodes (which would be among the best available brokers to connect to) into the routing solution. A similar scheme was employed in our broker locator strategy outlined in [24].
5.7 Monitoring and Portal Overheads
In this section we report on our experiments. The experiments were performed on a Windows 2000 machine (Pentium-4, 1.5 GHz, 512 MB) and all the processes involved ran using the Java 1.4 JRE VM. In our experiments we simulate the presence of multiple links (sometimes reaching several thousands) since it would be infeasible to actually set up the large number of links that we deal with in our experiments. Also, in our experiments the portal is running on the same machine where the database file is on. There is thus no network delay to load the database file.
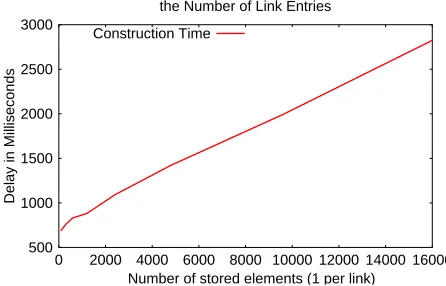
[image:6.612.328.551.531.674.2]For our experiments we did three different kinds of measurements, First, we measured the time for constructing the W3C Document Object Model from an XML file. The time associated with this construction varies with the number of XML elements in the file, which corresponds to the number of links whose information has been aggregated. Figure 6 depicts the W3C Document creation time as a function of the number of elements in the XML file. The cost varies from 691 milliseconds for an XML file with 100 elements (representing 100 links) to 2.824 seconds for an XML file with 16000 entries.
Figure 6. Document construction time 500
1000 1500 2000 2500 3000
0 2000 4000 6000 8000 10000 12000 14000 16000
Delay in Milliseconds
Number of stored elements (1 per link) Document Construction Time as a Function of
the Number of Link Entries
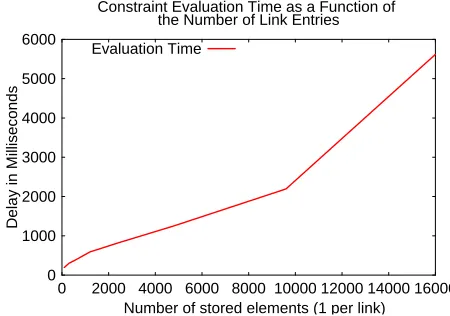
Figure 7. Query evaluation time
[image:7.612.62.279.386.540.2]Second, we measured the time to evaluate typical queries based on different number of links in the aggregated data. The graph in Figure 7 depicts this increase in evaluation time corresponding to increases in the number of entries in the XML flat-file. The evaluation operation can of course be optimized considerably by evaluating queries only for those links (each with a unique link ID) whose values have changed. In our earlier work we had incorporated a scheme where monitoring nodes would report data about links, only if there is a certain percentage change from its last reported data. This optimization would allow us to reduce query evaluation time very significantly.
Figure 8. XSL transformation time
Finally, we include timing delays associated with time it takes the XSLT portlet to transform an XML file into the corresponding HTML file using a given XSL style sheet. Figure 8 depicts the time needed for this transformation.
6. FUTURE WORK
The aggregated XML performance data (from the monitoring service at each node and other third-party services) would be mined to generate information, which would then be used to achieve certain objectives.
a) The ability to identify, circumvent, project and prevent system bottlenecks: Different transports would reveal this in different ways. As system performance degrades UDP loss rates may increase, TCP latencies increase. Similarly as available bandwidths decrease the overheads associated with TCP error correction and in order delivery may become unacceptable for certain applications.
b) To aid routing algorithms: Costs associated with link
traversals in broker network maps (BNMs) would be updated to reflect the state of the fabric and the traversal times associated with links in certain realms. Routes computed based on this information would then reveal "true" faster routes.
c) To be used for Dynamic topologies to address both (a) and (b): The aggregated performance information would be used to identify locations to upgrade the network fabric of the messaging infrastructure. This upgrade would involve brokers/connections be instantiated/purged dynamically to assuage system bottlenecks and to facilitate better routing characteristics. Dynamic topologies coupled with efficient routing protocols can help in the efficient utilization of network resources.
7. CONCLUSIONS
In this paper we discussed the need for network performance monitoring and aggregation. We described the performance aggregation framework within NaradaBrokering. The scheme can also incorporate results from other performance monitoring services. Metrics measured are not constrained in any way, and the scheme works with different protocols in a heterogeneous network environment. Since the aggregated data is encapsulated in XML, mining the data to reveal network diagnostics is easy to achieve.
8. REFERENCES
[1] Zhang, L. et al. “ReSource ReserVation Protocol (RSVP) – Functional Specification”, Internet Draft, March 1994. [2] Topolcic, C., “Experimental Internet Stream Protocol:
Version 2 (ST-II)”, Internet RFC 1190, October 1990. [3] Oram, A. (eds) 2001. Peer-To-Peer: Harnessing the Power
of Disruptive Technologies. O’Reilly, Sebastapol, CA 95472.
[4] IETF Benchmark Working subgroup:
http://www.ietf.org/html.charters/ippm-charter.html [5] CAIDA http://www.caida.org/tools/
[6] R. Wolski, N. Spring, and C. Peterson. Implementing a performance forecasting system for metacomputing: The Network Weather Service. Tech. Rep. TR-cs97-540, University of California, San Diego, May 1997.
[7] R. Wolski. Forecasting network performance to support dynamic scheduling using the network weather service. Proceedings of the 6th IEEE Symp. On High Performance Distributed Computing, August 1997.
[8] R. Carter and M. Crovella. Dynamic server selection using bandwidth probing in wide-area networks. Technical Report TR-96-007, Boston University 1996.
[9] R. Carter and M. Crovella. Measuring bottleneck link speed in packet-switched networks. Technical Report TR-96-006, Boston University 1996.
[10]B. Lowecamp, N. Miller, D. Sutherland, T. Gross, P. Steenkiste and J. Subhlok. A resource query interface for
0 500 1000 1500 2000 2500 3000 3500 4000
0 2000 4000 6000 8000 10000 12000 14000 16000
D
elay in Milliseconds
Number of stored elements (1 per link) XSL Transformation Time as a Function of
the Number of Link Entries
Transformation Time 0
1000 2000 3000 4000 5000 6000
0 2000 4000 6000 8000 10000 12000 14000 16000
Delay in M
illiseconds
Number of stored elements (1 per link) Constraint Evaluation Time as a Function of
the Number of Link Entries
network-aware applications. In Proc. 7th IEEE Symp. On High Performance Distributed Computing, August 1998. [11]S. Fritzgerald. I. Foster, C. Kesselman, G. von Laszewski,
W. Smith and S. Tuecke. A directory service for configuring high performance distributed computations. In Proc. 6th IEEE Symp. On High Performance Distributed Computing, August 1997.
[12]S. J. Chapin, J. Karpovich and A. Grimshaw. Resource management in legion. Technical report cs-98-09, University of Virginia, Department of Computer Science, May 1998.
[13]K. Obraczka and G.Gheorghiu. The performance of a service for network-aware applications. In proceedings of 2nd SIGMETRICS Conference on Parallel and Distributed Tools, August 1998, to appear.
[14]F.Berman, R. Wolski, S. Figueira, J.Scopf and G. Shao. Application level scheduling on distributed heterogeneous networks. In proceedings of Supercomputing 1996, 1996. [15]C. Yoshikawa, B. Chun, P. Eastham, A.Vahdat,
T.Anderson and D. Culler. Using Smart Clients to build scalable services. In Proceedings of the USENIX 1997 Technical Conference, 1997.
[16]J. Gehrinf and A.Reinfeld. Mars – A framework for minimizing the job execution time in a metacomputing environment. Proceedings of Future General Computer Systems, 1996
[17]R. Jones. Netperf. Available from http://www.cup.hp.com/netperf/NetperfPage.html
[18]M.Mathis and J.Madhavi. Diagnosing internet congestion with a transport layer performance tool. Proceedings of the INET 1996, 1996
[19]V. Jacobson. A tool to infer characteristics of internet paths. Available from ftp://ftp.ee.lbl.gov/pathchar.
[20]The NaradaBrokering System
http://www.naradabrokering.org
[21]Geoffrey Fox and Shrideep Pallickara, An Event Service to Support Grid Computational Environments, (To appear) Concurrency and Computation: Practice and Experience, Special Issue on Grid Computing Environments.
[22]Shrideep Pallickara and Geoffrey Fox. A Middleware Framework and Architecture for Peer-to-Peer Grids. (To appear) Proceedings of ACM/IFIP/USENIX International Middleware Conference Middleware-2003.
[23]Geoffrey Fox, Shrideep Pallickara and Xi Rao, “A Scaleable Event Infrastructure for Peer to Peer Grids”.
Proceedings of ACM Java Grande ISCOPE Conference 2002. Seattle, Washington. November 2002.
[24]Geoffrey Fox and Shrideep Pallickara, “JMS Compliance in the Narada Event Brokering System”. Proceedings of the International Conference on Internet Computing (IC-02). June 2002. pp 391-402.
[25] Geoffrey Fox et al, “Grid Services For Earthquake Science” Concurrency & Computation: Practice and Experience. 14(6-7): 371-393 (2002).
[26]Hasan Bulut, Geoffrey Fox, Shrideep Pallickara, Ahmet Uyar and Wenjun Wu, “Integration of NaradaBrokering
and Audio/Video Conferencing as a Web Service”.
Proceedings of the IASTED International Conference on Communications, Internet, and Information Technology, November, 2002, in St.Thomas, US Virgin Islands. [27]Geoffrey Fox and Shrideep Pallickara, “An Approach to
High Performance Distributed Web Brokering”. ACM Ubiquity Volume2 Issue 38. November 2001.
[28]Geoffrey Fox, Ozgur Balsoy, Shrideep Pallickara, Ahmet Uyar, Dennis Gannon, and Aleksander Slominski, "Community Grids" invited talk at The 2002 International
Conference on Computational Science, April 21 -- 24,
2002 Amsterdam, The Netherlands.
[29]D.J. Watts and S.H. Strogatz. “Collective Dynamics of Small-World Networks”. Nature. 393:440. 1998.
[30]R. Albert, H. Jeong and A. Barabasi. “Diameter of the World Wide Web”. Nature 401:130. 1999.
[31]Mark Happner, Rich Burridge and Rahul Sharma. Java Message Service Specification”. Sun Microsystems. 2000. http://java.sun.com/products/jms.
[32]Sun Microsystems. The JXTA Project and Peer-to-Peer Technology http://www.jxta.org
[33]The JXTA Protocol Specifications.
http://spec.jxta.org/v1.0/docbook/JXTAProtocols.html [34]Gurudutt Banavar, Tushar Chandra, Bodhi Mukherjee, Jay
Nagarajarao, Rob Strom, and Daniel Sturman. An Efficient Multicast Protocol for Content-Based Publish-Subscribe Systems.In Proceedings of the IEEE International
Conference on Distributed Computing Systems, Austin,
Texas, May 1999.
[35]Bill Segall and David Arnold. Elvin has left the building: A publish/subscribe noti.cation service with quenching. In
Proceedings AUUG97, pages 243–255, Canberra,
Australia, September1997.
[36]Fiorano Corporation. A Guide to Understanding the Pluggable, Scalable Connection Management (SCM) Architecture - White Paper. Technical report, http://www.fiorano.com/ products/fmq5 scm wp.htm, 2000.
[37]Talarian Corporation. Smartsockets: Everything you need to know about middleware: Mission critical interprocess communication. Technical report, URL: http://www.talarian.com/products/smartsockets, 2000.
[38]TIBCO Corporation. TIB/Rendezvous White Paper.
Technical report, URL: http://www.rv.tibco.com/whitepaper.html, 1999.
[39]The Object Management Group (OMG). OMG’s CORBA
Event Service. URL: http://www.omg.org/technology/documents/formal/eventse
rvice.htm, June 2000. Version 1.0.
[40]RTP: A Transport Protocol for Real-Time Applications (IETF RFC 1889) http://www.ietf.org/rfc/rfc1889.txt. [41]XML based messaging and protocol specifications SOAP.
http://www.w3.org/2000/xp/.
[42]Microsoft Internet Security and Acceleration (ISA) Server. http://www.microsoft.com/isaserver/
[43]Checkpoint Technologies. http://www.checkpoint.com/ [44]iPlanet. http://www.iplanet.com/
[45]Shrideep Pallickara, Geoffrey Fox, John Yin, Gurhan Gunduz, Hongbin Liu, Ahmet Uyar, Mustafa Varank. A Transport Framework for Distributed Brokering Systems. (To appear) Proceedings of the International Conference on Parallel and Distributed Processing Techniques and Applications.(PDPTA'03).
[46]Apache Jetspeed.
http://jakarta.apache.org/jetspeed/site/index.html