VARIABLES AS CURRENCY: LINKING META-ANALYSIS RESEARCH
AND DATA PATHS IN SCIENCES
Hua Qin
1*†, Lynne Davis
2†, Matthew Mayernik
2, Patricia Romero Lankao
2, John D’Ignazio
3,
Peter Alston
4*1Division of Applied Social Sciences, University of Missouri-Columbia, Columbia, Missouri, USA
Email: [email protected]
2University Corporation for Atmospheric Research and National Center for Atmospheric Research, Boulder,
Colorado, USA
3School of Information Studies, Syracuse University, Syracuse, New York, USA 4
School of Life Sciences, University of Liverpool, Liverpool, UK
†Contributed equally to this work as first authors.
ABSTRACT
Meta-analyses are studies that bring together data or results from multiple independent studies to produce new and over-arching findings. Current data curation systems only partially support meta-analytic research. Some important meta-analytic tasks, such as the selection of relevant studies for review and the integration of research datasets or findings, are not well supported in current data curation systems. To design tools and services that more fully support meta-analyses, we need a better understanding of meta-analytic research. This includes an understanding of both the practices of researchers who perform the analyses and the characteristics of the individual studies that are brought together. In this study, we make an initial contribution to filling this gap by developing a conceptual framework linking meta-analyses with data paths represented in published articles selected for the analysis. The framework focuses on key variables that represent primary/secondary datasets or derived socio-ecological data, contexts of use, and the data transformations that are applied. We introduce the notion of using variables and their relevant information (e.g., metadata and variable relationships) as a type of currency to facilitate synthesis of findings across individual studies and leverage larger bodies of relevant source data produced in small science research. Handling variables in this manner provides an equalizing factor between data from otherwise disparate data-producing communities. We conclude with implications for exploring data integration and synthesis issues as well as system development.
Keywords: Meta-analyses, Small science, Variables, Urban vulnerability, Data curation, Data integration
1
INTRODUCTION
statistical analysis (Rudel, 2008). Meta-analyses in other fields of study usually focus on quantifying the aggregate direction and strength of variable relationships based on previous research findings without accessing the actual data of individual studies. Researchers adopting the meta-analysis strategy are generally faced with significant comparability and compatibility issues (Sandelowski, Voils, & Barroso, 2007). Consequently, they must compare the research topics and methods of the individual studies to be combined, decide which studies should and should not be included, and develop data structures that enable disparate data and results to be brought together.
Integrating and synthesizing datasets or findings from multiple independent projects into a meta-analysis, however, is a time and energy intensive process. Current data curation systems only partially support meta-analytic research. Significant interpretation is often required to understand how data and findings come to exist (Gitelman, 2013). In addition, descriptions in published literature inevitably leave out important details about how data and findings were created, processed, analyzed, and presented (Bowker, 2005). Key tenets of open data systems, such as openly accessible collections, standardized metadata descriptions, and sophisticated search algorithms, enable data to be discovered, accessed, and compared (to the extent that metadata descriptions allow). Other meta-analytic tasks, such as the selection of relevant studies for review and the integration of research datasets or findings, are less well supported in current data curation systems. In part, this is because such tasks rely on human expertise and judgment; different analysts might make different decisions about what to include in or exclude from a meta-analysis. These decisions might be based on needing to transform data from qualitative to quantitative values, conceptual differences across studies, and the ability to match and merge across multiple datasets (Faniel, Kriesberg, & Yakel, 2012). At the same time, our understanding of the practices that researchers use to perform meta-analyses is not highly developed. For example, while we know some detail about the elements of scholarly literature used by scientists to synthesize evidence or look for larger effects in a set of results (Blake & Pratt, 2006), the role of data in researchers’ work to establish important decision points needs more attention. The interrelationships among scientific data, data practices, and curation functions have important implications for the development of data infrastructures and services (Cragin, et al., 2010b; Mayernik, et al., 2012). To design data curation tools and services that more fully support meta-analyses, we need a better understanding of meta-analytic research. This includes an understanding of both the practices of researchers who perform the analyses and the characteristics of the individual studies brought together.
In this study, we make an initial contribution to filling this gap by developing a conceptual framework linking meta-analytic concepts with the data from individual published articles that are used to derive those concepts. We analyze meta-analyses using the notion of a “data path”: the set of stages and linkages where data plays a role; for example, from its source(s), through transformations, to presentation in a study. Our framework emphasizes how key variables and the relationships among them represent primary/secondary datasets or derived socio-ecological data, contexts of use, and the data transformations that are applied. In published articles, the main sources of data for meta-analyses, key variables, and findings are typically represented as tables, figures, and graphs. These data forms are commonly used by researchers to assess the relevance and reliability of other scholars’ data for reuse (Faniel & Jacobsen, 2010), and can be considered as prime components of scientific publications to be curated as “nanopublications” (Mons, et al., 2011). In addition, Attwood, et al. (2010) and Briscoe, et al. (2011) note how new PDF markup schemes can enable tables and figures to serve as sources of additional information for users and for document retrieval systems respectively. There is a range of data-related information, such as data sources, variable measurement, and analytical techniques, which can be extracted from scientific publications to facilitate the integration and reuse of small science research data (Chao, 2014). In addition to supporting meta-analyses of meaningful research questions, variable relationships can also serve as a key data description indicator of journal articles in support of data curation tools and services.
a meta-analytic research setting where formalized workflow tools are not used and might be hard to implement because of the variability in research methods and data sources.
This study explores how data curation and meta-analysis can be integrated to contribute to further advancement in both data science and scientific research domains. We develop the notion of using variables and their relevant information (e.g., metadata and variable relationships) as a type of currency to facilitate synthesis of findings across individual studies and leverage larger bodies of heterogeneous source data produced in small science research. Handling variables in this manner provides an equalizing factor between data from otherwise disparate data-generating communities, such as bridging between researchers who are guided by different research paradigms or depend on qualitative or quantitative research methods. We conclude with implications for exploring data integration and synthesis issues and system development.
2
BACKGROUND
2.1
Data Conservancy at the National Center for Atmospheric Research
This paper draws on work conducted as part of the Data Conservancy project, and builds on a research agenda focused on characterizing urban vulnerabilities to climate change at the National Center for Atmospheric Research (NCAR). Data Conservancy (DC), funded by the National Science Foundation's DataNet initiative (Sandusky, et al., 2009) is building data curation services that respond to the needs of particular research communities (http://dataconservancy.org/). Designing such services for particular research communities, however, requires developing an understanding of the data practices and needs within those communities. Our work was supported as part of the needs assessment thrust within DC. The aim was to characterize the role of data within a particular research community through collaboration between DC researchers and a group of interdisciplinary social scientists who study urban vulnerability and adaptations to global environmental change. This characterization contributes to the specification of data curation and preservation infrastructure to enable the conduct of new, interdisciplinary science.
2.2
Urban Vulnerability Project at NCAR
To understand and contribute to aiding the data practices of any group of scientists, it is necessary to understand their research emphasis and vocabulary (White, 2010). Urban areas are centers of social, economic, and technological changes, providing key sources of human adaptation and innovation. Urban centers are also hotspots of environmental pollution and therefore particularly at risk from natural hazards that climate change is expected to exacerbate (Romero Lankao & Qin, 2011). These opposing roles highlight the importance of cities in the arena of global climate and environmental change and have spawned an increasing number of studies on urban vulnerability in recent decades.
Existing urban vulnerability research is based on conflicting theories and paradigms that result in disparate methods and ways of collecting, organizing, and presenting data (Romero Lankao & Qin, 2011). The situation poses two sets of interrelated challenges: the first refers to a tenet put forth by some scholars that urban vulnerability is context specific, thus posing challenges to research seeking to identify repeated processes and patterns of vulnerability and resilience across urban areas as diverse as New Orleans in the United States and Lusaka in Africa. The second challenge relates to the fact that different lineages of urban vulnerability research exist and define various methods, concepts, and data. The task relevant to data curation research and development involves developing a series of tools, techniques, heuristics, and workflows that allow comparability and compatibility of individual datasets. Such mechanisms would enable database integration across disciplinary domains involved in the analysis of urban vulnerability to climate change (e.g., atmospheric science, climate modeling, health, sociology, and urban planning).
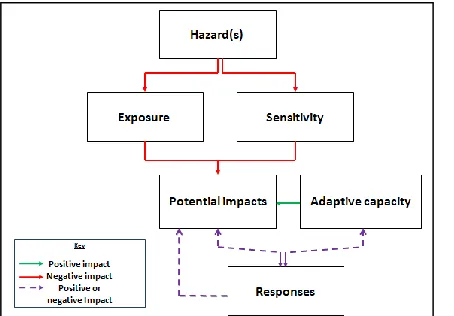
system (Miller & Page, 2007) with interdependent, interacting factors acting in a changing or adapting environment at a time and place. Romero Lankao and Qin (2011) developed a comprehensive conceptual framework of urban vulnerability to global climate and environmental change from their synthesis of diverse research lineages. As shown in Figure 1, urban vulnerability to environmental change describes a complex and dynamic reality comprised of several dimensions. Urban vulnerability, or the potential for urban populations to be negatively impacted by climate change (potential impacts), is a function of: (1) hazards– probable or looming perturbations and stresses to a system; (2) exposure – the extent to which urban populations are in contact with, or subject to hazards; (3) sensitivity – the degree to which subsets of urban populations are susceptible to hazards with patterns of susceptibility often determined by demographic characteristics or medical conditions; (4) adaptive capacity – the ability to avoid or lessen the negative consequences of hazards based on access to resources, assets, and options; and (5) actual coping and/or adaptation responses (see Figure 1).
Figure 1: Model of urban vulnerability to global climate change (adapted from Romero Lankao and Qin, 2011)
Each of these dimensions of urban vulnerability in the framework includes different concepts and variable measurements. For instance, hazards are defined by such characteristics as magnitude and frequency while sensitivity and adaptive capacity are represented by such concepts as age, preexisting disease conditions, income, home amenity, and social network. These properties are in turn operationalized into concrete, observable measures. These three terms, dimension, concept, and variable are central to our framework introduced in the next section and have the following definitions:
●
Dimension – a general construct used to understand and integrate concepts. Major dimensions are: hazards, exposure, sensitivity, adaptive capacity, potential impacts, and responses.●
Concept – an abstract feature of analytic interest●
Variable – an observable measure representing an underlying concept2.3
Meta-analysis and Data Path Analysis Procedures
of this research community. Their meanings need to be comparable and sufficient quantities of data need to be analyzed so that evidentiary patterns can emerge.
Findings related to influencing factors (variables) of urban vulnerability in selected articles were labeled as “positively related”, “negatively related”, or “unrelated” based on statistical results or qualitative description. Similar variables were grouped under the same concepts to combine findings across individual studies. The UV researchers also extracted information on the conceptual and methodological contents of each article, including research questions and hypotheses, types of methods and data, level of analysis, and temporal scale. A vote-counting (tallying) method was then employed to analyze the extracted data and aggregate results.
The DC component to scrutinize how the UV group examined scholarly articles on urban vulnerability to climate change focused on how diverse research findings could be synthesized and how heterogeneous datasets associated with publications might be characterized for recombination/reuse (Davis, Alston, & D’Ignazio, 2011). DC researchers conducted an in-depth analysis of data paths within six published studies randomly selected from those included in the meta-analysis. Doing this provided a foundation for better understanding the interrelationships between concepts, variables, and data. These articles provided summaries and representations of relevant data and were used as source materials for meta-analysis research. The studies represented by these papers mostly explored relationships between climatic events and their impacts on urban populations in statistical terms. The scientists used variables according to different conceptual approaches that connected data with urban vulnerability dimensions and concepts. Detailed examination of such data characteristics and research practices can aid information scientists, data librarians, and data system designers to know how to capture, curate, and find data that are often heterogeneous. This analysis can also help indicate how to preserve data to support more reuse and repurposing.
Data related to urban vulnerability to global climate and environmental change originate from both environmental and social science domains, including such information about urban areas as temperature, carbon emissions, mortality rate, population size and density, age structure, gender composition, educational attainment, income level, and gross domestic product. Existing socioeconomic, demographic, and environmental data on urban areas involve different spatial and temporal scales as well as different characteristics depending on how concepts are defined and measured by respective variables. In this interdisciplinary field, primary or secondary datasets related to individual research projects are usually represented in tables, figures, and results within scholarly publications, while the datasets themselves are not included in the publication process. In addition, a recent study of data sharing within the social sciences conducted by staff at the Inter-university Consortium for Political and Social Research (ICPSR) showed that most social science data are not archived publicly (Pienta, Alter, & Lyle, 2010). While the ICPSR study does not specifically call out data archiving practices by sub-disciplines, our experience suggests that this trend holds true in urban vulnerability research. The potential value of these datasets for future analysis, synthesis, and preservation cannot easily be actualized, as observed in our meta-analysis and data path analysis efforts. Together, the DC and UV work at NCAR informed data system development with user-centered design constructs including scenarios, use cases, testable mockups, and specific requirements. We also tested the viability of designing a new tool for the combination of quantitative primary/secondary datasets related to urban vulnerability research, and the generation of integrated data that may be applied in meta-analyses. The primary function of this tool is to synthesize heterogeneous quantitative datasets from individual researchers to produce larger datasets based upon specific selection and transformation criteria (see Birkland, 2011 for details).
3
GETTING FROM CONCEPTS TO DATA
sections are typically the most promising. These sections represent the important juncture useful for researchers to seek conceptual references and trace the use of data in support of them.
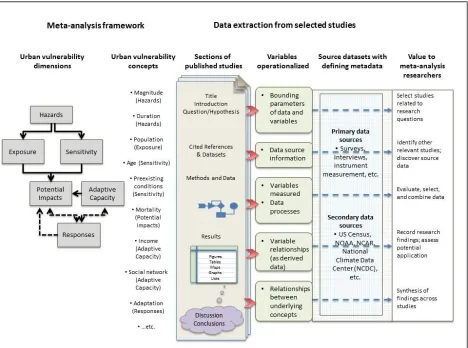
[image:6.612.74.542.243.591.2]Figure 2 also shows data represented in published articles and their importance for meta-analyses. Each of these sections offers something for meta-analytic researchers to judge the applicability and value of selected studies and the potential for reusing their data. For example, the results sections of studies usually present findings of an analytical process that indicate positive or negative correlations between variables. Tables, graphs, figures, etc., illustrate such relationships; captions and narratives describe specific contexts. If one were to question the value or validity of a result, one could trace its path back to understand the input variables involved, assess their sources, and the processes applied to them. The “Variables operationalized” column shows the types of information in a publication that are of value to meta-analysis. The items in this column involve variables included in individual studies and also provide useful information about the primary or secondary data sources. The last column “Value to meta-analysis researchers” givesclues as to how the extracted “data” from individual studies can be used in meta-analysis.
Figure 2: Data represented in articles and their importance for meta-analyses
4
GETTING FROM DATA TO CONCEPTS
information about its derivation could be provided as metadata. If data repositories included information about how primary and secondary data were used in articles, as well as relationships between key variables in these studies, search criteria could request articles having variables of specific interest, and metadata could include links back to data sources. This would give researchers access to a larger number of relevant articles from which to choose and substantially decrease time spent in the search and selection process.
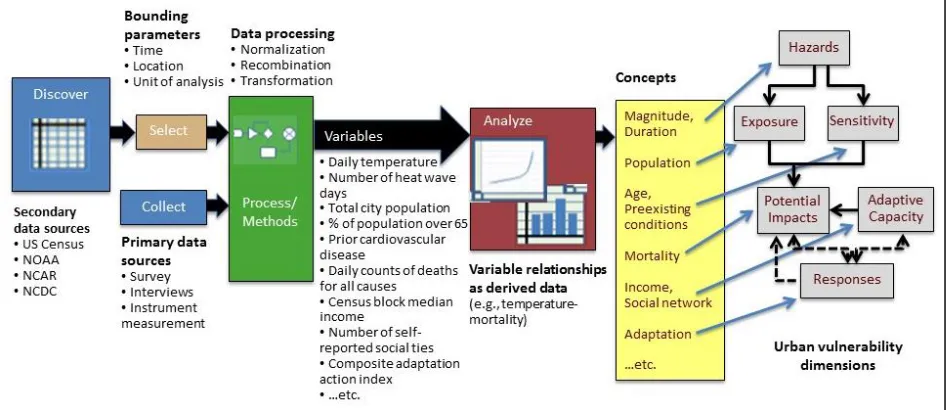
Figure 3: Data paths supporting derived concepts
Figure 3 shows a general picture of the data-to-concepts process embedded in published articles. Secondary datasets such as NOAA weather data or US Census data often reflect spatial and temporal bounds and identify the units of analysis. One of the first processes seen in research data paths is the selection of secondary data and/or collection of primary data according to parameters that suit particular research questions. Processes vary widely and can be iterative. Researchers perform relevant operations that prepare data and their variables for integration. Having been prepared, it is at this point that variables take on a context of use and their names begin to appear as labels in tables and graphs. Integration and analysis can now be performed on them. Through analysis, variables are interrelated, allowing scientists to apply them to conceptual models downstream (Urban vulnerability dimensions) in meaningful ways. In this manner, a data path can be discerned and informational aspects of these paths can be captured and used for metadata assignment during data curation.
5
A VARIABLES-AS-CURRENCY CONCEPTUAL FRAMEWORK
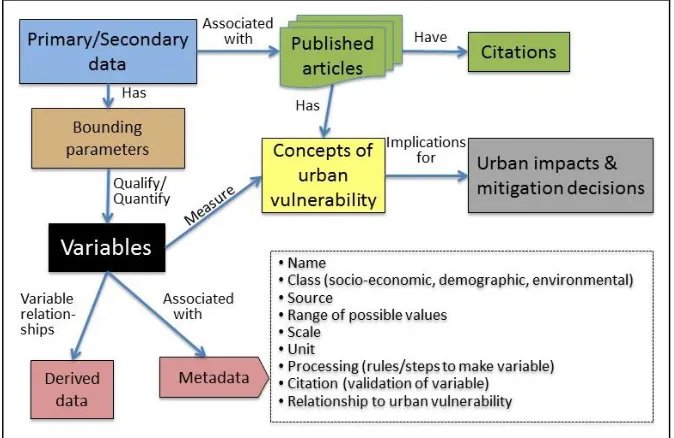
Our observations and experience in conducting the DC and UV work resulted in a conceptual framework of data use in urban vulnerability research. The purpose of this framework is to improve understanding of the needs of this interdisciplinary research field for the development of data curation and preservation infrastructure that enables the generation of new science. Figure 4 illustrates the two conceptual linkages hypothesized as important in understanding the relationship between meta-analysis and data paths in scientific practices. One starts with concepts and uses variables as links to the source data; the other starts with the data and uses variables to link to concepts. Variables and their contextual information in published articles serve as a bridge between urban vulnerability concepts and their underlying data, and expose primary/secondary datasets and critical data characteristics to preserve for reuse.
and place are represented is important when considering dataset integration. In a published paper, interrelations of variables are qualified by the bounding parameters established for the study and are reflected in the derived data presented. Having access to data bounds aids researchers in deciding whether a study should be included in a meta-analysis and understanding how much human effort may be in store to make differing parameters compatible. Figure 5 further illustrates a variable within a broad associative structure. Variables (with associated metadata) serve different purposes: some represent what is being measured, such as average daily temperature, percentage of population over a specific age, or percentage of population with income below poverty level. Others are typically referred to as indices that result from statistical analysis and represent a synthesis of variables (e.g., computing a composite measure of human thermal comfort). Variable relationships serve as common keys between otherwise disparate datasets, allowing them to be associated, aggregated, or integrated. However integration happens, it requires that the data to be combined be made homogeneous or relational.
Figure 4: A conceptual framework of data use in urban vulnerability research
[image:8.612.71.408.483.702.2]From a data curation and reuse perspective, there are a number of issues related to each of these purposes that when resolved, will help to leverage previous work included in meta-analyses. Some of these are data normalization (e.g., day to week, city to metro area), heterogeneity (inconsistency in name, method, unit, type, and source), measurement characteristics (degree of hotness or coldness) and issues surrounding variable relationships (ways of expressing variable associations). There are also issues of scientific community-related data standards and practices.
Picking out key variables within a published paper can often be simply a matter of looking at the labels, axes, or headings of figures, charts, graphs, and tables. These items, when available within a research article, are frequently where researchers look to evaluate the roles of and relationships between variables used in the study. Methods and discussion sections often name data sources and explain the workflows or rules for how data were acquired, transformed, or combined for use in research projects. Such information thus could serve as a data proxy to the direct use of primary/secondary data, producing reliable and comparable results with a huge savings in time and effort. Variable relationships, as reported in these data forms, constitute a key type of derived data that can be referenced by researchers to analyze a study and to inform their meta-analysis. Typically, however, these are not accessible in databases or available in a readily reusable form.
The center circle in Figure 4 represents variables in their structured sense. It highlights derived data in various visual forms displaying variable names and relationships; for example, those variables that have statistical significance and indicate notable patterns related to determinants of urban vulnerability. Our model depicts the place of variables acting as a medium of exchange between the data and where they provide value when applied in a meta-analysis to understand particular concepts. Or, in the reverse direction, selected variables of interest related to particular concepts could be used to find and leverage larger bodies of relevant data.
As shown in Figure 5, variables become bounded entities with value for a purpose when combined with contextual metadata. As such, variables might be thought of as value-laden tokens exchangeable between science domains. This is encapsulated in considering variables as a kind of scientific currency. Scientific communities can form their own variable collections (banks) with attributable community-derived rules and standards. This would render variables capable of transparent exchange and reuse as appropriate, conceivably across disparate domains of scientific research. Variables might be associated with source data and published accounts of specific transformations (workflows) to provide a record of provenance. Certain variable associations might also become quantifiable metrics for assessing value for a specific purpose.
Another notable aspect of the concept of recognizing variables as currency in data use resides in variable transformations. If sufficient characteristics and processing steps related to variables can be identified and described in published articles, it becomes feasible to think about where automation might best function to support meta-analysis. Results that are exchangeable, meaningful, and trustworthy, are of great relevance to broad research communities. Transformation rules are important for data curation in association with variables to better support their exchange “currency” within and across science domains. The idea of sharing derived data in its published forms (e.g., tables and graphs) and having search access to supporting primary/secondary datasets should prove to be of wide interest to researchers, provided that such data include adequate metadata to describe them. In such a form, it is conceivable that data from disparate research projects may be made accessible, comparable, and conducive to integration.
6
CONCLUDING REMARKS
integration and enhance the potential value of research data for re-analysis (Palmer, et al., 2011) by enabling variable-based ways of comparing and combining individual datasets. Digital data are widely recognized to have great potential for reuse. Cataloging primary or secondary research datasets are already major data curation system functionalities for a wide range of research communities. In emphasizing the centrality of variables in the process of data selection and integration, we suggest that not only the variables but also the relationship between them (as derived data) become an important candidate for curation as well.
The conceptual framework discussed in this paper contributes to a better understanding of the relationships between small science research practices and data curation requirements. High-level metadata descriptions that enable users to discover possibly relevant data will likely not be sufficient to support the use or integration of datasets at a variable level. Supporting cross-cutting integrative research requires a more thorough description of the key concepts and variables that underlie individual studies. In a field of inquiry as diversified as vulnerability and adaptation to global environmental change, measurements of variables vary considerably across different studies (Rudel, 2008). Thus, as an initial step, the synthesis of research data and findings through meta-analyses should focus on the conceptual linkages reflected by variable relationships rather than the actual datasets.
Both the growth of meta-analysis research and the increase in sharing and reusing research data will benefit from more detailed information about data to be included in the scientific publication process. The development of the Data Documentation Initiative standard for documenting social science datasets provides capabilities for documenting and sharing standard variable names (Vardigan, Heus, & Thomas, 2008; Bosch, et al., 2013). This capability allows for the description of variables and their characteristics in detail, which supports data and variable comparison by secondary users over time (Hansen et al., 2011). In other domains, biophysical scientists also increasingly use metadata conventions to allow exchange and integration of observation data from distributed sources. For example, in the atmospheric sciences, the Climate and Forecast (CF) metadata conventions (http://cfconventions.org/) are a community managed project to standardize the variable names used within climate and atmospheric dataset metadata. The CF standard names table provides standardized terms for common variables
like “air_temperature” as well as for very specific variables, such as
“surface_downwelling_radiative_flux_per_unit_wavelength_in_sea_water”. The CF conventions are designed to be used with the Network Common Data Form (NetCDF), which is a widely used suite of software and data format tools. This CF convention effort to curate and standardize how variables are represented has enabled more effective sharing and use of datasets in many applications, including in the context of sharing climate model data internationally (Williams, et al., 2009; Hankin, et al., 2010).
In a contrasting example, the Ecological Metadata Language (EML) is a standardized structure for documenting ecological data (Fegraus, et al, 2005; see also https://knb.ecoinformatics.org/#external//emlparser/docs/index.html). EML, developed in the early 2000’s, is now the official metadata standard for multiple large-scale ecological research organizations, including the Long Term Ecological Research (LTER) network (Michener, et al., 2011). The EML structure includes specifications for how to describe the variables of a dataset, using the term “attributes”. EML attributes can have associated definitions, units, and measurement types. The names of attributes, however, are not standardized within EML. In addition, search tools based on EML, such as the current LTER data portal (https://portal.lternet.edu/nis/home.jsp), do not use the attributes as mechanisms for cross-cutting searches or other data discovery/integration purposes. The LTER also produced a “unit registry” that provides a central place to see how measurement units are recorded in dataset metadata around the network (Kortz, et al., 2009). The unit registry emerged out of a unit dictionary compiled at a single LTER site, and had the goal of increasing standardization of the use of units across the LTER network (Karasti, Baker, & Millerand, 2010). The unit registry was also a start at developing a registry of the attributes associated with particular units. This product, however, is only used for internal LTER data management purposes, and it is again not provided to data portal users as a data discovery tool. Developing these kinds of tools – standard vocabularies of variables, variable and unit registries, variable-based search interfaces – can particularly facilitate the conduct of interdisciplinary meta-analyses and improve the curation of data generated by individual researchers or small research teams. These variable-concept terminologies could also be used as data descriptors of scientific publications to support the identification and integration of disordered research results and be further developed into common semantic annotations to enable the fusion of apparently disparate data.
policy level. As one component of scholarly data practices, what is currently published in the form of tables, figures, charts, maps, and the associated data compilations are valuable sources of data for new research, particularly meta-analytic studies. Additionally, because existing meta-analyses and data curation systems mainly target published studies, it is important for both to make special efforts to include the “grey” literature and the “dark” data to prevent the “file drawer” (publication bias) problem. We argue that meta-analysis research would benefit more from both published and unpublished data if they were curated as inter-related sets of variables and associated metadata that are linked to their authors and final work. As a collection, primary/secondary datasets and derived data (tables, figures, variable relations, etc.) could be annotated as data resources in institutional or disciplinary/interdisciplinary data registries. These data registries enable small science datasets to be discovered for reuse and curation (Wallis, et al., 2010). They also provide metadata through which searches could be performed to uncover variable use in unanticipated domain areas, increasing the potential for interdisciplinary collaborations and citation. In sum, while meta-analyses in many fields of study do not stringently require access to actual research data, we can move one step further toward better management of the data deluge increasingly experienced in sciences by developing innovative data tools and services to support such synthetic research.
7
ACKNOWLEDGEMENTS
This study is supported by the NSF HPCC, 9139, 7785, and 7726. Any opinions, findings and conclusions, recommendations or omissions expressed are those of the authors and do not necessarily reflect the views of NSF. We gratefully acknowledge Mary Marlino and Karon Kelly at NCAR Library and Integrated Information Systems, UCAR; Katie Dickinson and Lawrence Buja at the Research Applications Laboratory at NCAR; Aaron Birkland at Cornell University; and Sayeed Choudhury (Data Conservancy PI) at Johns Hopkins University, for their contributions to this work. Thoughtful comments on earlier versions of the paper from Karen Baker at the University of Illinois at Urbana-Champaign and two anonymous reviewers are also sincerely appreciated.
8
REFERENCES
Attwood, T. K., Kell, D. B., McDermott, P., Marsh, J., Pettifer, S. R., & Thorne, D. (2010) Utopia documents: linking scholarly literature with research data. Bioinformatics26(18), pp i568-i574. Retrieved from the World Wide Web November 13, 2014: http://dx.doi.org/10.1093/bioinformatics/btq383
Birkland, A. (2011) RS-Cities Proof of Concept #1 Plan and Justification: Initial IRD perspective. Data Conservancy White Paper. Retrieved from the World Wide Web November 13, 2014:
http://dlsciences.org/research/DataConservancy/RS-cities_POC_01_plan--ird.pdf
Blake, C. & Pratt, W. (2006) Collaborative information synthesis I: A model of information behaviors of scientists in medicine and public health. Journal of the American Society for Information Science and Technology57(13), pp 1740-1749.
Borgman, C.L., Wallis, J.C., Mayernik, M.S., & Pepe, A. (2007) Drowning in data: digital library architecture to support scientists' use of embedded sensor networks. In JCDL '07: Proceedings of the 7th ACM/IEEE-CS Joint Conference on Digital Libraries. ACM.
Borgman, C. (2012) The conundrum of sharing research data. Journal of the American Society for Information Science and Technology63(6), pp 1059-1078. doi:10.1002/asi.22634
Bosch, T., Cyganiak, R., Gregory, A., & Wackerow, J. (2013) DDI-RDF Discovery Vocabulary: A Metadata Vocabulary for Documenting Research and Survey Data. In Proceedings of the 6th Linked Data on the Web (LDOW) Workshop at the World Wide Web Conference (WWW), Rio de Janeiro, Brazil. Retrieved from the World Wide Web November 13, 2014: http://events.linkeddata.org/ldow2013/papers/ldow2013-paper-12.pdf
Briscoe, T., et al. (2011) Intelligent Information Access from Scientific Papers. In W. Bruce Croft (Ed.) Current Challenges in Patent Information Retrieval, Springer Berlin Heidelberg, pp 329-342. Retrieved from the World Wide Web November 13, 2014: http://dx.doi.org/10.1007/978-3-642-19231-9_16
Chao, T. C. (2014) Identifying Description Indicators for Research Data from Scientific Journal Publications. In iConference 2014 Proceedings, pp. 1038-1042. doi:10.9776/14366
Cooper, H. & Hedges, L.V. (2009) Research synthesis as a scientific process. In H.M Cooper, L.V. Hedges, & J.C. Valentine (Eds.), The Handbook of Research Synthesis and Meta-analysis, New York: Russell Sage Foundation, pp 3-16.
Cragin, M.H., Palmer, C.L., Carlson, J.R., & Witt, M. (2010a) Data sharing, small science and institutional repositories. Philosophical Transactions of the Royal Society A: Mathematical, Physical and Engineering Sciences 368(1926), pp 4023-4038. doi:10.1098/rsta.2010.0165
Cragin, M. H., Palmer, C. L., & Chao, T. C. (2010b) Relating data practices, types, and curation functions: An empirically derived framework. Proceedings of the American Society for Information Science and Technology47(1), pp 1-2.
Davis, L., Alston, P., & D’Ignazio, J. (2011) Repurposing data across disciplines: A study of data reuse issues between climate science and social science [Poster]. ACM/IEEE Joint Conference on Digital Libraries (JCDL'11), 13-17 June, 2011. Ottawa, Ontario, Canada. Retrieved from the World Wide Web November 13, 2014:
http://dl.acm.org/citation.cfm?id=1998171
De Roure, D., Goble, C., & Stevens, R. (2007) Designing the myExperiment Virtual Research Environment for the
Social Sharing of Workflows. In Third IEEE International Conference on e-Science and Grid Computing (e-Science 2007), pp 603-610.
Faniel, I.M., & Jacobsen, T.E. (2010) Reusing scientific data: How earthquake engineering researchers assess the reusability of colleagues’ data. Computer Supported Cooperative Work19(3-4), pp 355-375. doi:10.1007/s10606-010-9117-8
Faniel, I.M., Kriesberg, A., & Yakel, E. (2012) Data reuse and sensemaking among novice social scientists. Proceedings of the Association for Information Science and Technology (ASIS&T)49.
doi:10.1002/meet.14504901068
Fegraus, E.H., Andelman, S., Jones, M.B., & Schildhauer, M. (2005) Maximizing the Value of Ecological Data with Structured Metadata: An Introduction to Ecological Metadata Language (EML) and Principles for Metadata
Creation. Bulletin of the Ecological Society of America86(3), 158-168. Retrieved from the World Wide Web November 14, 2014: http://dx.doi.org/10.1890/0012-9623(2005)86[158:MTVOED]2.0.CO;2
Georgakopoulos, D., Hornick, M., & Sheth, A. (1995) An overview of workflow management: From process modeling to workflow automation infrastructure. Distributed and Parallel Databases3(2), pp 119-153. doi:10.1007/BF01277643
Gil, Y. (2009). From Data to Knowledge to Discoveries: Scientific Workflows and Artificial Intelligence. Scientific Programming17(3). Retrieved from the World Wide Web November 14, 2014: http://dx.doi.org/10.3233/SPR-2009-0261
Gitelman, L. (Ed.) (2013) "Raw data" is an Oxymoron. Cambridge, MA: MIT Press.
Hankin, S., et al. (2010) NetCDF-CF-OPeNDAP: Standards for ocean data interoperability and object lessons for community data standards processes. In J. Hall, D.E. Harrison, & D. Stammer, (Eds.), Proceedings of OceanObs’09: Sustained Ocean Observations and Information for Society 2, ESA Publication WPP-306. Retrieved from the World Wide Web November 14, 2014: http://dx.doi.org/10.5270/OceanObs09.cwp.41
Hansen, S.E., Iverson, J., Jensen, U., Orten, H., & Vompras, J. (2011). Enabling longitudinal data comparison using DDI. DDI Working Paper Series–Longitudinal Best Practice, No. 2. doi:10.3886/DDILongitudinal02
Heemskerk, M., Wilson, K., & Pavao-Zuckermann, M. (2003). Conceptual models as tools for communication across disciplines. Ecology and Society7(3), p 8. Retrieved from the World Wide Web November 14, 2014: http://www.ecologyandsociety.org/vol7/iss3/art8/
Heidorn, P. B. (2008) Shedding light on the dark data in the long tail of science. Library Trends57(2), pp 280-299. doi:10.1353/lib.0.0036
High Level Expert Group on Scientific Data (2010) Riding the Wave: How Europe Can Gain From the Rising Tide of Scientific Data. (2010) Final report to the European Commission. European Union. Retrieved from the World Wide Web November 14, 2014:
http://ec.europa.eu/information_society/newsroom/cf/document.cfm?action=display&doc_id=707.
Interagency Working Group on Digital Data to the National Science and Technology Council (2009) Harnessing the Power of Digital Data for Science and Society. Networking and Information Technology Research and
Development (NITRD) Program. Retrieved from the World Wide Web November 14, 2014:
http://www.nitrd.gov/About/Harnessing_Power_Web.pdf.
Karasti, H., Baker, K. S., & Millerand, F. (2010) Infrastructure Time: Long Term Matters in Collaborative Development. Computer Supported Cooperative Work 19, pp 377-415. Retrieved from the World Wide Web November 14, 2014: http://dx.doi.org/10.1007/s10606-010-9113-z
Kortz, M., Yarmey, L., Conners, J., Ackerman, T., & Baker, K. (2009) LTER Unit Working Group Projects: Unit Dictionary and Unit Registry [Poster]. 2009 LTER All Scientists Meeting, 13-17 September, 2009. Estes Park, Colorado. Retrieved from the World Wide Web November 14, 2014:
http://oceaninformatics.ucsd.edu/docs/ASM2009_UnitWGPoster.pdf
Ludäscher, B., Lin, K., Bowers, S., Jaeger-Frank, E., Brodaric, B., & Baru, C. (2006) Managing scientific data: From data integration to scientific workflows. In A.K. Sinha (Ed.), Geoinformatics: data to knowledge, Boulder, CO: Geological Society of America, pp 109-130.
Mayernik, M., Choudhury, S., DiLauro, T., Metsger, E., Pralle, B., Rippin, M., & Duerr, R. (2012) The data conservancy instance: Infrastructure and organizational services for research data curation. D-Lib Magazine 18(9/10). Retrieved from the World Wide Web November 14, 2014: http://dx.doi.org/10.1045/september2012-mayernik
McPhillips, T., Bower, S., Zinn, D., & Ludäscher, B. (2009) Scientific workflow design for mere mortals. Future Generation Computer Systems25(5), pp 541-551. Retrieved from the World Wide Web November 14, 2014: http://dx.doi.org/10.1016/j.future.2008.06.013
Michener, W. K., Porter, J., Servilla, M., & Vanderbilt, K. (2011) Long term ecological research and information management. Ecological Informatics6(1), pp 13-24. doi:10.1016/j.ecoinf.2010.11.005
Miller, J.H. & Page, S.E. (2007) Complex adaptive systems: an introduction to computational models of social life. Princeton, N.J.: Princeton University Press.
National Science Foundation (NSF). (2011) Dissemination and sharing of research results. http://www.nsf.gov/bfa/dias/policy/dmp.jsp
Palmer, C.L., Weber, N.M., & Cragin, M.H. (2011) The Analytic Potential of Scientific Data: Understanding Re-use Value. Proceedings of the American Society for Information Science & Technology48(1), pp 1-10. Retrieved from the World Wide Web November 14, 2014: http://dx.doi.org/10.1002/meet.2011.14504801174
Pienta, A.M., Alter, G., & Lyle, L. (2010) The enduring value of social science research: The use and reuse of primary research data. Presented at the BRICK, DIME, STRIKE Workshop, The Organisation, Economics, and Policy of Scientific Research, Turin, Italy. Retrieved from the World Wide Web November 14, 2014:
http://hdl.handle.net/2027.42/78307
Poteete, A.R. & Ostrom, E. (2008) Fifteen Years of Empirical Research on Collective Action in Natural Resource Management: Struggling to Build Large-N Databases Based on Qualitative Research. World Development36(1), pp 176-195. doi:10.1016/j.worlddev.2007.02.012
Romero Lankao, P. & Qin, H. (2011) Conceptualizing urban vulnerability to global climate and environmental change. Current Opinion in Environmental Sustainability3(3), pp 142-149. doi:10.1016/j.cosust.2010.12.016
Romero Lankao, P., Qin, H., & Dickinson, K. (2012) Urban vulnerability to temperature-related hazards: A meta-analysis and meta-knowledge approach. Global Environmental Change22(3), pp 670-683.
doi:10.1016/j.gloenvcha.2012.04.002
Rudel, T. K. (2008). Meta-analyses of case studies: a method for studying regional and global environmental change. Global Environmental Change18(1), pp 18-25. doi:10.1016/j.gloenvcha.2007.06.001
Sandelowski, M., Voils, C. I., & Barroso, J. (2007) Comparability work and the management of difference in research synthesis studies. Social Science & Medicine64(1), pp 236-247. doi:10.1016/j.socscimed.2006.08.041
Sandusky, R. J., Palmer, C. L., Allard, S., Cragin, M. H., Cruse, P., Renear, A., & Tenopir, C. (2009) The DataNet partners: Sharing science, linking domains, curating data. In Proceedings of the American Society for Information Science and Technology46. doi:10.1002/meet.2009.1450460141
Vardigan, M., Heus, P., & Thomas, W. (2008) Data Documentation Initiative: Toward a Standard for the Social Sciences. International Journal of Digital Curation3(1), pp 107-113. doi:10.2218/ijdc.v3i1.45
Wallis, J. C., Rolando, E., & Borgman, C. L. (2013) If we share data, will anyone use them? Data sharing and reuse in the long tail of science and technology. PLoS ONE 8(7), p e67332. doi:10.1371/journal.pone.0067332
Wallis, J. C., Mayernik, M. S, Borgman, C. L., & Pepe, A. (2010) Digital libraries for scientific data discovery and reuse: from vision to practical reality. Proceedings of the 10th Annual Joint Conference on Digital Libraries. Gold Coast, Queensland, Australia: ACM Press, pp 333-340. doi:10.1145/1816123.1816173
White, H. C. (2010) Considering Personal Organization: Metadata Practices of Scientists. Journal of Library Metadata10(2/3), pp 156-172. doi:10.1080/19386389.2010.5063961
Williams, D.N., et al. (2009) The Earth System Grid: Enabling access to multimodel climate simulation data. Bulletin of the American Meteorological Society90(2), pp 195-205. Retrieved from the World Wide Web October 29, 2014: http://dx.doi.org/10.1175/2008BAMS2459.1