PJP/2012/FKM93C0/S01054
IDENTIFICATION
IDENTIFICATIONIDENTIFICATIONIDENTIFICATION OFOFOFOF SURFACESURFACESURFACESURFACE ANDANDANDAND SUB-SURFACESUB-SURFACESUB-SURFACESUB-SURFACE DEFECTSDEFECTSDEFECTSDEFECTS ININININ GEARGEARGEARGEAR BYBYBYBY USING
USING USING
USING THERMOGRAPHICTHERMOGRAPHICTHERMOGRAPHICTHERMOGRAPHIC TECHNIQUETECHNIQUETECHNIQUETECHNIQUE
NURUL
NURULNURULNURUL HILWAHILWAHILWAHILWA BINTIBINTIBINTIBINTI MOHDMOHDMOHDMOHD ZINIZINIZINIZINI
RESEARCH RESEARCH RESEARCH
RESEARCH VOTEVOTEVOTEVOTE NO:NO:NO:NO: PJP/2012/FKM93C0/S01054
Fakulti
FakultiFakultiFakulti KejuruteraanKejuruteraanKejuruteraanKejuruteraan MekanikalMekanikalMekanikalMekanikal Universiti
UniversitiUniversitiUniversiti TeknikalTeknikalTeknikalTeknikal MalaysiaMalaysiaMalaysiaMalaysia MelakaMelakaMelakaMelaka
PJP/2012/FKM93C0/S01054
IDENTIFICATION
IDENTIFICATIONIDENTIFICATIONIDENTIFICATION OFOFOFOF SURFACESURFACESURFACESURFACE ANDANDANDAND SUB-SURFACESUB-SURFACESUB-SURFACESUB-SURFACE DEFECTSDEFECTSDEFECTSDEFECTS ININININ GEARGEARGEARGEAR BYBYBYBY USING
USING USING
USING THERMOGRAPHICTHERMOGRAPHICTHERMOGRAPHICTHERMOGRAPHIC TECHNIQUETECHNIQUETECHNIQUETECHNIQUE
NURUL
NURULNURULNURUL HILWAHILWAHILWAHILWA BINTIBINTIBINTIBINTI MOHDMOHDMOHDMOHD ZINIZINIZINIZINI
FAKULTI
FAKULTIFAKULTIFAKULTI KEJURUTERAANKEJURUTERAANKEJURUTERAANKEJURUTERAAN MEKANIKALMEKANIKALMEKANIKALMEKANIKAL UNIVERSITI
UNIVERSITI
UNIVERSITIUNIVERSITI TEKNIKALTEKNIKALTEKNIKALTEKNIKAL MALAYSIAMALAYSIAMALAYSIAMALAYSIA MELAKAMELAKAMELAKAMELAKA
i ACKNOWLEDGEMENT
ACKNOWLEDGEMENTACKNOWLEDGEMENTACKNOWLEDGEMENT
First of all, I am grateful to the Almighty God for enabling me to complete this research project.
I wish to take this opportunity to thank all my fellow research group members for their expert, sincere and valuable guidance .
I want to express my utmost gratitude to my employer, Universiti Teknikal Malaysia Melaka for providing the financial aspect to fund this project and also for providing me with all the necessary facilities.
ABSTRACT ABSTRACT ABSTRACTABSTRACT
TABLE
TABLETABLETABLE OFOFOFOF CONTENTSCONTENTSCONTENTSCONTENTS
CHAPTER CHAPTER
CHAPTERCHAPTER TITLETITLETITLETITLE PAGEPAGEPAGEPAGE NONONONO
ACKNOWLEDGEMENT ACKNOWLEDGEMENT
ACKNOWLEDGEMENTACKNOWLEDGEMENT i
ABSTRACT ABSTRACT
ABSTRACTABSTRACT ii
TABLE TABLE
TABLETABLE OFOFOFOF CONTENTSCONTENTSCONTENTSCONTENTS iii LIST
LIST
LISTLIST OFOFOFOF FIGURESFIGURESFIGURESFIGURES v LIST
LIST
LISTLIST OFOFOFOF TABLESTABLESTABLESTABLES vii LIST
LIST
LISTLIST OFOFOFOF SYMBOLSSYMBOLSSYMBOLSSYMBOLS viii
CHAPTER CHAPTER
CHAPTERCHAPTER 1111 INTRODUCTIONINTRODUCTIONINTRODUCTIONINTRODUCTION 1
1.1 Research Background 1
1.2 Problem statement 2
1.3 Objective 2
1.4 Scope of Work 2
1.5 Result Prediction 3
CHAPTER CHAPTER
CHAPTERCHAPTER 2222 LITERATURELITERATURELITERATURELITERATURE REVIEWREVIEWREVIEWREVIEW 4
2.1 Gear Parameter 4
2.2 Introduction of Gear Failure 6
2.2.1 Scuffing 6
2.2.2 Chipping 7
2.2.3 Wear 7
2.2.4 Pitting 7
2.2.5 Spalling 9
2.3.1 Infrared Thermography 11
2.3.2 Thermocouple 12
2.3.3 Laser Thermometer 12
2.4 Comparison Between Themocouple & Laser Themometer 13
2.5 BS ISO Calculation 14
CHAPTER CHAPTER
CHAPTERCHAPTER 3333 METHODOLOGYMETHODOLOGYMETHODOLOGYMETHODOLOGY 16
3.1 Introduction 16
3.2 Experiment 16
3.2.1 Misalignment Torque Device 18
3.2.2 Gear Specification 18
3.2.3 Lubrication Oil 19
3.3 Experimental Procedure . 20
3.3.1 Load installation procedure 20 3.3.2 Machine Operation Procedure 23 3.3.3 Temperature Recording Procedure 24
3.4 Flowchart 25
CHAPTER CHAPTER
CHAPTERCHAPTER 4444 RESULTSRESULTSRESULTSRESULTS ANDANDANDAND DISCUSSIONDISCUSSIONDISCUSSIONDISCUSSION 26 4.1 Calculation Using British Standard BS-ISO 6336-2 26 4.1.1 Calculation On Theoretical Load On Helical Gear, Ft 30
4.2 Theoretical Result 34
4.3 Experimental Result 35
4.4 Discussion 39
CHAPTER CHAPTER
CHAPTERCHAPTER 5555 CONCLUSIONCONCLUSIONCONCLUSIONCONCLUSION ANDANDANDAND DISCUSSIONDISCUSSIONDISCUSSIONDISCUSSION 41
5.1 Conclusion 41
5.2 Suggestions 42
REFERENCES REFERENCES
LIST LIST LIST
LIST OFOFOFOF FIGURESFIGURESFIGURESFIGURES
NO NO
NONO TITLETITLETITLETITLE PAGEPAGEPAGEPAGE NONONONO
2.1 Helical angle, face width and pitch diameter of a helical gear 5
2.2 Pressure angle 5
2.3 Scuffing 6
2.4 Gear tooth debris 7
2.5 Micropitting 8
2.6 Macropitting 9
2.7 Spalling 10
2.8 Infrared Thermography Technique 11
2.9 Thermocouple 12
2.10 Laser thermometer 13
3.1 Schematic Diagram of Gear Test Rig 17
3.2 torque device 18
3.3 Helical Gear 18
3.4 Lubrication oil 19
3.5 Gear Test Rig 20
3.6 Protective cap of the test rig that has been opened 21 3.7 Indicator on misalignment torque device 21
3.8 Gear barrier 22
3.9 Lever fitted with load 22
3.10 Speed Adjuster Device 23
3.11 Tachometer 24
NO NO
NONO TITLETITLETITLETITLE PAGEPAGEPAGEPAGE NONONONO
LIST LIST
LISTLIST OFOFOFOF TABLESTABLESTABLESTABLES
NO NO
NONO TITLETITLETITLETITLE PAGEPAGEPAGEPAGE NONONONO
2.1 Comparison between various heat sensors 14
2.2 Information on gear operation 15
3.1 Gear and its load 17
3.2 Gear specification 19
4.1 Result from the calculation 30
4.2 KA,Kv,KHβ,KHα and ZB for helical and spur gears 32
4.3 Stress relation 33
4.4 Factors to be considered 33
4.5 Load value and damage start time based on BS ISO 6336-2 35
4.6 Experiment Information 35
LIST LIST LIST
LIST OFOFOFOF SYMBOLSSYMBOLSSYMBOLSSYMBOLS
H
σ Application Factor
HO
σ Nominal Value of Stress Relation At Pitch Pint
A
K Application Factor
V
K Dynamic Factor
β
H K
Face Load On Stress Relation factor
α
H K
Horizontal Load On Stress Relation Factor ε
Z Relation Ratio Factor
b
β Helical Based Angle
wt
α
Stress Across Pitch Cylinder Angle
t
α Stress Across Reference Cylinder Angle
NT
Z Life Stress Relation Factor
L
Z Lubrication factor
V
Z Speed Factor
R
Z Roughness Factor
X
Z Size Factor
lim H
CHAPTER CHAPTERCHAPTERCHAPTER 1111
INTRODUCTION INTRODUCTIONINTRODUCTIONINTRODUCTION
1.1 1.1
1.11.1 ResearchResearchResearchResearch BackgroundBackgroundBackgroundBackground
The purpose of this report is to predict the life expectancy of gear using thermal analysis.
Gear is a machine that is used as a medium to transmit power by using rotary motion with the
help of gear tooth movement. Gear has been used for more than three thousand years and is
regarded as an important element in current machinery [1]. However, frequent gear usage will
result in gear tooth damage and eventually will cause the gear to be malfunctioned.
Gear failure can be divided into two main categories. The first one is the failure on gear
tooth while the second failure is when the damage occurs on gear tooth surface [2-5]. The failure
on gear tooth is mainly caused by alignment problem. These problems can be reduced, even
eliminated by practicing correct procedure when assembling gear. Failure on gear tooth surface
is usually caused by critical operation parameters such as loading, lubrication oil and applied
speed [3-5] and will resulted in temperature increase and eventually will cause further damage on
the gear.
Due to these problem, this project is conducted to investigate and predict the life
expectancy of gear by using thermal analysis. There are lots of methods that can be applied to
predict gear life expectancy such as vibration analysis, oil analysis,wear debris analysis and also
thermal analysis. A standard to determine gear life expectancy which consists of mathematical
equations has been developed by organizations such as AGMA, BS and ISO. These equations is
2
Life expectancy prediction and verification of these standards is a research approach that
represents actual use of gear [6].
1.2 1.2
1.21.2 PPPProblemroblemroblemroblem StatementStatementStatementStatement
Gear is defined as machine element that is used to transmit power using shaft rotation
with the help of gear tooth movement. However, the frequent gear usage will cause gear damage
due to friction that occurs on gear when it is in rotary movement. Friction from the gear
movement will develop heat energy that will cause gear temperature to increase and affect the
condition of gear tooth. This research is conducted to investigate gear life expectancy using
thermal analysis to prevent sudden gear tooth failure.
1.3 1.3
1.31.3 OOOObjectivebjectivebjectivebjective
The objective of this project is to predict the life expectancy of helical gear using the
method of thermal analysis with varied loading.
1.4 1.4
1.41.4 SSSScopecopecopecope ofofofof WorkWorkWorkWork
Experimental work is required to achieve the objective of this project. Thermal analysis
will be conducted using helical gear that is attached to a test rig. When the test rig is in operation,
temperature data will be taken and analyzed using the method of graph trend. Based on the data
obtained, it will be compared to British standard calculations. The comparison is required to find
3
1.5 1.5
1.51.5 RRRResultesultesultesult PredictionPredictionPredictionPrediction
It is predicted that higher loading will increase the gear temperature. Therefore, the result
obtained from this project will provide the information to predict gear life expectancy
CHAPTER CHAPTERCHAPTERCHAPTER 2222
LITERATURE LITERATURE LITERATURE
LITERATURE REVIEWREVIEWREVIEWREVIEW
2.1 2.1
2.12.1 GearGearGearGear ParameterParameterParameterParameter
When gear moves, its tooth surface will rotate and slide against each other. This gear
movement will lead to a clash between two gear teeth causing shear stress and resulting in gear
tooth damage. Oil is used to lubricate the movement of the gear teeth thus prevent damage to the
surface of the gear teeth. Oil is also used as a cooling agent to avoid temperature becomes too
hot. Gear design parameters are used to evaluate the durability of the gear. These parameters are
pitch line velocities, helical angle, axial velocity, the width of the face gears, gear pressure angle,
gear surface roughness, power and lubricating properties [8].
Helical gear angle is located between the gear teeth and the axial axis of the pitch circle
(see Figure 2.1). Most angle helical gear values are between 5° to 20°. Larger helical angle will
produce greater axis thrust. If the helical angle is lower, pitch line velocity will be higher. Thus,
if the velocity increases, this will cause the heating due to friction between the air and fuel
mixture trapped in the gear teeth. This effect causes the surface temperature of the gear tooth to
5 Figure
Figure
FigureFigure 2.12.12.12.1 ::::Helical angle, face width and pitch diameter of a helical gear [8]
Pressure angle is the slope of the gear tooth on the pitch circle. The most common
pressure angle for helical gears is 20°. Rough surface gear will result in larger friction between
gear teeth. Greater friction means higher temperature will be produced that will reduce oil
viscosity where oil film will be thinned. Lower viscosity can increase the risk of damage to a
gear [8].
Figure Figure Figure
[image:15.612.194.419.409.638.2]6 2.2
2.2
2.22.2 IntroductionIntroductionIntroductionIntroduction ofofofof GearGearGearGear FailurFailurFailurFailureeee
When the gear moves, its tooth surface will rotate and slid against each other. This
movement will lead to a clash between two gear teeth causing shear stress and damage to the
gear teeth. Type of damage that often occurs on the gear teeth is as
follows:-1. Scuffing
2. Chipping
3. Wear
4. Pitting
5. Spalling
2.2.1 2.2.1
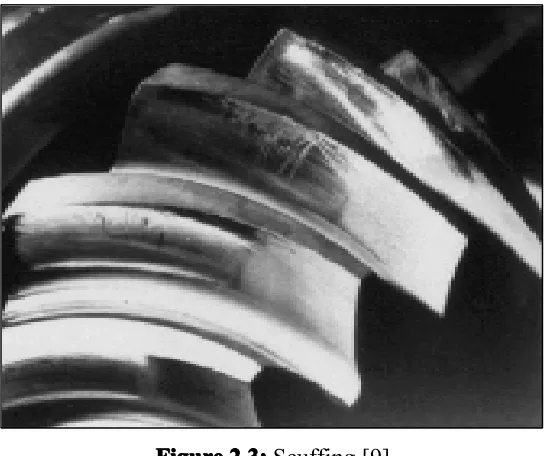
2.2.12.2.1 ScuffingScuffingScuffingScuffing
Scuffing occurs when oil thickness is less than composite roughness on gear due to
clashing of metals [8]. Figure 2.1 shows the damage caused by scuffing.
Figure
[image:16.612.170.443.401.629.2]7 2.2.2
2.2.2
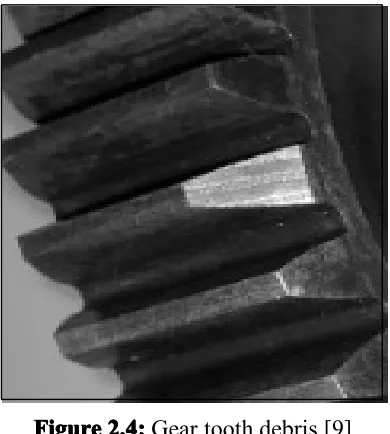
2.2.22.2.2 ChippingChippingChippingChipping
Gear teeth debris is one of the effects of failure on the gear, but the effect was not
generally due to the gear teeth. It usually occurs as a result of outside force such as foreign object
in the unit, loose gear installation or failed teeth from another gear.
Figure Figure
FigureFigure 2.4:2.4:2.4:2.4:Gear tooth debris [9]
Damage caused by scuffing and pitting is normally not regarded as gear teeth wear.
2.2.3 2.2.3
2.2.32.2.3 WearWearWearWear
Wear is defined as the removal or transfer of metal from the surface of the gear tooth. Wear will
result in thickness reduction of gear teeth and also change the contour of gear teeth [8].
2.2.4 2.2.4
2.2.42.2.4 PittingPittingPittingPitting
Surface damage such as pitting can be classified into two groups:
1. Micropitting
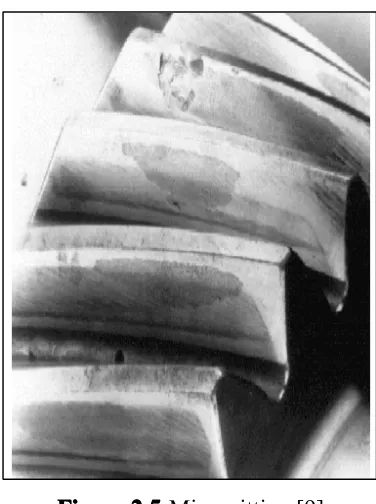
[image:17.612.210.405.194.411.2]8 Micropitting are phenomenan where there is a small hole on the gear teeth. Micropitting
happens when the oil film between the elements is equal to the average thickness of the
roughness of the two surfaces. When this happens, part of the loading is supported by the oil film.
Collisions between gear teeth will cause temperature increase and oil viscosity decreased which
will cause gear clash and further damage. Damage to the surface of the gear teeth is known as
micropitting. Micropitting can have a huge impact on the surface, causing increased pressure and
damage. Micropitting can also lead to secondary failure as macropitting, scuffing, and flexural
bending. Micropitting size is difficult to see with naked eye and can only be detected with the aid
of vision such as the lens.Micropitting on gear design which will cause an increase in loading on
gear, vibration, temperature, and will produce noise [8].
Figure Figure
FigureFigure 2.5:2.5:2.5:2.5:Micropitting [9]
However, macropitting also is a phenomenon that occurs on the surface of damaged gear
teeth. It usually happens if there are high asperities or metal clashing on the gear teeth.
Macropitting occurs due to failure pressure of the collision caused by gear tooth .Spalling is
caused by macropitting, and can be considered as the final stage of macropitting. Normally, in
the use of high spped gear, surface finishing is usually very thin and the oil film is usually thick
[image:18.612.211.399.294.546.2]9 Figure
Figure Figure
Figure 2.6:2.6:2.6:2.6:Macropitting [9]
2.2.5 2.2.5
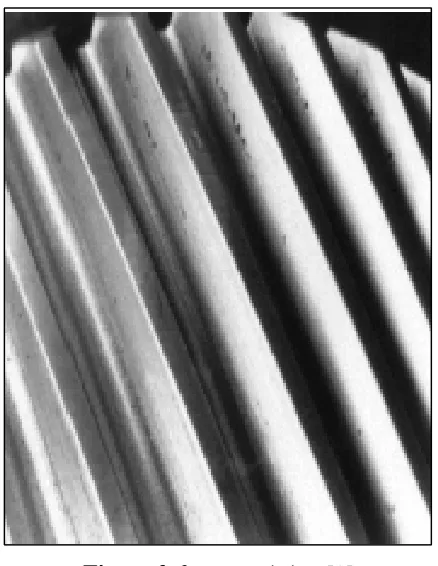
2.2.52.2.5 SpallingSpallingSpallingSpalling
Spalling is a term used to describe a situation where the damage occurred in majority part
of a gear tooth surface. Spalling can also be considered as the final stage of macropitting.
Spalling is caused by high stresses that occur on the surface of the gear tooth surface. Even
though gear tooth surface is hardened, defects such as spalling on the surface or subsurface of the
[image:19.612.197.416.89.372.2]10 Figure
[image:20.612.156.456.69.311.2]Figure Figure
Figure 2.7:2.7:2.7:2.7:Spalling [9]
2.3 2.3
2.32.3 GearGearGearGear DamageDamageDamageDamage IdentificationIdentificationIdentificationIdentification
Referring to the Martinaglia 1972, it is indicated that high speed helical gear is
interrupted by the non-uniform temperature distribution over the gear surface. At a very high
speed, overheating of the oil and gear can occur when gear is in operation. Thermal method is a
technique that allows measurement or visualization of temperature on the surface with sufficient
accuracy. This technique does not require any contact with the surface; therefore, it has the
advantage of not disturbing the operation when the machine is working [10]. Good performance
and easy to use has made this technique very popular in the maintenance engineering sector. This
technique has been used in various sectors such as mechanical, electrical, petrochemical,
material, medical, and structures, buildings, etc. [11].
There are lots of available methods to determine temperature reading such
as:-1. Infrared Thermography
2. Thermocouple
11 2.3.1
2.3.1
2.3.12.3.1 InfraredInfraredInfraredInfrared ThermographyThermographyThermographyThermography
One method of measuring the temperature or the heat is to use infrared thermography.
This method is a technique that allows measurement and visualization. Visualization can be done
because there are cameras that enable high-resolution images to be captured with the exact
temperature at which different in the area to be studied.
Most of these cameras make thermal transient capture. These transients are presented by
means of image sequences, which allows us to obtain the temperature evolution of a captured
image, as well as to calculate various statistical parameters related to the heat map [10]. Infrared
cameras do not measure temperature directly on surface. Camera detector device is sensitive to
flashes produced by objects in research. This device can capture the electromagnetic spectrum in
the infrared band, ranging from 0.78 μm to 1000 μm [12].
The study of damage using thermal image and vibration signals were conducted and it
was found that test performance using vibration data is better than the heat image. It is stated that
the data from the vibration produces better results in determining the damage to the machine [12].
In contrast to studies that have been conducted, infrared thermography technique can provide
very valuable information in diagnosing damage that occurring in the machine [10].
Figure
12 2.3.2
2.3.2
2.3.22.3.2 ThermocoupleThermocoupleThermocoupleThermocouple
Thermocouple is a temperature measuring device consisting of two different conductors
made contact with each other at one or more places. Due to ease of use, and relatively low
cost, thermocouple is widely used to measure temperature. However, thermocouple has a
weakness in terms of temperature measurement accuracy in measuring temperature.
.
Figure Figure Figure
Figure 2.9:2.9:2.9:2.9:Thermocouple
2.3.3 2.3.3
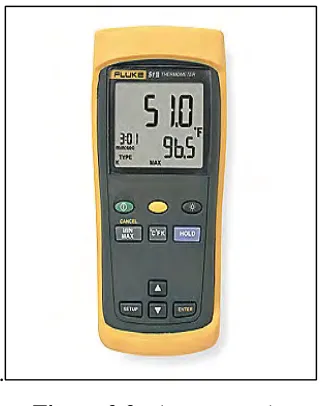
2.3.32.3.3 LaserLaserLaserLaser ThermometerThermometerThermometerThermometer
In this report, verification of thermal analysis for helical gears on a test rig is studied.
This aim of this study is to obtain temperature data on helical gears during operation. In this
study, a simple method of measuring temperature is to use a mini infrared temperature. Mini
infrared temperature is used because it has the same characteristics with infrared thermography
for not disturbing the surface of the gear when the gear is operating. Mini infrared temperature is
a thermometer that measures the temperature from the radiation produced by this object.
Sometimes it is called laser thermometers or temperature pistol to reflect the ability of these
devices to measure temperature from a far distance. By knowing the amount of infrared energy
[image:22.612.245.408.214.417.2]13 Based on the information available, laser thermometer is more expensive than
thermocouple but many infrared radiation is applied in measuring the temperature in the area
where blackouts are high or the temperature is high. Because the infrared sensor can measure far
from the point of measurement, vibration problems can be eliminated. In addition, laser
thermometer has a fast response to temperature changes [13].
Figure Figure Figure
Figure 2.102.102.102.10 ::::Laser thermometer
2.4 2.4
2.42.4 ComparisonComparisonComparisonComparison BetweenBetweenBetweenBetween ThemocoupleThemocoupleThemocoupleThemocouple &&&& LaserLaserLaserLaser ThemometerThemometerThemometerThemometer
Temperature measurement can be achieved using a variety of sensing mechanisms.
Temperature measurement system usually consists of sensors, conveyor systems, external power
supply system (for some types of systems), and the wiring that connects the system components.
Temperature measurement sensors that are commonly used in engineering applications are
thermocouple dan infrared (IR) thermometer [13]. The table below shows a comparison between
-14 Table
Table Table
Table 2.1:2.1:2.1:2.1:Comparison between various heat sensors [13]
Based on Table 2.1, it is shown that the use of a thermocouple is less accurate than using
a laser thermometer. Compared to laser thermometer, thermocouple exceeds both the number of
advantages and also disadvantages. Inaccurate temperature calculation; less sensitive and
unstable readings is the reason why thermocouple is not selected in this research. Laser
temperature is chosen due to its quick response. Because of its capability of measuring long
distances, vibration problems can be avoided when taking temperature readings.
2.5 2.5
2.52.5 BSBSBSBS ISOISOISOISO CalculationCalculationCalculationCalculation
In this project, the standard theory as AGMA (American Gear manufactures Association),
ISO (International Standards Organization) and BS (British Standard) is very useful to predict
[image:24.612.97.518.113.416.2]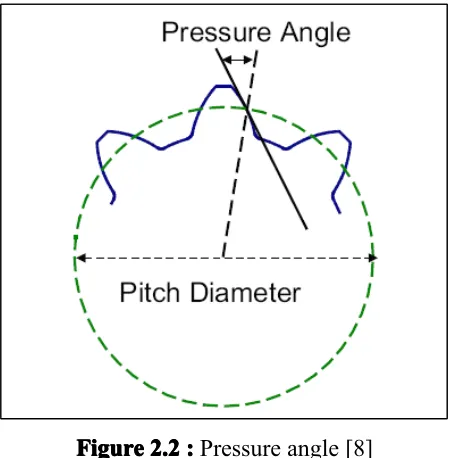
![Figure 2.7:2.7:2.7:2.7:Spalling [9]](https://thumb-us.123doks.com/thumbv2/123dok_us/138713.15857/20.612.156.456.69.311/figure-spalling.webp)
![TableTableTableTable 2.1:2.1:2.1:2.1: Comparison between various heat sensors [13]](https://thumb-us.123doks.com/thumbv2/123dok_us/138713.15857/24.612.97.518.113.416/tabletabletabletable-comparison-between-various-heat-sensors.webp)
