City, University of London Institutional Repository
Citation:
Northcott, S., Marshall, J. & Hilari, K. (2016). What factors predict who will have a strong social network following a stroke?. Journal of Speech Language and Hearing Research, doi: 10.1044/2016_JSLHR-L-15-0201This is the accepted version of the paper.
This version of the publication may differ from the final published
version.
Permanent repository link:
http://openaccess.city.ac.uk/13189/Link to published version:
http://dx.doi.org/10.1044/2016_JSLHR-L-15-0201Copyright and reuse: City Research Online aims to make research
outputs of City, University of London available to a wider audience.
Copyright and Moral Rights remain with the author(s) and/or copyright
holders. URLs from City Research Online may be freely distributed and
linked to.
1
What factors predict who will have a strong social network following a
stroke?
Sarah Northcott, Jane Marshall, Katerina Hilari
Affiliation (same for all authors): Division of Language and Communication Science, School of Health Sciences, City University London
Running head: post-stroke social networks
Contact author details:
Dr Sarah Northcott (first and corresponding author) Division of Language and Communication Science School of Health Sciences
City University London Northampton Square London EC1V 0HB UK
[email protected] Tel: +44 (0) 7810 252 862
Professor Jane Marshall
Division of Language and Communication Science School of Health Sciences
City University London Northampton Square London EC1V 0HB UK
[email protected] Tel: +44 (0) 207 040 4668
Dr Katerina Hilari
Division of Language and Communication Science School of Health Sciences
City University London Northampton Square London EC1V 0HB UK
2
What factors predict who will have a strong social network following a
stroke?
Abstract
Purpose: Measures of social networks assess the number and nature of a person's social
contacts, and strongly predict health outcomes. We explored how social networks change
following a stroke and analysed concurrent and baseline predictors of social networks six
months post stroke.
Method: Prospective longitudinal observational study. Participants were assessed two weeks (baseline), three months and six months post stroke. Measures included: Stroke Social
Network Scale; MOS Social Support Survey; NIH Stroke Scale; Frenchay Aphasia Screening
Test; Frenchay Activities Index; and the Barthel Index. ANOVA and standard multiple
regression were used to analyse change and identify predictors.
Results: 87 participants (37% with aphasia) were recruited; 71 (16% with aphasia) were followed up at six months. Social network scores declined post stroke (p = .001). While the
Children and Relatives factors remained stable, the Friends factor significantly weakened (p
<.001). Concurrent predictors of social network at six months were: perceived social support,
ethnicity, aphasia and extended ADL (adjusted R2 = .42). There were two baseline predictors: pre-morbid social network and aphasia (adjusted R2 = .60).
Conclusions: Social networks declined post stroke. Aphasia was the only stroke-related
3
Introduction
Having a stroke can profoundly alter a person’s social relationships. A recent systematic
review of 70 research reports exploring the impact of stroke on social support found that after
stroke contact with friends and involvement in social activities reduced, and there was strain
within the family unit (Northcott, Moss, Harrison, & Hilari, 2015). Further, there was a
consistent association between poor social support and feeling depressed (13/14 studies);
aspects of the social network were also associated with depression (7/8 studies) (Northcott et
al., 2015). For example, in one study having few social contacts outside the house was found
to be the strongest predictor of depression in stroke survivors at 12 months, two years and
three years follow up (Astrom, Adolfsson, & Asplund, 1993).
Research into social relationships has distinguished between functional social support (e.g.
the provision of supportive ‘functions’ such as practical or emotional support) and the
structure of a person’s social relationships, or their ‘social network’ (Cohen & Wills, 1985).
Measures of a person’s social network typically assess size of network; composition of
network (for example, whether network members are friends, family, neighbours); frequency
of contact (either face to face or remote, for example, speaking on the phone); proximity
(how close by network members live); and community or group participation (Berkman,
Glass, Brissette, & Seeman, 2000). Social network measures may also assess a person’s
satisfaction with their network, and the extent to which their social network fulfils their needs
(Bowling, 1997).
There has been growing evidence linking social relationships, particularly the density and
frequency of social contact, to physical health. Berkman and Syme (1979) measured the
social networks of 4,775 adults in Alameda County, California. Their study was the first to
4
marital status). They found that those with strong social networks had a reduced mortality
risk of nine years. This initial finding has subsequently been replicated in many other studies.
In a recent meta-analysis of 148 prospective studies measuring social relationships and
illness-related mortality it was found that those with stronger social networks had a 50%
increased likelihood of survival compared with participants with weaker social networks
(Holt-Lunstad & Smith, 2012). They concluded that the influence of social relationships is
comparable to other risk factors such as obesity, alcohol abuse and air pollution, and that
having reduced social contact is ‘equivalent to smoking up to 15 cigarettes a day (p43).’ In
terms of the stroke population, a study tracking 655 stroke survivors over five years reported
that those who were socially isolated were 1.4 times more likely to have an adverse outcome
event (myocardial infarction, recurrent stroke, death) (Boden-Albala, Litwak, Elkind,
Rundek, & Sacco, 2005).
Consideration of a person’s social context has also become increasingly important in
healthcare planning and provision. The World Health Organisation’s current definition of
health, first stated in 1948, is that it is ‘a state of complete physical, mental and social
well-being and not merely the absence of disease of infirmity’ (World Health Organisation, 2013).
This represents a shift away from the traditional medical model of considering only mortality
and morbidity, towards a more positive concept of well-being encompassing physical, mental
and social components (Berzon, Hays, & Shumaker, 1993). In 2001, the WHO developed the
International Classification of Functioning, Disability and Health (WHO-ICF) (World Health
Organisation, 2001), which they describe as a biopsychosocial model of health and
health-related states. The emphasis is on measuring levels of health and functioning rather than
disability, and it includes domains related to body function and structure, activity and
participation, and environmental and personal factors. Included within the activity and
5
and ‘community, social and civic life’; further the environmental domain acknowledges the
key role of ‘support and relationships’. This shift towards recognising the role of social
relationships and social participation is reflected in best practice documents relating to stroke
care. For example, the UK National Stroke Strategy states that the key aim of stroke
rehabilitation should be to ‘achieve a good quality of life’ (p34), with consideration given to
family relationships and community participation (Department of Health, 2007).
Thus there exists a body of research documenting the vulnerability of social networks post
stroke, and the adverse consequences of having weak social ties. There is also broad
consensus that it is within the remit of healthcare provision to consider the social impact of
healthcare states. However, there is to date no research analysing what factors predict social
network functioning following a stroke. Understanding who is vulnerable to losing contact
with their social network may help to target resources and design therapy services more
effectively.
In the present study we were also interested in considering whether the social experiences of
those with aphasia differed from other stroke survivors. People with aphasia are excluded
from most stroke research exploring social networks (Northcott et al., 2015). Even where
people with aphasia have been included, often researchers have relied on proxies (Astrom et
al., 1993; Boden-Albala et al., 2005) although there are concerns that proxy responses are not
commensurate with self-report (Hilari, Owen, & Farrelly, 2007). This may potentially bias
results: a recent retrospective analysis of pooled clinical trial data (n = 8,904) reported that 45% of stroke survivors initially presented with aphasia, and by three months the aphasia
persisted for 24% of stroke survivors (Ali, Lyden, & Brady, 2015). Those studies recruiting
only people with aphasia have reported high levels of social isolation (Parr, 2007), smaller
social networks than age-matched controls (Cruice, Worrall, & Hickson, 2006b), reduced
6
(Fotiadou, Northcott, Chatzidaki, & Hilari, 2014). Given that social networks provide the
context for communication, goals focusing on social participation and enabling people to
maintain social relationships have increasingly become part of aphasia therapy (Pound, Parr,
Lindsay, & Woolf, 2000; Simmons-Mackie et al., 2014; Vickers, 2010). Documenting what
happens to social networks, and identifying which elements are particularly vulnerable, may
assist aphasia clinicians when considering social therapy goals. Further, including both those
with and without aphasia in a stroke study may tease apart the particular impact of aphasia
over and above other stroke related disability.
The aims of this study were to address the following research questions:
Do social networks become weaker following a stroke, and which domains of the network are
most vulnerable?
What concurrent factors predict social network functioning six months post stroke?
What factors at the time of the stroke (baseline) predict social network functioning six
months later?
Methods
This study formed part of a larger study assessing quality of life following a stroke (Hilari et
al., 2009). The study was approved by the relevant National Health Service (NHS) local
research ethics committees.
Participants
Participants were recruited from two acute stroke units based in London teaching hospitals.
Eligibility criteria comprised: first ever stroke; over 18 years old; and being admitted to
7
the stroke; severe co-morbidity (for example, terminal cancer or severe Parkinson’s Disease);
being unable to give informed consent; known history of mental health problems or cognitive
decline prior to the stroke; not speaking English pre-morbidly. In addition, for those
participants with severe receptive aphasia (scoring <7/15 on the receptive domains of the
Frenchay Aphasia Screening Test (Enderby, Wood, Wade, & Hewer, 1987)) proxy
respondents were used (n = 9): these results are not reported in this paper. Participants with
any severity of expressive aphasia and mild to moderate receptive aphasia were able to
self-report on all the measures used.
Procedures and methods
Participants were interviewed within two weeks of having the stroke while still in hospital
(baseline), and followed up at three months and six months post stroke (± one week). In order
to facilitate the responses of those with aphasia, the presentation of each measure was
adjusted in line with best practice (Rose, Worrall, Hickson, & Hoffmann, 2011). For
example, key words were printed in bold, large font was used (minimum 14), few items were
presented on each per page, pictures supported text as appropriate, and practice items were
incorporated into each scale to ensure participants understood the response format. All
interviews were carried out face to face by aphasia-specialist speech and language therapists,
who read out the questions, and provided additional communicative support as appropriate
(e.g. gesture, objects in the environment). Participants were able either to verbalise or point to
their preferred response option. The wording of questions and response options were not
altered, however, so as to preserve the psychometric properties of the measures. On occasion,
if a participant became tired, interviews were completed over two sessions. All measures
used in this project have either been successfully adapted for this client group in previous
research (Hilari, Wiggins, Roy, Byng, & Smith, 2003) or validated on people with aphasia
8
Measures
An aim of this study was to explore whether social networks become weaker following a
stroke. In order to do this, we asked participants during the baseline interview to reflect on
their social network in the month prior to the stroke. We also asked them to reflect on their
perceptions of feeling supported and extended activities of daily living before the stroke. All
other measures administered at baseline collected information on post stroke functioning (e.g.
stroke severity).
To explore social networks following a stroke, it was desirable to use a scale measuring
overall social network functioning, validated for the stroke population including those with
aphasia. As no such scale existed, we adapted pre-existing social network questions, used in
previous research with a comparable population (those with chronic aphasia) (Hilari &
Northcott, 2006). The development and psychometric evaluation of the resulting Stroke
Social Network Scale (SSNS) has been described in detail elsewhere (Northcott & Hilari,
2013). Factor analysis was used to derive five subdomains: children; relatives; friends;
groups; and satisfaction with social network. These subdomains explained 63% of the
variance. There was good evidence for the scale’s internal consistency (α = 0.85),
acceptability, validity, and sensitivity to change (standardised response mean = 0.46); and it
was validated on both those with and without aphasia. The scale comprises 19 items, and
questions focus on frequency of contact (e.g. ‘In the past month, how often did you see your
children?’); proximity (e.g. ‘How many of your close friends live nearby?’); quantity (e.g.
‘How many close relatives do you have?’); and satisfaction (e.g. ‘How satisfied are you
overall with your social network?’). Items are grouped into the different subdomains, so for
example, the four questions relating to friendship make up the ‘Friends’ subdomain. In terms
of the Friends and Relatives subdomains the focus is on close relationships, and the following
9
Overall scores range from 0 to 100, with higher scores indicating a better functioning social
network (i.e. more frequent social contact, higher levels of satisfaction with their social
network). Scale development analyses were carried out with the present sample of
participants. To avoid circularity, all psychometric analyses of the SSNS other than
responsiveness were conducted on the three month data set; multiple regression analyses
reported in the present paper, where the SSNS is the Dependent Variable, were based on the
baseline and six month data sets only.
Availability of perceived social support was measured using the Medical Outcomes Studies
Social Support Survey (SSS) (Sherbourne & Stewart, 1991). This scale includes 19 functional
support items hypothesised to cover five dimensions: emotional support, informational
support, tangible (or practical) support; social companionship support; and affectionate
support. Scores range from 1 (support available ‘none of the time’) to 5 (support available ‘all
of the time’). The timeframe for questions on the SSS is ‘the past month’, and as stated
above, at baseline, participants were asked to consider the month prior to the stroke.
Extended activities of daily living was assessed using the Frenchay Activities Index (FAI)
(Wade, Legh-Smith, & Langton Hewer, 1985). The FAI focuses on general activities rather
than personal care, and there are three subdomains: domestic; leisure/work; outdoors. The
scale consists of 15 items, with scores ranging from 0 – 45, with higher scores indicating
better functioning. The timeframe for questions is the past three to six months; as with SSS
and SSNS, during baseline they were asked to consider their pre-morbid life.
Psychological distress was measured using the General Health Questionnaire-12 item version
(GHQ-12) (Goldberg, 1972); scores range from 0 to 12 with higher scores indicating greater
distress. The timeframe is ‘present and recent complaints’, and at baseline they were asked to
10
Stroke severity was measured using the National Institute for Health Stroke Scale (NIHSS)
(Brott et al., 1989). This is a 15-item scale used to examine neurological impairment. Total
scores range from 0 – 42, with higher scores reflecting more severe strokes. The Barthel
Index (BI) was used to measure activities of daily living (ADL) (Mahoney, Wood, & Barthel,
1958), with higher scores indicating a person is more able to carry out ADL independently
(score range: 0 – 100).
In terms of communication disabilities, aphasia was assessed using the Frenchay Aphasia
Screening Test (FAST) (Enderby et al., 1987). The FAST has four subscales which measure:
comprehension, verbal expression, reading and writing. In fact, a number of participants did
not complete the written portion of the FAST due to hemiparesis, poor literacy, and other
physical difficulties, so a decision was taken to use the short FAST comprising only the
comprehension and expression sections (range 0 -20, with higher scores indicating better
language function). The sensitivity of this shortened version of the FAST is reported to be
comparable to administering the complete assessment (Enderby et al., 1987). For interest,
data on presence/absence of aphasia is also presented. This was determined using the cut-off
scores from the FAST, and where this was not available, the NIH Stroke Scale aphasia item
was used. Dysarthria was scored using the single item from the NIH Stroke Scale, which
classifies people as ‘normal’, ‘mild-moderate’ or ‘severe’.
In addition to the measures outlined above, further information was gathered both from the
case history and from the medical notes including: age, sex, ethnicity, marital status, living
arrangements, and employment status. Information on the number of co-morbidities was also
recorded. Medical notes were used to determine whether the stroke was ischaemic or
haemorrhagic, stroke lateralization, and to classify stroke type using the Oxford Stroke
11
Data analysis
Descriptive statistics were used to summarise the data. To analyse change over time on the
SSNS, one-way repeated measures ANOVA was used. Post hoc tests were carried out using
Bonferroni correction.
Multiple regression assessed the relationship between the social network, and several
Independent Variables (IVs). Standard multiple regression was chosen (where all IVs are
entered into the equation simultaneously), as it best suited the research question: the relative
importance of potential predictors of social network after stroke has not been the subject of
previous research, thus a method which makes fewer assumptions about the relative
importance of IVs is more appropriate (Field, 2013). In terms of the ratio of cases to IVs, we
aimed to have at least 15 subjects per predictor (Field, 2013; Stevens, 1992). The number of
potential predictors was large, compared to the sample size. Only those variables which were
significantly associated with social network were entered into the equation, determined using
Pearson correlation coefficients, t-tests and ANOVAs as appropriate. Where there were too
many IVs significantly associated with social network, they were initially all entered into the
equation. IVs which were not statistically significant were removed, and the equation re-run
without them (Field, 2013). Other multiple regression assumptions were met for both models
presented (multicollinearity; the normality, homoscedasticity and independence of the
residuals; whether outliers were having an undue influence).
Results
Participant characteristics
The sample in this research is the same as that reported in Hilari et al. (2009). The number of
12
the project. Nine participants had very severe receptive aphasia, as screened by the FAST,
and nominated proxies: these results are not reported in this paper. The characteristics of the
remaining 87 participants (67%) are displayed in Table 1. The average age was 70 years old
(SD 14.1); most participants were white (75%), male (60%), and had two or more
co-morbidities (72%). At three months, 76 participants were followed up (87%), and at six
months 71 participants (82%). There was no significant difference between those who were
followed up, and those who were not, on any baseline variable (demographics, stroke
severity, ADL, aphasia, psychological distress, perceived social support and social network).
**Table 1 about here**
Table 2 provides descriptive statistics for the potential predictors of social network. Perceived
social support (SSS) remained stable, with no significant change between baseline
(pre-morbid levels) and six months post stroke. At six months, 50% of participants perceived
support to be available to them either most of the time or all of the time, scoring ≥ 4 (44% at
baseline).
The majority of participants had an ischaemic stroke (86%). Participants’ scores on the
NIHSS, measuring stroke severity, significantly decreased over time: Wilks’ Lambda = .41, F
(2, 65) = 45.87, p < .001. Similarly, there was significant improvement in Activities of Daily
Living (BI), Wilks’ Lambda = .50, F(2, 64) = 31.56, p < .001.
Thirty-two participants (37%) had aphasia at baseline, reducing to 11 participants (16%) by
six months. Short FAST scores showed significant improvement (Wilks’ Lambda = .61, F (2,
61) = 19.77, p < .001). Due to blindness (n = 2), deafness (n = 1), oral cancer/ severe
13
missing data on the short FAST (5% at baseline, 7% at six months): for these participants
presence of aphasia, as listed in Table 2, was determined using the NIH Stroke Scale aphasia
item. Table 3 gives further information on the short FAST scores of participants who
presented with aphasia.
Although psychological distress did significantly reduce from baseline to six months, (Wilks’
Lambda = .86, F (2, 69) = 5.71, p <.01) distress levels remained high throughout. Hilari et al.
(2010), reporting on the same sample, noted that 45% could still be classified as experiencing
high distress at six months. Finally, as anticipated, extended ADL was significantly worse
post stroke compared to pre-morbid levels, Wilks’ Lambda = .46, F (2, 68) = 39.63, p < .001.
**Tables 2 and 3 about here **
What happens to social networks following a stroke?
Table 4 provides descriptive statistics for the Stroke Social Network Scale (SSNS), including
its five subdomains. Having a stroke caused participants’ scores on the SSNS to decline:
Wilks’ Lambda = .82, F(2, 68) = 7.35, p =.001, ηp2 = .18. Post hoc comparisons showed that
baseline social network scores were significantly higher than at six months (p = .001). Other
differences were not significant.
In terms of the subdomains, only the Friends subdomain showed significant change, Wilks’
Lambda = .80, F (2, 68) = 8.49, p = .001, ηp2 = .20. Post hoc tests showed that there was a
significant difference between baseline and six months (p <.001). At baseline 10% of
participants reported having no close friends; by six months this figure had risen to 20%.
Post stroke people became less satisfied with their social network. Although this trend did not
14
expressing very low satisfaction at three and six months post stroke. Participants who
experienced the steepest declines in the Satisfaction subdomain also reported losses in other
subdomains; where Satisfaction scores had decreased by over 20 points, participants also
reported losses in the Friends, Groups and Relatives subdomains (except where they scored 0
on these subdomains prior to the stroke).
Group involvement also decreased, although again this trend did not reach statistical
significance. The Children factor (e.g. measuring frequency of contact with children;
proximity of children) and the Relatives factor (e.g. measuring number of close relatives;
frequency of contact), by contrast, were stable elements of the network. Thus 70% of
participants saw their children at least once a week both before and after the stroke.
*** Table 4 about here***
What are the concurrent predictors of social network six months post stroke?
Univariate analyses
The following variables, as measured at six months post stroke, were significantly associated
with overall social network scores (SSNS) at six months in univariate analyses: perceived
social support (SSS) (r = .46, p < 0.001); activities of daily living (BI) (r = 0.36, p = 0.01);
extended activities of daily living (FAI) (r = 0.33, p = 0.01); aphasia (short FAST) (r = .37, p
= 0.01). In addition, there was a significant association between gender and social networks,
with women having higher social network scores on the SSNS than men (t(68.09) = 2.30, p =
0.05). Finally, there was a significant difference in the social network scores on the SSNS of
participants from different ethnic backgrounds: F(3,67) = 3.19, p = .05. Post hoc comparisons
using the Tukey HSD test indicated that the mean score for black participants (mean = 71.83;
SD = 10.37) was significantly higher than for Asian participants (mean = 47.46; SD = 18.31).
15
the Caribbean. The ethnic background variable was entered into the multiple regression
equation as a dichotomous dummy variable: Black, non-Black. These two groups were
significantly different: t(69) = -2.33, p = 0.05. Other potential IVs listed in Table 2, and
demographic variables listed in Table 1, were not significantly associated with SSNS at six
months, and were therefore not considered for entry into the equation.
Multiple regression assumptions
Extended ADL (FAI) and ADL (BI) were strongly correlated with one another (r = 0.66),
violating the multicollinearity assumption. Since both variables were moderately correlated
with social network (SSNS), a decision was made to discard the BI, as it had a highly skewed
distribution at six months, and retain the FAI. Still, this meant there were too many IVs given
the number of participants. The equation was therefore initially run with all five IVs, and
those IVs which were not statistically significant were removed. In practice, this meant that
gender was not included in the final equation.
Multivariate analyses
Table 5 is a summary of the regression model.
***Table 5 about here***
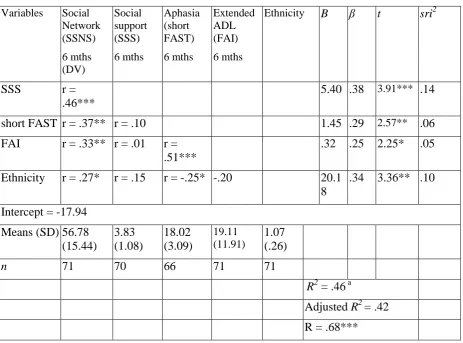
R for regression was significantly different from zero, with F(4, 64) = 12.39, p < .001. The overall model accounted for 46% of the variance in the social network scores. Adjusted R2 = .42, suggesting that 42% of the variance in social network six months post stroke can be
explained by a person’s perceived social support (accounting for 14% unique variance),
ethnicity (10% unique variance), aphasia (6% unique variance) and extended ADL (5%
unique variance). The four IVs in combination contributed another 11% of shared variability.
16
the relationships suggested that the people with the strongest social networks were those who:
felt better supported; had fewer language difficulties; were black; and performed more
extended ADL.
What are the baseline predictors of social network six months post stroke?
Univariate analyses
The baseline aphasia measure (short FAST) was significantly associated with social network
(SSNS) at six months (r = .37, p = 0.01), as was baseline perceived social support (SSS) (r =
.36, p = 0.01), and baseline social network (r = .75, p < 0.001). As in the previous regression
equation, baseline gender and ethnicity were also significantly associated with SSNS. No
other IV as measured at baseline was significantly associated with SSNS six months later; nor
were any other demographic factors.
Multiple regression assumptions
There were five IVs that were significantly associated with social network, which exceeded
the stated ratio of cases to IV. The equation was therefore run, and IVs which were not
statistically significant were removed, and the equation re-run without them. In practice, this
meant that the IVs included in the final equation were: baseline social network, and baseline
aphasia.
Multivariate analyses
Table 6 is a summary of the regression model.
***Table 6 about here***
17
.60, suggesting that 60% of the variance in social network six months post stroke can be
explained by a person’s social network prior to the stroke, and the severity of aphasia at
baseline. The B coefficients showed that both IVs were significant predictors. Baseline social network accounted for 48% unique variance, aphasia accounted for 5%. The two IVs in
combination contributed another 8% of shared variability. The direction of the relationships
suggests that the people with the strongest social networks were those who had strong social
networks prior to the stroke and had fewer language difficulties just after the stroke.
Discussion
This study explored what happens to a person’s social network in the months following a
stroke, and what factors predict who is able to maintain a strong social network at six months
post onset. We recruited 87 stroke survivors from two acute stroke units, and interviewed
them at two weeks (baseline), three months and six months post stroke. Overall social
network scores significantly reduced over the six month period. In terms of concurrent
predictors, the stroke survivors who had the strongest social networks at six months were
those who: perceived themselves to be well supported; were black; had fewer activity
limitations; and did not have aphasia. Only two baseline factors were significant predictors of
social networks six months later: a person’s social network prior to the stroke, and aphasia as
measured at the time of the stroke. A strength of the study was the inclusion of people with
aphasia, who were enabled to self-report on all measures used.
A main finding of the study was that overall social network scores significantly reduced over
the six month period from baseline levels. Social network functioning was measured using a
new scale: the Stroke Social Network Scale (SSNS), validated on both those with and without
18
network reduces (Vickers, 2010), or is less than controls (Cruice et al., 2006b), this is the first
study to follow participants prospectively over six months post onset and report on a complex
measure of social network rather than a single indicator such as size of network.
In terms of the subdomain scores, only one subdomain showed significant change: the
Friends subdomain (including constructs such as number of close friends, frequency of
contact, proximity). This confirms the finding of other studies, both quantitative (Astrom,
Adolfsson, Asplund, & Astrom, 1992; Hilari & Northcott, 2006) and qualitative (Brown,
Davidson, Worrall, & Howe, 2013; Parr, Byng, & Gilpin, 1997), that contact with friends is
vulnerable post stroke. By contrast, the two family subdomains (Children; Relatives)
appeared to be stable. This again matches the trends found in the literature (Astrom et al.,
1992; Belanger, Bolduc, & Noel, 1988). Although it might be anticipated that the number of
children/ close relatives would be unlikely to change, the items on proximity and contact
(both face to face and remote) were also stable. Nonetheless, these figures do not shed light
on possible changes within the parent-child relationship. For example, the qualitative
literature suggests that while children may be robust network members, nonetheless there can
be potentially distressing shifts in parent-child roles (Dowswell et al., 2000; Parr et al., 1997).
While participants had lower scores on the Group subdomain at six months, this trend did not
reach significance. This may reflect that even prior to the stroke group membership was low
in this sample, with roughly 50% of participants not belonging to any group; by six months
this had increased only slightly to 52%. Further, these figures give no insight into whether the
‘type’ of group had changed: ie whether recreational/leisure activities had been replaced by
therapy groups or day centre attendance, as described by Davidson, Howe, Worrall, Hickson,
19
Finally, although the Satisfaction domain did not show statistically significant change overall,
for some participants there was a steep decline. As reported elsewhere (Northcott & Hilari,
2013), the Satisfaction domain was significantly correlated with the Children (r = 0.42),
Relatives (r = 0.29), and Friends domains (r = 0.30), and those whose Satisfaction scores
declined the most also declined in other domains.
Turning to predictors of social network functioning, four variables were found to be
significant concurrent predictors of social network at six months post stroke. These were:
perceived social support, aphasia, extended ADL, and ethnic background.
Perceived social support was found to be the strongest predictor: those who felt
well-supported had stronger social networks. This confirms the close relationship between these
two constructs, both measuring different aspects of social relationships. In fact, the
correlation between perceived and structural support is normally between .2 and .3 (Cohen &
Wills, 1985). In this project, the correlation was higher (r = .46 at six months). This may be
due to the Satisfaction subdomain, a construct not always included in social network scales. It
is likely that one factor that makes a social network satisfying is perceiving oneself to be
supported.
Another significant predictor was aphasia. This is the first paper to explore whether aphasia is
a significant predictor of social network in a general stroke population. Code (2003) also
analysed predictors of an aspect of social activities post stroke (hours spent out of the house).
In common with the present study, they also found that severity of aphasia was a significant
predictor. Other studies looking at predictors of related concepts post stroke, for example,
social dysfunction (Hommel et al., 2009) or participation (Desrosiers et al., 2006), may have
20
Since the present study excluded those with severe receptive aphasia, the impact of aphasia
on social networks may be even stronger than we report.
Extended ADL was also found to be a significant predictor. Thus those more able to perform
extended ADL had stronger social networks. Other studies have also found that ADL/ level
of disability post stroke are associated with aspects of the social network (Labi, Phillips, &
Greshman, 1980; Osberg et al., 1988), as well as participation (Desrosiers et al., 2006). One
potential reason is that high scores in ADL may be associated with high levels of mobility,
helping to sustain social networks. Conversely, those with strong social networks may be
more motivated to engage in out-of-house ADL.
Finally, those who were of African or Caribbean background had stronger social networks.
The finding that ethnicity is a significant predictor is based on a small sample of black
participants, so this result should be interpreted cautiously. Ethnicity has not been found to be
a predictive factor in recent reviews of quality of life after stroke and aphasia (Hilari, Needle,
& Harrison, 2012), or depression after stroke (Hackett & Anderson, 2005). In terms of social
networks, there are inconclusive findings in the stroke literature. Boden-Albala et al. (2005)
found African Americans to be more isolated than whites or Hispanics at the time of the
stroke, which they suggested may in part reflect the greater poverty of the African American
population in the study area. Conversely Haun, Rittman, and Sberna (2008) did not find
ethnicity to be a factor when exploring social isolation post stroke. Certainly, how a social
network functions is very likely to be culturally specific; and the interaction between social
network and ethnicity may be influenced by larger societal issues, such as poverty and social
exclusion. Thus findings from more disaffected or excluded minorities, for example,
Boden-Albala et al. (2005), may not translate to the present study. Pawson, Rahgavan, and Small
(2005) make the further point that the social network of a person of ethnic minority will
21
The present project took place in West London, home to the Notting Hill Carnival, the largest
street festival in Europe celebrating the traditions and the culture of the Caribbean
community. As such, it could be said to be an area where Caribbean people have a strong and
proud identity.
This study also analysed baseline predictors of social network at six months post stroke.
Pre-morbid social network was the strongest predictor. This supports the notion that social
networks represent ‘life-long adaptations’ (Wenger, 1994), and as such many elements
remain stable even after a stroke, for example, the family domains. There was only one other
baseline factor that was a significant predictor: aphasia. This finding underlines the aphasia
research which has documented the difficulties people with aphasia can face in maintaining
social relationships (Cruice et al., 2006b; Davidson et al., 2008; Parr, 2007). In the
companion qualitative study to the present project, a main finding was that while friendship
loss was multi-factorial, those with aphasia were the sub-group most likely to feel rejected by
friends, to experience stigmatising responses, and to report changes to the substance of
retained friendships (Northcott & Hilari, 2011).
Strengths and limitations
A strength of the current project was the longitudinal design, which included measurement of
pre-morbid social network patterns. Another strength was the inclusion of people with
aphasia: those with any severity of expressive aphasia and mild to moderate receptive aphasia
were able to self-report on all the measures used. Nonetheless, given the relatively small
sample of people with aphasia (by six months, 16% of the sample, n = 11), and the fact that those with severe receptive aphasia were excluded at baseline (n = 9), it is possible that this project underestimates the impact of aphasia as a predictor of social networks. A further
consideration is that the short FAST is a brief screening measure, so does not capture more
22
discourse measure this may have been more sensitive in detecting the impact of aphasia on
social relationships.
In terms of interpreting results, an additional complicating factor is that the outcome
measures used different timescales, thus GHQ-12 requested participants consider ‘present
and recent complaints’, the SSNS and SSS questions relate to the past month, and FAI the
past three to six months. Another limitation is that some factors which could impact on social
network were not assessed. Hommel et al. (2009), for example, found that cognition,
particularly working memory, was a significant predictor of a related concept, social
dysfunction, post stroke. It may also be that cognitive communication disorders, as well as
concepts such as self-esteem, self-efficacy and personality traits, affect social network
functioning but were not assessed. Still, given that this population was often fatigued, we
aimed to keep respondent burden to a minimum in selecting measures.
A further limitation relates to the sample. Specifically, those presenting with a second stroke,
living in a nursing home prior to the stroke, and with a history of mental health problems or
cognitive decline were excluded. Yet these stroke survivors may be likely to have restricted
social networks: certainly, having weak social ties is a strong predictor of admittance to a
nursing home (Meijer et al., 2004). Thus it is possible that had they been included in the
study, the social networks described would have been weaker. Finally, a longer term follow
up would have strengthened the study.
Clinical implications and future directions
A clinically important question is what factors measured in the acute stage predict weak
social networks six months later. The only stroke-related factor that was a significant
predictor was aphasia. It may therefore be beneficial to monitor whether those with aphasia
23
stroke. Further, in terms of rehabilitation, there is arguably a particularly strong case for
aphasia clinicians to consider the social context of their clients. As observed by Parr et al.
(1997) ‘language is the currency of relationships’ (p44), and social relationships provide the
context in which communication takes place. Research exploring the ‘lived experience’ of
aphasia has found that people with aphasia identify that maintaining meaningful relationships
is a core component of ‘living successfully’ with aphasia (Brown et al., 2013; Cruice,
Worrall, & Hickson, 2006a; Hinckley, 2006). Furthermore, social goals, such as being able to
converse with family and friends, have been identified as a priority for therapy by those with
aphasia (Worrall et al., 2011). Best practice aphasia guidelines increasingly stress the need to
take a holistic approach to rehabilitation, thus the WHO-ICF framework has been adopted by
the American Speech-Language-Hearing Association (ASHA), while the UK Royal College
of Speech and Language Therapists state that the aim of aphasia rehabilitation is to ‘enable
participation in an individual’s social context and in the community and society more
generally’ (p98) (Royal College of Speech and Language Therapists, 2005).
In terms of which elements of the social network are most vulnerable, our findings suggest
that the Friends subdomain declined the most. It may therefore be useful to consider
supporting and bolstering friendship circles, for example, through peer-support schemes or
aphasia/stroke groups (Brown et al., 2013), adopting a more social approach to therapy
(Pound et al., 2000), or exploring therapy approaches such as solution focused brief therapy
which may increase confidence to engage socially (Northcott, Burns, Simpson, & Hilari, in
press).Conversation partner programmes aimed primarily at spouses (Beeke et al., 2015)
could potentially be adapted for supporting close friendships. Still, few research projects have
specifically targeted friendship loss in an intervention study for this population. Future
24
following participants over a longer time frame in order to explore whether social network
patterns stabilise, improve or continue to deteriorate.
Conclusion
Social networks become weaker in the first six months post stroke compared to pre-morbid
levels, as assessed using a complex measure of social network incorporating size of network,
frequency of contact, proximity and satisfaction. At six months, the stroke survivors with the
strongest social networks were those who reported high levels of perceived functional
support, were black, did not have aphasia, and had the least restrictions in terms of their
extended activities of daily living. There were only two baseline predictors of social network
at six months: a person’s pre-morbid social network, and aphasia severity measured at the
time of the stroke. Other factors, such as stroke severity, level of disability and psychological
distress were not significant predictors. Thus it appears that aphasia, more than any other
stroke related factor, can challenge a person’s ability to maintain a strong social network in
25
Table 1: Participant Characteristics
Variable Respondent n (%)
Baseline 3 months 6 months
n = 87 n = 76 n = 71
Gender
Female 35(40.2) 32 (42.1) 31 (43.7)
Male 52 (59.8) 44 (57.9) 40 (56.3)
Age
Mean (SD) 69.7 (14.1) 69.7 (14.0) 69.3 (14.1)
Range 18 – 91 18 – 91 18 – 91
Ethnic group
Asian 10 (11.5) 9 (11.8) 9 (12.7)
Black 6 (6.9) 5 (6.6) 5 (7.0)
White British 65 (74.7) 57 (75) 52 (73.2)
White non-British 6 (6.9) 5 (6.6) 5 (7.0)
Marital status
Married/ has partner 45 (51.7) 40 (52.6) 38 (53.5)
Single, divorced or widowed 42 (48.3) 36 (47.4) 33 (46.5)
Living arrangements
Living alone/ in hospital or institution 37 (42.5) 39 (51.3) 32 (45.1)
Living at home with someone 50 (57.5) 37 (48.7) 39 (54.9)
Co-morbid conditions
None 10 (11) 8 (11) 8 (11.3)
One 14 (16) 13 (17) 12 (16.9)
Two 21 (24) 19 (25) 18 (25.4)
Three 18 (21) 17 (22) 16 (22.5)
26
Table 2: Descriptive statistics for stroke related and other variables
Variable Baseline
n = 87
3 months
n = 76
6 months
n = 71
Stroke type
Ischaemic 75 (86.2%) 67 (88.2%) 62 (87.3%)
Haemorrhagic 12 (13.8%) 9 (11.8%) 9 (12.7%)
Stroke classification
Lacunar (LAC) 24 (27.5%) 21 (27.5%) 20 (28%)
Posterior circulation (POC) 24 (27.5%) 22 (29%) 20 (28%)
Total anterior circulation (TAC) 13 (15%) 9 (12%) 9 (13%)
Partial anterior circulation (PAC) 26 (30%) 24 (31.5%) 22 (31%)
Lateralization of stroke
Right hemisphere 40 (46.0%) 33 (43.4%) 31 (43.7%)
Left hemisphere 35 (40.2%) 33 (43.4%) 30 (42.2%)
Other (non-lateralizing cerebral
damage; unknown lateralization) 12 (13.8%) 10 (13.2%) 10 (14.1%)
Stroke severity (NIHSS)
Mean (SD) 5.91 (4.40) 2.04 (2.72) 1.52 (2.12)
Median (IQR)ˠ 4 (3.0 – 8.0) 1 (0 – 3.0) 1 (0 – 2.0)
Range 0 – 21 0 – 12 0 – 10
n* n = 85 n = 74 n = 67
Activities of Daily Living (BI)
Mean (SD) 65.89 (31.64) 89.60 (18.05) 91.23 (15.52)
Median (IQR) ˠ 70.00 (41.25–100) 100 (90–100) 100 (90–100)
Range 5 – 100 25 – 100 35 – 100
n n = 84 n = 75 n = 69
Extended ADL (FAI)*
Mean (SD) 27.94 (8.22) 17.87 (11.79) 19.11 (11.91)
Range 1 – 42 0 – 38 0 – 39
n n = 86
Psychological Distress (GHQ-12)
Mean (SD) 4.95 (3.62) 4.20 (3.76) 3.48 (3.62)
Perceived social support (SSS)**
Mean (SD) 3.82 (0.96) 4.00 (0.92) 3.83 (1.08)
Range 1.42 – 5.00 1.47 – 5.00 1.16 – 5.00
n n = 86 n = 73 n = 70
Aphasia (Short FAST)
Mean (SD) 16.51 (3.60) 17.90 (2.90) 18.02 (3.10)
Median (IQR) ˠ 18.00 (25 – 29) 19.00 (27–30) 19.00 (27–30)
Range 5 – 20 8 – 20 7 – 20
n n = 83 n = 69 n = 66
Communication Status Aphasia
Non-aphasic 55(63%) 62 (82%) 60 (84%)
Aphasic 32 (37%) 14 (18%) 11 (16%)
Dysarthria
27
Mild-moderate dysarthria 33 (38%) 8 (11%) 2 (3%)
Severe dysarthria 9 (10%) 0 0
*n given only when there is missing data
**Baseline FAI scores refer to three months prior to the stroke; and baseline SSS scores refer to one month prior to stroke
ˠ Median (IQR) provided where distribution is skewed (skewness greater than ±1)
Participants were assessed to be ‘aphasic’ based on the cut off points recommended by the
28
Table 3. Language profiles of participants identified as having aphasia at baseline Short FAST
subscales
Mean (SD) Range severe
(0-3 out of 10) n (%)
moderate (4-7 out of 10)
n (%)
mild (8-10 out of 10)
n (%)
Verbal expression (n = 30)*
6.33 (2.59) 0 – 10 4 (13.3%) 15 (50.0%) 11 (36.7%)
Auditory comprehension (n = 30)*
6.47 (1.83) 2 - 10 1 (3.3%) 18 (60.0%) 11 (36.7%)
*number of people with aphasia = 32; missing data on the short FAST for two participants at baseline, who were identified as having aphasia via their NIHSS scores
29
Table 4. Stroke Social Network Scale: descriptive statistics Stroke Social Network Scale (scale range of scores = 0-100)
Overall scale Baseline 3 months 6 months
Social Network
Mean (SD) 60.69 (15.22) 58.04 (16.74) 56.78 (15.44)
Range 11.32 – 91.70 6.84 – 92.81 10.26 – 85.15
n n = 87 n = 75 n = 71
Subdomains
Satisfaction
Mean (SD) 85.17 (15.61) 84.60 (19.49) 82.56 (19.23)
Median (IQR) 88.33 (78.33 –
96.67)
88.33 (80.83– 96.67)
86.67 (80.0– 93.33)
Range 35.83 – 100 3.33 – 100 6.67 – 100
Children
Mean (SD) 57.60 (35.52) 57.67 (35.74) 58.78 (34.21)
Range 0 – 100 0 – 100 0 – 100
Relatives
Mean 37.76 (28.55) 39.07 (28.40) 36.78 (29.17)
Range 0 – 88.89 0 – 100 0 – 93.33
Friends
Mean (SD) 56.98 (24.95) 48.77 (25.55) 43.96 (28.08)
Range 0 – 95 0 – 100 0 – 95
Groups
Mean (SD) 35.06 (37.10) 27.78 (31.99) 30.98 (34.19)
30
Table 5. Concurrent predictors of social network six months post stroke
Variables Social Network (SSNS) 6 mths (DV) Social support (SSS) 6 mths Aphasia (short FAST) 6 mths Extended ADL (FAI) 6 mths
Ethnicity B β t sri2
SSS r =
.46***
5.40 .38 3.91*** .14
short FAST r = .37** r = .10 1.45 .29 2.57** .06
FAI r = .33** r = .01 r =
.51***
.32 .25 2.25* .05
Ethnicity r = .27* r = .15 r = -.25* -.20 20.1
8
.34 3.36** .10
Intercept = -17.94 Means (SD) 56.78
(15.44) 3.83 (1.08) 18.02 (3.09) 19.11 (11.91) 1.07 (.26)
n 71 70 66 71 71
R2 = .46 a
31
Table 6. Baseline predictors of social network six months post stroke
Variables Social
Network (SSNS) 6 mths (DV)
Social network (SSNS) Baseline
Aphasia (short FAST) Baseline
B β t sri2
Social network (2 wks)
r = .75***
.70 .71 8.96*** .48
Aphasia (short FAST) (2 wks)
r = .37** r = .21* .89 .22 2.80** .05
Intercept: -1.24
Means 56.78 61.81 16.49
Standard Deviations
15.44 15.57 3.81
n 71 71 68
R2 = .61 a
Adjusted R2= .60
32
Acknowledgements
This study was supported by a grant from the Consortium for Healthcare Research of the
Health Foundation. We would like to thank Alice Lamb for her help in collecting data, and
the stroke unit teams of St Mary’s Hospital and Royal Free Hospital. Finally, we are grateful
33
Ali, M., Lyden, P., & Brady, M. (2015). Aphasia and dysarthria in acute stroke: recovery and
functional outcome. International Journal of Stroke, 10, 400-406. doi: 10.1111/ijs.12067
Astrom, M., Adolfsson, R., & Asplund, K. (1993). Major depression in stroke patients. A
3-year longitudinal study. Stroke, 24(7), 976-982.
Astrom, M., Adolfsson, R., Asplund, K., & Astrom, T. (1992). Life before and after stroke.
Living conditions and life satisfaction in relation to a general elderly population. Cerebrovasc Dis, 2, 28-34.
Bamford, J., Sandercock, P., Dennis, M., Burn, J., & Warlow, C. (1991). Classification and
natural history of clinically identifiable subtypes of cerebral infarction. Lancet, 337(8756), 1521-1526.
Beeke, S., Beckley, F., Johnson, F., Heilemann, C., Edwards, S., Maxim, J., & Best, W.
(2015). Conversation focused aphasia therapy: investigating the adoption of strategies by
people with agrammatism. Aphasiology, 29(3), 355-377. doi:10.1080/02687038.2014.881459
Belanger, L., Bolduc, M., & Noel, M. (1988). Relative importance of after-effects,
environment and socio-economic factors on the social integration of stroke victims. Int J Rehabil Res, 11(3), 251-260.
Berkman, L. F., Glass, T., Brissette, I., & Seeman, T. E. (2000). From social integration to
health: Durkheim in the new millennium. Soc Sci Med, 51(6), 843-857.
Berkman, L. F., & Syme, S. L. (1979). Social networks, host resistance, and mortality: a
34
Berzon, R., Hays, R. D., & Shumaker, S. A. (1993). International use, application and
performance of health-related quality of life instruments. Qual Life Res, 2(6), 367-368.
Boden-Albala, B., Litwak, E., Elkind, M. S., Rundek, T., & Sacco, R. L. (2005). Social
isolation and outcomes post stroke. Neurology, 64(11), 1888-1892. doi: 10.1212/01.WNL.0000163510.79351.AF
Bowling, A. (1997). Measuring health. A review of quality of life measurement scales.
Buckingham UK: Open University Press.
Brott, T., Adams, H. P., Jr., Olinger, C. P., Marler, J. R., Barsan, W. G., Biller, J., . . . et al.
(1989). Measurements of acute cerebral infarction: a clinical examination scale. Stroke, 20(7), 864-870.
Brown, K., Davidson, B., Worrall, L. E., & Howe, T. (2013). "Making a good time": the role
of friendship in living successfully with aphasia. Int J Speech Lang Pathol, 15(2), 165-175. doi: 10.3109/17549507.2012.692814
Code, C. (2003). The quantity of life for people with chronic aphasia. Neuropsychol Rehabil, 13(3), 379-390. doi: 10.1080/09602010244000255
Cohen, S., & Wills, T. A. (1985). Stress, social support, and the buffering hypothesis.
Psychol Bull, 98(2), 310-357.
Cruice, M., Worrall, L., & Hickson, L. (2006a). Perspectives of quality of life by people with
35
Cruice, M., Worrall, L., & Hickson, L. (2006b). Quantifying aphasic people's social lives in
the context of non-aphasic peers. Aphasiology, 17(4), 333-353. doi: 10.1080/02687030600790136
Davidson, B., Howe, T., Worrall, L., Hickson, L., & Togher, L. (2008). Social participation
for older people with aphasia: the impact of communication disability on friendships. Top Stroke Rehabil, 15(4), 325-340. doi: 10.1310/tsr1504-325
Department of Health. (2007). National Stroke Strategy. Accessed in,
http://www.dh.gov.uk/en/Publicationsandstatistics/Publications/PublicationsPolicyAndGuidance/D
H_081062.
Desrosiers, J., Noreau, L., Rochette, A., Bourbonnais, D., Bravo, G., & Bourget, A. (2006).
Predictors of long-term participation after stroke. Disabil Rehabil, 28(4), 221-230. doi: 10.1080/09638280500158372
Dowswell, G., Lawler, J., Dowswell, T., Young, J., Forster, A., & Hearn, J. (2000).
Investigating recovery from stroke: a qualitative study. J Clin Nurs, 9(4), 507-515.
Enderby, P. M., Wood, V. A., Wade, D. T., & Hewer, R. L. (1987). The Frenchay Aphasia
Screening Test: a short, simple test for aphasia appropriate for non-specialists. Int Rehabil Med, 8(4), 166-170.
Field, A. (2013). Discovering statistics using IBM SPSS Statistics (4th ed.). London: Sage.
Fotiadou, D., Northcott, S., Chatzidaki, A., & Hilari, K. (2014). Aphasia blog talk: How does
36
Goldberg, D. (1972). The Detection of Psychiatric Illness by Questionnaire. London, UK: Oxford University Press.
Hackett, M. L., & Anderson, C. S. (2005). Predictors of depression after stroke: a systematic
review of observational studies. Stroke, 36(10), 2296-2301. doi: 10.1161/01.STR.0000183622.75135.a4
Haun, J., Rittman, M. R., & Sberna, M. (2008). The continnum of connectedness and social
isolation during post stroke recovery. Journal of Aging Studies, 22, 54-64. doi: 10.1016/j.jaging.2007.03.001
Hilari, K., Lamping, D. L., Smith, S. C., Northcott, S., Lamb, A., & Marshall, J. (2009).
Psychometric properties of the Stroke and Aphasia Quality of Life Scale (SAQOL-39) in a
generic stroke population. Clin Rehabil, 23(6), 544-557. doi: 10.1177/0269215508101729
Hilari, K., Needle, J. J., & Harrison, K. L. (2012). What are the important factors in
health-related quality of life for people with aphasia? A systematic review. Arch Phys Med Rehabil, 93(1 Suppl), S86-95. doi: 10.1016/j.apmr.2011.05.028
Hilari, K., & Northcott, S. (2006). Social support in people with chronic aphasia.
Aphasiology, 20, 17-36. doi: 10.1080/02687030500279982
Hilari, K., Northcott, S., Roy, P., Marshall, J., Wiggins, R. D., Chataway, J., & Ames, D.
(2010). Psychological distress after stroke and aphasia: the first six months. Clin Rehabil, 24(2), 181-190. doi: 10.1177/0269215509346090
Hilari, K., Owen, S., & Farrelly, S. J. (2007). Proxy and self-report agreement on the Stroke
37
Hilari, K., Wiggins, R. D., Roy, P., Byng, S., & Smith, S. C. (2003). Predictors of
health-related quality of life (HRQL) in people with chronic aphasia. Aphasiology, 17(4), 365-381. doi: 10.1080/02687030244000725
Hinckley, J. J. (2006). Finding messages in bottles: living successfully with stroke and
aphasia. Top Stroke Rehabil, 13(1), 25-36. doi: 10.1310/FLJ3-04DQ-MG8W-89EU
Holt-Lunstad, J., & Smith, T. (2012). Social relationships and mortality. Social and personality psychology, 6(1), 41-53. doi: 10.1111/j.1751-9004.2011.00406.x
Hommel, M., Trabucco-Miguel, S., Joray, S., Naegele, B., Gonnet, N., & Jaillard, A. (2009).
Social dysfunctioning after mild to moderate first-ever stroke at vocational age. J Neurol Neurosurg Psychiatry, 80(4), 371-375. doi: 10.1136/jnnp.2008.157875
Labi, M. L., Phillips, T. F., & Greshman, G. E. (1980). Psychosocial disability in physically
restored long-term stroke survivors. Arch Phys Med Rehabil, 61(12), 561-565.
Mahoney, F. I., Wood, O. H., & Barthel, D. W. (1958). Rehabilitation of chronically ill
patients: the influence of complications on the final goal. South Med J, 51(5), 605-609.
Meijer, R., van Limbeek, J., Kriek, B., Ihnenfeldt, D., Vermeulen, M., & de Haan, R. (2004).
Prognostic social factors in the subacute phase after a stroke for the discharge destination
from the hospital stroke-unit. A systematic review of the literature. Disabil Rehabil, 26(4), 191-197.
Northcott, S., Burns, K., Simpson, A., & Hilari, K. (in press). 'Living with aphasia the best
way I can': an evaluation of a feasibility study exploring solution focused brief therapy for
38
Northcott, S., & Hilari, K. (2011). Why do people lose their friends after a stroke? Int J Lang Commun Disord, 46(5), 524-534. doi: 10.1111/j.1460-6984.2011.00079.x
Northcott, S., & Hilari, K. (2013). Stroke Social Network Scale: development and
psychometric evaluation of a new patient-reported measure. Clin Rehabil, 27(9), 823-833. doi: 10.1177/0269215513479388
Northcott, S., Moss, B., Harrison, K., & Hilari, K. (2015). A systematic review of the impact
of stroke on social support and social networks: Associated factors and patterns of change.
Clin Rehabil. doi: 10.1177/0269215515602136
Osberg, J. S., DeJong, G., Haley, S. M., Seward, M. L., McGinnis, G. E., & Germaine, J.
(1988). Predicting long-term outcome among post-rehabilitation stroke patients. Am J Phys Med Rehabil, 67(3), 94-103.
Parr, S. (2007). Living with severe aphasia: tracking social exclusion. Aphasiology, 21(1), 98-123. doi: 10.1080/02687030600798337
Parr, S., Byng, S., & Gilpin, S. (1997). Talking about aphasia. Buckingham UK: Open University Press.
Pawson, N., Rahgavan, R., & Small, N. (2005). Social inclusion, social networks and
ethnicity: the development of the Social Inclusion Interview Schedule for young people with
learning disabilities. British Journal of Learning Disabilities, 33, 15-22. doi: 10.1111/j.1468-3156.2004.00270.x
39
Rose, T. A., Worrall, L. E., Hickson, L. M., & Hoffmann, T. C. (2011). Aphasia friendly
written health information: content and design characteristics. Int J Speech Lang Pathol, 13(4), 335-347. doi: 10.3109/17549507.2011.560396
Royal College of Speech and Language Therapists. (2005). Clinical Guidelines. Oxon: Speechmark Publishing.
Sherbourne, C. D., & Stewart, A. L. (1991). The MOS social support survey. Soc Sci Med, 32(6), 705-714.
Simmons-Mackie, N., Kagan, A., Victor, J. C., Carling-Rowland, A., Mok, A., Hoch, J. S., . .
. Streiner, D. L. (2014). The assessment for living with aphasia: reliability and construct
validity. Int J Speech Lang Pathol, 16(1), 82-94. doi: 10.3109/17549507.2013.831484
Stevens, J. (1992). Applied multivariate statistics for the social sciences (2nd ed.). Hillsdale, New Jersey: Erlbaum.
Vickers, C. (2010). Social networks after the onset of aphasia: the impact of aphasia group
attendance. Aphasiology, 24(6-8), 902-913. doi: 10.1080/02687030903438532
Wade, D. T., Legh-Smith, J., & Langton Hewer, R. (1985). Social activities after stroke:
measurement and natural history using the Frenchay Activities Index. Int Rehabil Med, 7(4), 176-181.
Wenger, G. C. (1994). Support networks of older people: A guide for practitioners. Bangor: Centre for Social Policy Research and Development, University of Wales.
World Health Organisation. (2001). International classification for functioning, disability and
health (ICF). Geneva, Switzerland: World Health Organisation.
40
Worrall, L., Sherratt, S., Rogers, P., Howe, T., Hersh, D., Ferguson, A., & Davidson, B.