WIRELESS NETWORKS IN VEHICLES
J F Dawson*, D C Hope*, M Panitz
t,C Christopoulos
t*Oept of Electronics, University of York, York, Y01 500,UK, e-mail:[email protected]
t
School of Electrical and Electronic Engineering, University of Nottingham, UKKeywords: Zigbee, Wireless Network, Vehicle.
2 In vehicle propagation environment
Abstract
-10 -20 -30 -40
~ -50
~
N -60
~
-70 -80 -90 -100
500 1000 1500 2000 2500 3000 3500 4000 4500 5000 5500 6000 Frequerry(MHz)
Figure 1: Coupling between two monopoles in a closed 96.5mm diameter conducting cylinder
Most aircraft and many other vehicles could be described as a collection of cavities, fabricated from conducing materials (metal, or carbon fibre composite) and coupled by apertures and wiring looms. The cavities are also populated with contents such as electronic, and mechanical systems, fuel, wiring, pipes and ducts. Some areas will also have windows, people, and furniture.
Propagation in conducting cavities is dependent on the cavity geometry and can vary rapidly with frequency. Figure 1 shows the coupling between two monopoles in a closed conducting cylinder. Two common features of cavity coupling can be seen. The coupling below 1850 MHz is very small due to the cut-off frequency of the first waveguide propagation mode. The cut-off frequency of a hollow waveguide corresponds to the frequency where the largest cross-sectional dimension is equal on half of the wavelength. Above 1850 MHz the coupling varies rapidly with frequency due to the resonances which are a consequence of reflections from the closed ends of the cylinder. The cut-off frequency corresponds to the frequency at which the largest dimension of the cross-section is half a wavelength. As the frequency increases, other higher order propagating modes become possible, and the number of resonant modes increases rapidly. The differing propagation velocities and dispersion in the individual waveguide modes coupled with the decay times of the resonances, which are dependent upon their Q-factors, produce a propagation channel with a large delay spread and the associated rapid variation in the amplitude of coupling with frequency. The behaviour of closed cavities has been Wireless networks in vehicles have the possibility to reduce
wiring costs and weight, and allow for more flexible installation of electronic systems. However the radio propagation environment inside vehicles such as aircraft presents unique challenges to the operation of wireless networks. An airframe or other vehicle body can be considered a set of coupled cavities. The cavities present a potentially high-Q reverberant behaviour which results in large delay spreads which can cause poor performance in digital radio systems. The presences of multiple, coupled cavities exacerbate the problem. Coupling between cavities is not controlled in vehicle designs and must be considered if radio connectivity is to be ensured. This paper will describe research being carried out at the Universities of York and Nottingham in measuring and modelling the performance of wireless networks in reverberant environments using the Zigbee system as an example.
Wiring in an aircraft contributes significant weight to the airframe, the associated connectors complicate maintenance and reduce reliability. A typical passenger aircraft (e.g. Boeing 747) contains over 220,000 metres of wire weighing 1600kg [1]. One of the main causes of the Airbus A380 production delays has been due to installation of the signalling cables [2]. Increased flexibility for initial and future modifications can be achieved by the use of wireless interconnectivity [3]. Protection is required to prevent damage to wiring harnesses from lighting strike and other electromagnetic interference. Wiring looms are also vulnerable to ageing and battle damage, whereas a wireless system may continue to function as long as the communicating units are not damaged. Whilst it is likely to be impossible to replace the entire wiring loom, the ability to connect to a number of sensors/actuators by wireless means may offer significant savings in weight, improved resilience to damage, and lightning strike.
analysed in detail in the literature relating to reverberation chambers and can be found in the work of Hill and colleagues from NIST [5].
Limited data is available on the propagation in real airframes. We are planning to perform some trial measurements on the HERTI VAV, as part of the ASTREA programme, and possibly other airframes in the near future. However we have used our reverberation chamber to test the performance of a Zigbee radio system and this is described in Section 4.
3 Radio systems for sensor and control
networks
Here we review briefly the various radio technologies of relevance to sensor and control networks in vehicles both in terms of the generic technology and the COTS systems available as most of the relevant radio systems are available in integrated form.
3.1 Modulation
In order to achieve realistic data rates in dispersive environments, and to improve robustness to interference, most modem digital radio systems use some form of spread-spectrum technology or transmit on multiple sub-carriers. The modulation scheme chosen has a direct bearing on other performance factors such as the power consumption and complexity of the radio system. Simple direct sequence spread spectrum systems such as that employed by the Zigbee standard [4] require only simple hardware and signal processing and therefore can operate at low power and easily be switched on and off on short time scales to further conserve power. More complex signal processing is required by schemes with multiple sub-carriers such as the orthogonal frequency division multiplexing (OFDM) used in current wireless LAN standards [6]. The higher complexity ofOFDM systems means higher power consumption and significant start-up and shut-down times so that network nodes cannot easily power down for short periods. If we wish a network to be truly wireless then low power systems are attractive as they can be operated under battery power or using small amounts of scavenged energy.
3.2 Network structures
Many network topologies are available. Wired networks tend to be constrained to bus and star, tree and ring-like topologies which are vulnerable to failure of connections. Radio networks can be used in mesh, or fully connected configurations which are potentially robust against the loss of individual links or nodes.Itwould therefore be advantageous to use a wireless standard that allows robust interconnectivity by multiple routes.
3.3 Power considerations
For wireless sensor networks low power operation is advantageous, though for control of actuators where a significant source of power is required for the actuator, this
may not be important.Itis possible that low powered wireless sensors could operate from energy scavenged from thermal gradients, vibration, or air-flow in the vicinity. A wide range of energy scavenging techniques are discussed in [9].
3.4 Safety and Security
Any wireless system used in control and sensor systems should be robust against interference and eavesdropping. A system capable of operating with some form of encryption is highly desirable. Most of the modem wireless systems incorporate some form of encryption, though some have been proven simple to break [10]. It is also important that any wireless system be safe and reliable enough for use in airborne systems.
3.5 COTS Radio systems
A wide range of COTS radio systems are available including Zigbee [4], Bluetooth [11], WiFi [6], and recently a number ofVWB [12] implementations. We chose to evaluate the performance of the Zigbee system because it is able to support low power operation, encryption, and can be configured in mesh, star or tree network configurations. The data rate of 250kbit/s is lower than most of the other systems but is adequate for many sensor and actuator control applications.
4 Performance of the Zigbee system in a
reverberant environment
A Zigbee system was tested in the reverberation chamber at York.
4.1 Measurement set up
A mode stirred or reverberation chamber is a resonant cavity operated in a frequency range where many resonant modes are excited, with a mechanical device for 'stirring' the field inside the chamber. Reverberation chambers have been found useful for communications measurements because they can replicate a Rayleigh or Ricean fading environment which changes as the stirred is moved [5].Itmay be used to emulate multi-path propagation effects as the many reflections over a short distance can cause a time delay such that there is phase shift that is high relative to the wavelength, just as a few reflections over a long distance can. The dimensions of the larger chamber used are 4.7x3.0x2.37m. There were no additional noise sources and the receiver noise figure is given by the manufacturers as approximately 10dB at room temperature. Where reference is given to the smaller chamber this has dimensions of 0.6xO.7xO.8m. In order to control the energy in the chamber and therefore the Q-factor and delay spread, AN79 absorber was added in varying amounts.
-40 -45
10000 1000
0.01 '--~~~~--"--'---~~~'--"---'--"---~~~~
100
4.3 Packet error rate measurements
100 Packet error rate 90
80 70
~ 60
O-factor
Figure 4: Delay spread as a function ofQ-factor compared with chamber(energy) time constant. The measured delay
spread is about one time constant as expected.
0.1
10,---~~~-~~~~-~~~~
Mean Excess delay +
RMS delay
En4~rgydelay Time constant from 0
with zeros up to 2.4GHz in 0.6MHz steps. A discrete Fourier transform was then applied to produce the channel impulse response.Given the need for delay spread to be within 1/5 of the symbol time this would suggest that a high error rate will occur up to the point where delay spread is less than 3 f.lS for the ZigBee system and therefore the Q-factor should be kept under 5000 in any environment in which it might be used. The delay spread in an office environment for which the COTS systems are designed is assumed to be less than 200ns. The large delay spread in the time domain implies a rapidly varying frequency response. Figures 2 and 3 show the frequency and time response of the large reverberation chamber. From the frequency response we determined a Q-factor of 36488. Figure 4 shows the measured delay spread as a function of chamber Q-factor (frequency response values are used) and shows that it correlates well with the chamber time constant derived from the Q-factor though it is about four times larger.
~
0.1g c::
.~ 0
en
'E(/)
c::
~-0.1
I--0.2 0.2
m
~-25c:
o
.~-30
'Een
; -35
t=
-10,---,---r---,---,---,---,---,---,---,
Empty Chamber 0=36488
-20 -15
-50'---'-_---'--_--'-_----'--_-L-_---'---_-'---_--L-~
2400 2410 2420 2430 2440 2450 2460 2470 2480 2490 Frequency (MHz)
Figure 2: Coupling between two monopoles in two ZigBee quarter wave antennas in the large reverberation chamber empty (no absorber)
An Agilent E5071B network analyser was used to measure the frequency response of a channel between the antenna terminals in the form of the S21 network parameter. The Zigbee standard specifies a number of channels over an 85MHz bandwidth. The channels themselves are spaced at 5MHz intervals and partially overlap. Measurements were taken over a bandwidth of 84MHz which covers the majority of the ZigBee channels, and was picked for numerical convenience when doing post processing. Measurements were taken with a 0.06MHz step size from 2.4GHz to 2.484GHz resulting in a total of 140 I data points.
0.3 ,---,---,---,---,---.--,----,---,---, Empty Chamber 0=36488
Theoretical delay profile
4.2 Obtaining the channel response
10 o,--+-~+---~,-,----,---,----,-,--_~~~~L--.~~~~---...-J
0.01 0.1
Mean Delay (us)
Figure 5: Measured Zigbee packet error rate as a function of mean delay spread.
ll:: 50
w
a.. 40
30 20 10 -0.3'---'--_--'--_---L-_--'---l_--'-_----"---_...L.--_
o 2 4 6 8 10 12 14 16 18 Time (us)
Figure 3: Coupling between two ZigBee quarter wave antennas in the large reverberation chamber, empty.
Due to limitations of the test API provided by the manufacturer of the Zigbee receivers it was not possible to obtain bit error rates for the system. Packet error rates were averaged over 10 different stirrer positions. There was a stirrer rotation of 3 degrees between each position. This was selected because there is low correlation between the coupling measured at different positions with this separation ensuring independent measurements. In the case of the small chamber the stirrer was moving continuously at a slow rate as a stepper motor was not available. It can be seen from Figure 5 that ZigBee generally functions reliably when the Q-factor is less than 5000 (delay <0.3J.1s) but it won't work
100 Packet error rate
-.-90
80
70
60
~ et: 50 w
a. 40
30
20
10
0
100 1000 10000 10000' Q-factor
Figure 6: Zigbee packet error rate as a function of Q-factor. Whilst Figure 5 shows packet error rates with the mode stirrer stationary against mean delay, Figure 6 shows the packet error rate against Q-factor. Unfortunately we have not yet been able to obtain data points for Q-factors in the 1-3000 range.
error rate can change rapidly with stirrer posItIon (static stirrer) and can change from 100% transmission to 100% loss with about 1mm movement at the periphery of the stirrer (0.05 degrees).
32,---,---,---,---,---,---,---,---,----r---,
30
28
~26
~ 24
e
22CD
~ 20
(.)
~ 18 + c+
16
14
12
'---"f'---'---'---~----'---'---~---'----~-.L---o 0.2 0.4 0.6 0.8 1 1.2 1.4 1.6 1.8 2 Stirrer speed (rpm)
Figure 8: Zigbee packet error rate as a function of stirrer speed at a Q-factor of 7000.
Performance
of Wifi
in
a
reverberant
environment
We have also been able to perform some preliminary tests of a simple point-to point (Ad-hoc) Wifi network in the reverberation chamber at York. The 802.11 b modulation scheme was used, it has a transmission rate of up 11 Mbit/s and has a complex encoding scheme with a chip-rate of up to 11 Mchip/s using some spreading of the data, however it is able to switch between several transmission rates and methods as the channel changes. Packet error rates and throughput where measured for UDP packet transmission.
100
-'#.
60~
w a..
120
80
40
12
ThroughputPacket error rate
10
CJ) ::t:::J 8
iii
:E
"S
6
a.
.r:.
C)
:::J 0
'-4
.r:.r-2
, I
20
'j
j'---'--_ _---L--_ _~ _'_____ ______'___ _----"'I' 0
100
200
300
400
500
Stirrer posisition (steps)
Figure 8: Wifi Packet error rate and throughput at an average Q-factor of 1451
100
fl++"
+f
80 -l
~
.s 60
~
e
CD Q) 40
~
I
(.)
co
a.
20
O~---L---L_'-+---'llI---+---'---L~-+----'---="---o 2 3 4 5 6 7
Stirrer position (degrees)
Figure 7: Zigbee packet error rate as a function of stirrer position at a Q-factor of 7000.
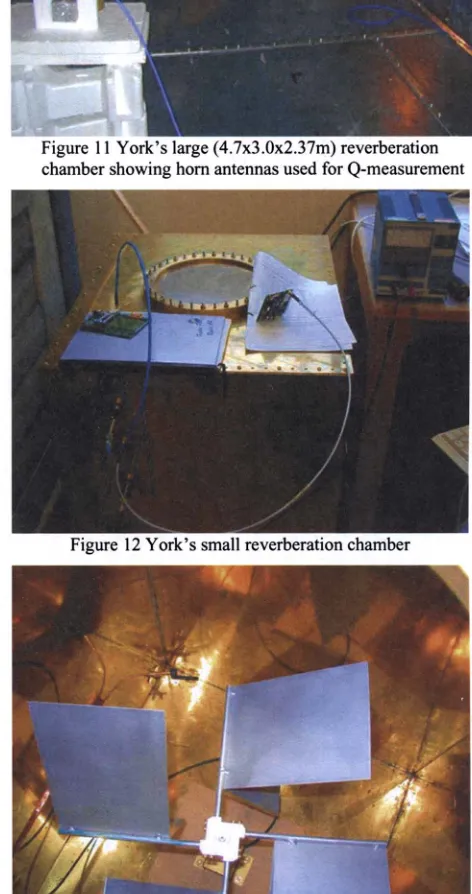
Figure 13 Inside York's small reverberation chamber Figure 10 shows the time varying performance of the Wifi link in an office environment for comparison.
12
Throughput 120
Packet error rate
10 100
en
~ 8 80
iii
~
-"5a. ?ft.
6 60~
.r::. w
C)
::J
n-o
'- 4 40 Figure 11 York's large (4.7x3.0x2.37m) reverberation
.r::.
.-
chamber showing hom antennas used for Q-measurement2 20
12
Throughput 120
Packet error rate
10 100
en
~ 8 80
iii
~
-"S ?ft. Figure 12 York's small reverberation chamber
a. 6 60~
~ w
C)
::J
n-o
'- 4 40
.r::.
.-2 20
o
0
o
100 200 300 400 500Stirrer posisition (steps)
Figure 9: Wifi Packet error rate and throughput at an average Q-factor of 573
Figure 8 shows how the performance of a Wifi link varied with stirrer position in the reverberation chamber with a Q-factor of 1451 corresponding to a mean delay spread of 0.1 JlS. One stirrer step corresponds to a movement of approximately 1 mm at the periphery of the stirrer. Again it can be seen that relatively small movements of the stirrer can produce large changes in performance of the Wifi system. Another older Wifi system had a significantly poorer performance in this test, with occasional permanent link failures
o
0o
100 200 300 400 500Stirrer posisition (steps)
Figure 10: Wifi Packet error rate and throughput at an average Q-factor of 144
[image:5.595.310.545.105.313.2] [image:5.595.75.295.193.389.2] [image:5.595.306.542.238.685.2]5 Concluding remarks
Measurements have been made of the performance of a ZigBee radio system in static and time varying reverberant environments using mode stirrer chambers.Ithas been found that in most real world situations where Q-factor is below 1000 transmission will be possible but when the Q is increased to beyond 1000 or the delay spread goes beyond a few microseconds it will no longer be guaranteed to function correctly. Generally the system will be reliable up to a Q-factor of 5000 but there may be positions of the antennae where thelinkfails at this level of Q-factor. All experiments were done without any external noise sources and results may change with additional noise. However in these experiments, in high Q environments frequency selective fading was found to be the main cause of errors. There is not a simple relationship between performance and Q-factor, for example by PER being proportional to Q, although average PER does fall with Q when the average is over a number of stirrer positions. Unlike in the Gaussian noise situation there is not a gradual falling off in performance but rather there is a steep cut off after which the system fails to operate correctly. In many cases PER was either 0% or 100% and so it is important that in any installation Q is sufficiently low there is no chance of moving into a position with error rate 100%. Simulation techniques have been developed to match the measurements and these may be done in order to predict delay spreads, indicating environments where extra absorbing material might be needed. Early experiments have shown that movement of the stirrer has the effect of increasing the error rate and that this converges to a maximum value but further work is needed in this area.
We have also conducted some preliminary measurements that demonstrate that a Wifi system (802.11 b) is affected considerably by environments with Q-factors of 750 and above. The newer 802.llg and n standards are also designed around the delay spread of less than a few hundred nano-seconds and so are likely to affected by reverberant environments.
Acknowledgements
The authors would like to acknowledge the support of BAE Systems and EPSRC (GR/S7l552/01) under the FLAVIIR programme [13] and the ASTRAEA programme.
References
[1] C. Furse, R. Haupt, "Down to the Wire", IEEE Spectrum, vol. 38,no.2,pp. 34-39,2001
[2] J. Prendergast, "Airbus Industries - Caught Between Several Rocks and a Hard Place", The European Journal, vol. 14, no. 3, pp. 14-18,2007.
[3] G Studor, "Fly-by-Wireless: A Revolution in Aerospace Vehicle Architecture for Instrumentation and Control", CANEUS "Fly-by-Wireless" Workshop, 27-28 Mar. 2007, Grapevine, TX, United States
[4] Zigbee Alliance, "Zigbee specification", Version 1.0, December 14th2004, available from:
http://www.zigbee.org/en/index.asp.
[5] D. A. Hill, "Plane-wave integral representation for fields in reverberation chambers," IEEE Transactions on Electromagnetic Compatibility, vol. 40, pp. 209-217, Aug. 1998.
[6] IEEE Computer Society, "IEEE Std 802.11g™-2003, Part 11: Wireless LAN Medium Access Control (MAC) and Physical Layer (PHY) specifications, Amendment 4: Further Higher Data Rate Extension in the 2.4 GHz Band", IEEE, 27 June 2003, available from:
http://standards.ieee.org/getieee802/download/802.11 g-2003.pdf
[7] Wikipedia, "Network topology", 21 July 2008, http://en.wikipedia.org/wiki/Network_topology [8] Wikipedia Commons, "NetworkTopologies.png",
retrieved 21 July 2008,
http://commons.wikimedia.org/wiki/lmage:NetworkTop ologies.png
[9] J A. Paradiso and T Stamer,"Energy Scavenging for Mobile and Wireless Electronics", IEEE Pervasive Computing, January-March 2005, pp 18-27 [10] Wired Equivalent Privacy, Wikipedia,
http://en.wikipedia.org/wiki/Wired Equivalent Privacy, retrieved 23 July 2008
[11] Bluetooth® SIG, Inc., "Bluetooth® Specification", 05 November 2003, available from
http://www.bluetooth.com
[12] Wikipedia, "Ultra-wideband", retrieved 23 July 2008, http://en.wikipedia.org/wiki/Ultra-wideband