Interrelation model capital/output in the
conditions of a new technological platform
aValentin Sokolov1, Galina Karpova2, and Alena Kuryleva3
1 Saint Petersburg State Economy University, Center for fundamental Studies of Development Processes in the Russian Economy, 191002 Marat st. 27, Russian Federation
2 Saint Petersburg State University of Architecture and Civil Engineering, Faculty of economics and management, 190005 2nd Krasnoarmeiskaya st. 4, Russian Federation
3 Saint Petersburg State Economy University, dept. of Applied Mathematics and Economical-Mathematical Methods, 191023 Sadovaya st. 21, Russian Federation
Abstract. Many experts relate rehabilitation of the world economy to forming a new technological platform. In this work we made an attempt to show the trends in the interrelation between capital and output in the conditions of forming new technological platform. In order to do that, we used a modified productive function with technical progress saving labor consumption. Even though this model bears a simulative character, it has all the required capabilities to calculate interrelations “capital/output” for long periods of time and can be a tool to investigate the economical dynamics with consideration of the new character of the economic progress.
1 Introduction
The scholars who analyzed stagnation in the Japanese economy that had lasted more than 10 years, pointed out such a reason as low efficiency in using the capital [1, 2]. In their co-operative research, the Japanese and Korean economists see the reason for stagnation of the Japanese economy in very low tempo of capital investment into its development [3]. One of the ways to solve the problem of the economic stagnation is a search of new technological solutions to dramatically change the entire economic landscape and give a new incentive to development. Here we would like to highlight the strategic recommendations for development of "the Industry 4.0" for German manufacturers [4], two American concepts: "Industrial internet" [5] and "Internet of Things" [6]. The research on the artificial intelligence [7] issued in 2003 laid a basement for industrial development of artificial intelligence systems. At the World Economic Forum a wide-scale discussion was started on the "Fourth industrial revolution" [8]. It is easy to notice that accumulation is taking place
of the “critical mass” of new knowledge and technologies that can work as an explosion to
create new conditions for development. It is obvious that this development will require sufficient amount of capital and expenditures to support human resources. In this respect
aThis article was prepared with financial support of the RUSSIAN Scientific fund (Grant No. 18-18-00099)
we consider it important to investigate capital accumulation and the interrelation "capital/output" in the conditions of forming a new technological platform.
2 Some initial provisions
Nickolas Kaldor [9] in 1961 formulated 5 empirical regularities (sometimes referred to as "formalized facts") that are relevant in the long-term perspective, when consequences of various economical and financial crises have leveled out. For our research, two empirical regularities of Kaldor [9] have relevance:
1. The ratio between the physical capital and the output – which is almost a constant value.
2. The share of labor and physical capital in the growth of the national income – these are, too, almost constant values.
The first of these regularities can be formalized as follows:
𝑌𝑌 = 𝜅𝜅 ∙ 𝐾𝐾, 𝜅𝜅 = 𝑐𝑐𝑐𝑐𝑐𝑐𝑐𝑐𝑐𝑐, (1)
where 𝜅𝜅 is the coefficient of capital return. We assume that the equality (1) will be observed in the first half of the XXI century. This is directly derived from the results obtained by Thomas Piketti and presented in his work "Capital in the XXI Century" [10]a.
As for the second Kaldor’s regularity mentioned above, our opinion is that it will not be
observed anymore in XXI c., because the share of the capital in the national income growth will steadily increase, which conforms to the results obtained by T. Piketti.
3 Model
Our model is based on the productive function (PF) with labor-saving (labor-intensive) technical progress:
𝑌𝑌̃ = 𝐾𝐾𝛼𝛼∙ (𝐴𝐴 ∙ 𝐿𝐿)1+𝜎𝜎−𝛼𝛼, (2)
where 𝑌𝑌̃ is the theoretical volume of the Gross Domestic Product (GDP); 𝐾𝐾 is the physical capital; 𝐿𝐿 is the number of the workforce in the economy; 𝐴𝐴 is the technical progress; 𝛼𝛼 is the share of the capital in the GDP growth; 𝜎𝜎 is the parameter characterizing a growing yield from the production scope (𝜎𝜎 ≥ 0).
In the long-term perspective, the capital-output ratio is directly related to the amount of savings (𝑐𝑐) in the economy and averaged growth rates (𝑔𝑔) of its Gross Domestic Product (𝑌𝑌):
𝛽𝛽 = 𝜅𝜅−1=𝑠𝑠
𝑔𝑔. (3)
T. Piketti considers interrelation (3) as the second basic regularity of capitalism. This regularity is asymptotic: in the long-term perspective, the capital-output ratio 𝛽𝛽 will tend to approach an equilibrium determined by the interrelation𝛽𝛽 = 𝑐𝑐 𝑔𝑔⁄ . It is easy to see that this
aDuring XVIII-XIX cc. this ratio, which is a capital-output ratio
𝛽𝛽 = 𝜅𝜅−1= 𝐾𝐾 𝑌𝑌⁄, in the leading European economies was pretty
stable and was equal to 𝛽𝛽 ≅ 7 in France and Great Britain, whereas in Germany it was 𝛽𝛽 ≅ 6.5 [10]. In the USA this ratio reached quasi-stability in the early XX c., at the level 𝛽𝛽 ≅ 4.5, and then, beginning from mid-XX c., it was stabilized at the level 𝛽𝛽 ≅ 4
we consider it important to investigate capital accumulation and the interrelation "capital/output" in the conditions of forming a new technological platform.
2 Some initial provisions
Nickolas Kaldor [9] in 1961 formulated 5 empirical regularities (sometimes referred to as "formalized facts") that are relevant in the long-term perspective, when consequences of various economical and financial crises have leveled out. For our research, two empirical regularities of Kaldor [9] have relevance:
1. The ratio between the physical capital and the output – which is almost a constant value.
2. The share of labor and physical capital in the growth of the national income – these are, too, almost constant values.
The first of these regularities can be formalized as follows:
𝑌𝑌 = 𝜅𝜅 ∙ 𝐾𝐾, 𝜅𝜅 = 𝑐𝑐𝑐𝑐𝑐𝑐𝑐𝑐𝑐𝑐, (1)
where 𝜅𝜅 is the coefficient of capital return. We assume that the equality (1) will be observed in the first half of the XXI century. This is directly derived from the results obtained by Thomas Piketti and presented in his work "Capital in the XXI Century" [10]a.
As for the second Kaldor’s regularity mentioned above, our opinion is that it will not be
observed anymore in XXI c., because the share of the capital in the national income growth will steadily increase, which conforms to the results obtained by T. Piketti.
3 Model
Our model is based on the productive function (PF) with labor-saving (labor-intensive) technical progress:
𝑌𝑌̃ = 𝐾𝐾𝛼𝛼∙ (𝐴𝐴 ∙ 𝐿𝐿)1+𝜎𝜎−𝛼𝛼, (2)
where 𝑌𝑌̃ is the theoretical volume of the Gross Domestic Product (GDP); 𝐾𝐾 is the physical capital; 𝐿𝐿 is the number of the workforce in the economy; 𝐴𝐴 is the technical progress; 𝛼𝛼 is the share of the capital in the GDP growth; 𝜎𝜎 is the parameter characterizing a growing yield from the production scope (𝜎𝜎 ≥ 0).
In the long-term perspective, the capital-output ratio is directly related to the amount of savings (𝑐𝑐) in the economy and averaged growth rates (𝑔𝑔) of its Gross Domestic Product (𝑌𝑌):
𝛽𝛽 = 𝜅𝜅−1= 𝑠𝑠
𝑔𝑔. (3)
T. Piketti considers interrelation (3) as the second basic regularity of capitalism. This regularity is asymptotic: in the long-term perspective, the capital-output ratio 𝛽𝛽 will tend to approach an equilibrium determined by the interrelation𝛽𝛽 = 𝑐𝑐 𝑔𝑔⁄ . It is easy to see that this
aDuring XVIII-XIX cc. this ratio, which is a capital-output ratio
𝛽𝛽 = 𝜅𝜅−1= 𝐾𝐾 𝑌𝑌⁄ , in the leading European economies was pretty
stable and was equal to 𝛽𝛽 ≅ 7 in France and Great Britain, whereas in Germany it was 𝛽𝛽 ≅ 6.5 [10]. In the USA this ratio reached quasi-stability in the early XX c., at the level 𝛽𝛽 ≅ 4.5, and then, beginning from mid-XX c., it was stabilized at the level 𝛽𝛽 ≅ 4
[10]. We can see that the capital-output ratio in the USA was much more limited than in the Western-European countries, i.e., the corresponding Kaldor’s regularity for the USA also worked in the XX century. In the XXI c., the capital-output ratio raised high again, close to values of the XVIII-XIX cc. T. Piketti explains the transition to the regime of the slow economic growth [10]. In this respect, T. Piketti predicted that, on the global scale, the capital-output ratio (𝛽𝛽), which has once approached the value of 5 and reached the level of the year 1910, will later be about 6 in mid-XXI and will reach 7 by late XXI c. In our opinion, a significant growth of capital will actually take place, but the ratio (𝛽𝛽) will remain essentially the same, which we are going to illustrate later on the basis of model calculations.
interrelation results from the theory of the economic growth by Harrod-Domar and is unstable in the dynamic aspect. Therefore, the equality (1) will determine the PF (2). So, the accumulation of the capital and new revolutionary technologies and innovations will become a dominating moving force influencing the economic growth in the first half of the XXI century.
Let us consider the regularities of capital accumulation in the conditions of forming new technological platforms. It is well known that the dynamics of the capital growth is estimated by the capital accumulation equation:
𝐾𝐾̇(𝑡𝑡) = 𝐼𝐼(𝑡𝑡) − 𝜇𝜇 ∙ 𝐾𝐾(𝑡𝑡), (4)
where 𝐼𝐼(𝑡𝑡) is industrial investment, 𝜇𝜇 is the norm of capital retirement. Due to the fact that
𝐼𝐼(𝑡𝑡) = 𝑠𝑠 ∙ 𝑌𝑌(𝑡𝑡), the equation (4) will transform into:
𝐾𝐾̇(𝑡𝑡) = 𝑠𝑠 ∙ 𝑌𝑌(𝑡𝑡) − 𝜇𝜇 ∙ 𝐾𝐾(𝑡𝑡). (5)
Considering the basic equality (1), basing on (5), we obtain the final equality capital accumulation:
𝐾𝐾̇(𝑡𝑡) = (𝑠𝑠 ∙ 𝜅𝜅 − 𝜇𝜇) ∙ 𝐾𝐾(𝑡𝑡). (6)
This differential equation is solved as follows:
𝐾𝐾(𝑡𝑡) = 𝐾𝐾0∙ exp[(𝑠𝑠 ∙ 𝜅𝜅 − 𝜇𝜇) ∙ (𝑡𝑡 − 𝑇𝑇0)]. (7) Therefore, on the basis of the assumption (1) there will be an exponential growth of the accumulated volume of the industrial capital.
However, considering that, in accordance with the theory of Big Cycles by Kondratiyev (BCK) during its descending stage, the effect of capital saturation is to take place, in reality it is to be expected that capital accumulation will take place according to the logistic regularity:
𝐾𝐾(𝑡𝑡) = 𝐾𝐾𝑚𝑚
1+(𝐾𝐾𝑚𝑚𝐾𝐾0−1)∙exp[−𝑣𝑣𝑘𝑘∙(𝑡𝑡−𝑇𝑇0)], (8)
where 𝐾𝐾0and 𝐾𝐾𝑚𝑚 are the initial and the maximum values of the accumulated capital within
the limits of the 6-th BCK (2018-2050); 𝑣𝑣𝑘𝑘 is the parameter describing the rate of capital
accumulation. The parameters 𝐾𝐾𝑚𝑚 and 𝑣𝑣𝑘𝑘 in the formula (8) shall be determined from the
condition of coincidence of trajectories of he accumulated capital growth (7) and (8) at the section of the increasing stage of the 6-th BCK (2018-2034). That is why it is very important to predict, with sufficient accuracy, the parameters 𝑠𝑠, 𝜅𝜅 and 𝜇𝜇 in the formula (7).
In the new conditions of an accelerated capital accumulation (8), it is most natural to adopt the type of the technical progress related to the amount of knowledge, skills and experience obtained during practical work with the new equipment, which, in its turn, depends on the volume of the employed capital, i.e. there will be a model of training in the process of production necessity, proposed by Kenneth Arrow in 1962 [11]:
a) 𝐴𝐴 = 𝐾𝐾𝜃𝜃; b) 𝐴𝐴 = (𝐾𝐾 𝐿𝐿)
𝜃𝜃
, 0 < 𝜃𝜃 < 1, (9) where 𝜃𝜃 is the parameter describing the efficiency of the education. For traditional economy branches, typical are the values 𝜃𝜃 = 0.3. For most modern economies, it is obviously true that the following inequality applies: 0.1 <𝜃𝜃 < 0.7.
𝛼𝛼 = 𝛼𝛼𝑚𝑚
1+(𝛼𝛼𝑚𝑚𝛼𝛼0−1)∙exp[−𝑣𝑣𝛼𝛼∙(𝑡𝑡−𝑇𝑇0)], (10)
where 𝛼𝛼0and 𝛼𝛼𝑚𝑚 are shares of capital in GDP increase at the beginning and the end of the
6-th BCK (2018 and 2050); 𝑣𝑣𝛼𝛼 is the rate of growth of the capital share. Т. Piketti predicts
the value 𝛼𝛼𝑚𝑚 to be 10 per cent higher than 𝛼𝛼0.
Therefore, the formulas (1), (8), (9b) and (10) describe the trends of development of highly profitable economies while new technological platforms are formed. Using these formulas, the basic PF (2) can be converted into an equation to calculate the predicted dynamics of the basic economic variables 𝑌𝑌, 𝐿𝐿 and 𝐴𝐴. In order to do that, let us substitute the formulas (1) and (9b) into the production function (2). The result will be:
a) 𝑌𝑌(𝑡𝑡) = 𝜅𝜅 ∙ 𝐾𝐾(𝑡𝑡);
b) 𝑞𝑞𝑦𝑦=𝑌𝑌̇𝑌𝑌= 𝑞𝑞𝑘𝑘 =𝐾𝐾̇𝐾𝐾; (11)
c) 𝐿𝐿(𝑡𝑡) = 𝜅𝜅(1−𝜃𝜃)∙(1+𝜎𝜎−𝛼𝛼)1 ∙ 𝐾𝐾(𝑡𝑡)1−𝛼𝛼−𝜃𝜃∙(1+𝜎𝜎−𝛼𝛼)(1−𝜃𝜃)∙(1+𝜎𝜎−𝛼𝛼); d) 𝐴𝐴(𝑡𝑡) = (𝐾𝐾𝐿𝐿)𝜃𝜃= 𝜅𝜅− (1−𝜃𝜃)∙(1+𝜎𝜎−𝛼𝛼)𝜃𝜃 ∙ 𝐾𝐾(𝑡𝑡)(1−𝜃𝜃)∙(1+𝜎𝜎−𝛼𝛼)𝜃𝜃∙𝜎𝜎 .
Whereas the dynamics of the capital accumulation 𝐾𝐾(𝑡𝑡); will be described by the logistic function (8):
𝐾𝐾(𝑡𝑡) = 𝐾𝐾𝑚𝑚
1+(𝐾𝐾𝑚𝑚𝐾𝐾0−1)∙exp[−𝑣𝑣𝑘𝑘∙(𝑡𝑡−𝑇𝑇0)]. (12)
In the formulas (11) the value 𝛼𝛼 is changed according to the graph (10): 𝛼𝛼(𝑡𝑡) =1+(𝛼𝛼𝑚𝑚 𝛼𝛼𝑚𝑚
𝛼𝛼0−1)∙exp[−𝑣𝑣𝛼𝛼∙(𝑡𝑡−𝑇𝑇0)].
(13)
As we can see from the formula (11b), the rates of the economic growth will only be determined by the rates of the capital accumulation and will not depend on the increase in redundancy. Considering (12), we obtain the result:
𝑞𝑞𝑦𝑦=𝐾𝐾̇𝐾𝐾= 𝑣𝑣𝑘𝑘∙𝐾𝐾𝐾𝐾(𝑡𝑡)(𝑚𝑚)∙ (𝐾𝐾𝑚𝑚𝐾𝐾0 − 1) ∙ exp[−𝑣𝑣𝑘𝑘∙ (𝑡𝑡 − 𝑇𝑇0)]. (14)
For the countries where there is a constant or decreasing yield from the scale (𝜎𝜎 = 0), the equations (11) will take the following form:
a) 𝑌𝑌(𝑡𝑡) = 𝜅𝜅 ∙ 𝐾𝐾(𝑡𝑡);
b) 𝑞𝑞𝑦𝑦= 𝑞𝑞𝑘𝑘; (15)
c) 𝐿𝐿(𝑡𝑡) = 𝜅𝜅(1−𝜃𝜃)∙(1−𝛼𝛼)1 ∙ 𝐾𝐾(𝑡𝑡); d) 𝐴𝐴(𝑡𝑡) = 𝜅𝜅−(1−𝜃𝜃)∙(1−𝛼𝛼)𝜃𝜃 .
Despite that the proposed model bears a simulative character, it has sufficient potential that can be demonstrated during verification of the actual statistical data for the economies of some well-developed countries.
4 Preliminary results
𝛼𝛼 = 𝛼𝛼𝑚𝑚
1+(𝛼𝛼𝑚𝑚𝛼𝛼0−1)∙exp[−𝑣𝑣𝛼𝛼∙(𝑡𝑡−𝑇𝑇0)], (10)
where 𝛼𝛼0and 𝛼𝛼𝑚𝑚 are shares of capital in GDP increase at the beginning and the end of the
6-th BCK (2018 and 2050); 𝑣𝑣𝛼𝛼 is the rate of growth of thecapital share. Т. Piketti predicts
the value 𝛼𝛼𝑚𝑚 to be 10 per cent higher than 𝛼𝛼0.
Therefore, the formulas (1), (8), (9b) and (10) describe the trends of development of highly profitable economies while new technological platforms are formed. Using these formulas, the basic PF (2) can be converted into an equation to calculate the predicted dynamics of the basic economic variables 𝑌𝑌, 𝐿𝐿 and 𝐴𝐴. In order to do that, let us substitute the formulas (1) and (9b) into the production function (2). The result will be:
a) 𝑌𝑌(𝑡𝑡) = 𝜅𝜅 ∙ 𝐾𝐾(𝑡𝑡);
b) 𝑞𝑞𝑦𝑦=𝑌𝑌̇𝑌𝑌= 𝑞𝑞𝑘𝑘 =𝐾𝐾̇𝐾𝐾; (11)
c) 𝐿𝐿(𝑡𝑡) = 𝜅𝜅(1−𝜃𝜃)∙(1+𝜎𝜎−𝛼𝛼)1 ∙ 𝐾𝐾(𝑡𝑡)1−𝛼𝛼−𝜃𝜃∙(1+𝜎𝜎−𝛼𝛼)(1−𝜃𝜃)∙(1+𝜎𝜎−𝛼𝛼);
d) 𝐴𝐴(𝑡𝑡) = (𝐾𝐾𝐿𝐿)𝜃𝜃= 𝜅𝜅− (1−𝜃𝜃)∙(1+𝜎𝜎−𝛼𝛼)𝜃𝜃 ∙ 𝐾𝐾(𝑡𝑡)(1−𝜃𝜃)∙(1+𝜎𝜎−𝛼𝛼)𝜃𝜃∙𝜎𝜎 .
Whereas the dynamics of the capital accumulation 𝐾𝐾(𝑡𝑡); will be described by the logistic function (8):
𝐾𝐾(𝑡𝑡) = 𝐾𝐾𝑚𝑚
1+(𝐾𝐾𝑚𝑚𝐾𝐾0−1)∙exp[−𝑣𝑣𝑘𝑘∙(𝑡𝑡−𝑇𝑇0)]. (12)
In the formulas (11) the value 𝛼𝛼 is changed according to the graph (10):
𝛼𝛼(𝑡𝑡) = 𝛼𝛼𝑚𝑚
1+(𝛼𝛼𝑚𝑚𝛼𝛼0−1)∙exp[−𝑣𝑣𝛼𝛼∙(𝑡𝑡−𝑇𝑇0)]. (13)
As we can see from the formula (11b), the rates of the economic growth will only be determined by the rates of the capital accumulation and will not depend on the increase in redundancy. Considering (12), we obtain the result:
𝑞𝑞𝑦𝑦=𝐾𝐾̇𝐾𝐾= 𝑣𝑣𝑘𝑘∙𝐾𝐾𝐾𝐾(𝑡𝑡)(𝑚𝑚)∙ (𝐾𝐾𝐾𝐾𝑚𝑚0− 1) ∙ exp[−𝑣𝑣𝑘𝑘∙ (𝑡𝑡 − 𝑇𝑇0)]. (14)
For the countries where there is a constant or decreasing yield from the scale (𝜎𝜎 = 0), the equations (11) will take the following form:
a) 𝑌𝑌(𝑡𝑡) = 𝜅𝜅 ∙ 𝐾𝐾(𝑡𝑡);
b) 𝑞𝑞𝑦𝑦= 𝑞𝑞𝑘𝑘; (15)
c) 𝐿𝐿(𝑡𝑡) = 𝜅𝜅(1−𝜃𝜃)∙(1−𝛼𝛼)1 ∙ 𝐾𝐾(𝑡𝑡);
d) 𝐴𝐴(𝑡𝑡) = 𝜅𝜅−(1−𝜃𝜃)∙(1−𝛼𝛼)𝜃𝜃 .
Despite that the proposed model bears a simulative character, it has sufficient potential that can be demonstrated during verification of the actual statistical data for the economies of some well-developed countries.
4 Preliminary results
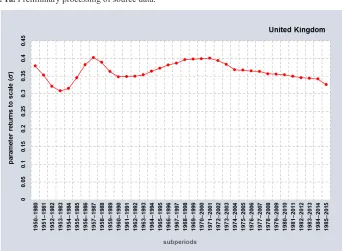
[image:5.482.53.439.61.317.2]Within the framework of this research, despite the simulative character of the proposed model, we have tried to verify it for the economy of the Great Britain, when we used the data from the World Bank [13] and University of Groningen [14] as the data base. The calculation results are presented below in figures 1-4.
Fig. 1a. Preliminary processing of source data.
[image:5.482.70.412.319.570.2]Fig. 2. Dynamics of the volume of physical capital at constant prices 2015.
[image:6.482.62.418.351.611.2]Fig. 2. Dynamics of the volume of physical capital at constant prices 2015.
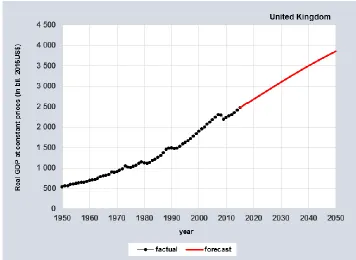
[image:7.482.51.437.62.326.2]Fig. 3. Dynamics of the volume of GDP at constant prices 2015.
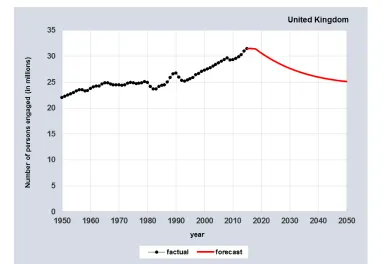
Fig. 4. Dynamics of employment.
It should be expected that in the long term for the UK, the capital / output ratio will be constant and the relationship between them will be linear. At the same time, the number of employees will tend to decrease, which is likely to lead to an increase in the share of the capital factor in the formation of gross output. This will reflect already emerging trends in economic development, when new technological platforms will be able to generate new value with much less involvement of a person directly into the production process itself.
References
1. A. Ando, D. Christelis, T. Miyagawa, NBER Working Paper, 9444 (2003)
2. F. Hayashi, Long-Run Growth and Short-Run Stabilization: Essays in Memory of
Albert Ando (Edward Elgar Publishing, Cheltenham, 2006)
3. H. Chun, T. Miyagawa, H. K. Pyo, M. Takizawa, K. Tonogi, The Fourth World
KLEMS Conference Asia KLEMS session (2016)
4. H. Kagermann, W. Wahlster, J. Helbig, Recommendations for implementing the
strategic initiative INDUSTRIE 4.0. [online], Available at: http://www.acatech.de/fileadmin/user_upload/Baumstruktur_nach_Website/Acatech/ro ot/de/Material_fuer_Sonderseiten/Industrie_4.0/Final_report__Industrie_4.0_accessibl e.pdf (2013)
5. P. C. Evans, M. Annunziata, Industrial Internet: Pushing the Boundaries of Minds and
Machines [online], Available at:
https://www.ge.com/docs/chapters/Industrial_Internet.pdf (2012) 6. M. Swan, J. Sens. Actuator Netw., 1 (2012)
7. S.J. Russel, P. Norvig, Artificial Intelligence: A Modern Approach (2nd ed.) (Prentice Hall, New Jersey, 2003)
Cologne, 2016)
9. N. Kaldor, Capital Accumulation and Economic Growth (St. Martin Press, New York, 1961)
10. T. Piketty, Capital in the Twenty-First Century (Harvard University Press, Harvard, 2014)
11. K. Arrow, Review of Economic Studies, 29 (80) (1962)
12. A. Akaev, A. Rudskoi, Economic Potential of Social Consequents, Industry 4.0 – Entrepreneurship and Structural Change in the New Digital Landscape (Springer Verlag,Berlin, 2016)
13. World Bank Open Data [online], Available at: http://data.worldbank.org/ (2017) 14. Penn World Table - international comparisons of production, income and prices 9.0