Abstract: This paper presents an efficient event detection and
classification technique for multiple power quality (PQ) disturbances. Initially synthetic power quality disturbances are simulated and then are directly processed to generate the target feature sets which comprises of energy, entropy, root mean square (RMS), mean, standard deviation, kurtosis, variance and maximum peak respectively. After the overall data analysis, it was found that total five events out of the overall generated PQ disturbances were distinctively classified. Eventually these target features are passed through simple decision tree based event classifier for PQ events classification. The proposed technique has been scrutinized for number of disturbances presented in the PQ events where it is has been verified as a superior technique as compared with the some of the existing event classification techniques such as wavelet transform (WT). The entire process has been verified in the in the MATLAB /Editor. The proposed technique evades the need of further signal processing techniques for detection and classification PQ events, thus ensconced less computational complexity and faster execution. Hence it is an efficient algorithm for real time applications.
Index Terms: Multiple PQ events, simple decision tree, signal processing.
I. INTRODUCTION
With the increasing importance of maintaining the power quality (PQ), it is necessary to quickly quantify the power quality disturbances and analyze them. The PQ disturbances causes due to increasing distributed loads and power electronic devices usage, voltage fluctuations and noise. The presence of PQ disturbances in the system / equipment will reduces the efficiency and life time of the equipment. The power quality signals can be divided into two types one is stationary and other one is non-stationary signals [1]. Stationary signal means that which mean and variance does not vary with time, in the case of non-stationary signal both of them or either of them will be vary with time. Mostly power quality disturbances are non-stationary signals in nature. In order to avoid the PQ disturbances it is necessary to detect the disturbances where it will be appeared simultaneously in the system.
Revised Manuscript Received on April 06, 2019.
Rajesh Kumar Patnaik, Department of EEE, GMRIT, Rajam, Andhra Pradesh, India.
Kanche Anjaiah, Department of EEE, GMRIT, Rajam, Andhra Pradesh, India.
Rakesh Kumar Patnaik, Department of ECE, GMRIT, Rajam, Andhra Pradesh, India.
The power quality disturbance classification methods consists majorly three steps: pre-processing, feature extraction and classification of the signal [2]. Power quality disturbance detection methods are Short Time Fourier Transform (STFT) [3], Wavelet Transform (WT) [8], Discrete Wavelet Transform (DWT) [7], Continuous Wavelet Transform (CWT) [10], Empirical Mode Decomposition (EMD) [4], Variational Mode Decomposition (VMD) [5], Hilbert Transform (HT) [7], Hilbert-Hung Transform (HHT) [9] and Empirical Wavelet Transform (EWT) [1]. According to the literature survey reveals that the analysis of signal with the wavelet transforms (i.e. WT, CWT and DWT) requires proper selection of a mother wavelet, decomposition levels and sampling frequency. Selection of these parameters with respect to mother wavelet will be from the signal containing parameters due to this wavelet transforms had computational complexity is high and also noise is not considered in the signal. By using STFT only instant time-frequency related disturbance waveforms can be analyzed, but transient signals cannot be analyzed with this transform [3]. For the HT, HHT and EMD have no supporting mathematical theory and these are also noise sensitive.
In this paper simple decision tree based technique is proposed for detection and classification of events i.e. sag swell, interruptions, transients, harmonics, flicker, notch.etc. The major advantage of the proposed technique is it doesn’t require any signal processing algorithm and it gives the system with certain advantages like computational complexity less, less economical cost, and faster execution timings.
Initially the PQ disturbances in the proposed technique has been extracted and directly computed to generate the initial feature set such as energy, entropy, mean, standard deviation, root mean square, kurtosis, maximum peak and variance etc. After generating these feature sets for all the cases (as discussed in section III), they have been separated with the distinct values of each feature from afore mentioned features. After analyzing the PQ disturbances with the aforementioned feature set for all the cases the target feature set has been formed which contains E1 (energy), E2 (entropy), E3 (root mean square), E4 (mean), E5 (standard deviation), E6 (kurtosis), E7 (maximum peak) and E8 (variance). These feature sets passed through a simple decision tree based event classifier, which classifies the events as discussed in section VI. The overall organization
of the paper is discussed as follows. A brief introduction to motivation and recent
A Simple Decision Tree Based Event
Classification Technique For Multiple Power
Quality Disturbance Signals
trends about power quality disturbances was given in the section I. Section II Generation of PQ events. Section III Target feature extraction. A simple decision tree based PQ event classifier in section IV. Section V Performance analysis of the proposed method is compared and analyzed with the PQ disturbances is simulated in the MATLAB.
II. GENERATIONOFPOWERQUALITY(PQ) EVENTS
In this section, the generation of the power quality disturbances such as sag, swell, transients /impulse/spike, interruptions, harmonics, flicker, notch etc., is discussed in detail. These PQ disturbances creates imbalance in the power in the system and that leads to damage the equipment. Now a day for every system had the major challenge to clear the faults very quickly due to it’s withstand capabilities. In order to clear the faults, it is necessary to detect and classify the power quality disturbances.
From these PQ events the proposed method focused on five events, i.e., swell, transients, interruptions, harmonics and flicker (as discussed in section III). The fundamental information regarding the generated PQ signals are as follows:
Ns = 64 (Ns is number of samples per cycle) F = 50 Hz (frequency)
Fs = 3200Hz (Sampling frequency)
Whenever the voltage is above the normal voltage, it is termed as swell, and it occurs when the heavy loads are switched on and off [6]. In this paper fig .1(a) represents the swell condition initiated at 150 milliseconds (0.15 sec) to 450 milliseconds (0.45 sec). The normal amplitude of the voltage signal is 1, but when the swell occurs, the amplitude of the voltage is increased to 1.5 as shown in the fig. 1(a). The actual range of swell is between 1.1pu to 1.8pu with 0.5sec to 1min. Due to the power system faults and equipment failures interruption will be occurred. The range of interruption is less than 0.1pu for a period of less than one minute. From this it is clear that interruption started from 165ms (0.165sec) to 370 ms (0.376 sec) as shown in the fig. 1(b). The energy imbalance between power sources and storage sources are caused to produce transients [11]. The transients are sudden change in the voltage is shown in the fig. 1(c). Harmonics are sinusoidal voltage frequencies that are integer multiples of supply voltage as shown in the fig. 1(d) these harmonics are caused due to non linear and power electronic devices. Flicker is the process of rapidly changes in the supply voltage that is shown in the fig. 1(e).
(a)
(b)
(d) (c)
(d)
(e) (e)
(e) Figure: 1: Synthetic PQ disturbances, where (a) Swell, (b) Interruptions, (c) Transients/spikes, (d) Harmonics and (e) Flicker.
III. TARGETFEATUREEXTRACTION
The major disturbances in the power quality analysis are sag, swell, interruption, harmonics, transients, flicker and notch. Out of these PQ disturbances are extracted with the help of the power quality indices. There are number of indices out of these indices eight parameters are considered those are E1 (energy), E2 (entropy), E3 (root mean square), E4 (mean), E5 (standard deviation), E6 (kurtosis), E7 (variance) and E8 (maximum peak) [11]. Under this consideration five types of PQ disturbances are extracted those are swell, interruption, harmonics, transients and flicker.
A.Energy of the signal (E1):
For a signal Y (t) with samples t = 1, 2, 3 … N its energy is defined as
Nt t
Y
E
Energy
1 2
1
(1)B.Entropy (E2):
N t t b tY
Y
E
Entropy
1log
2
(2)C.Root mean square(RMS)(E3):
It is defined as the square root of the sum of squares of the mean of the values of the signal
N t tY
Y
Y
N
E
RMS
1 2 2 2 21
...
)
(
1
3
(3)D.Mean (E4):
It is defined as the ratio of the sum of the samples to the number of samples
N t tN
Y
E
Mean
14
(4)Where N = total number of samples
E.Standard Deviation (E5):
It is defined as the attribute that enumerates the amount of deviation in a set of data values mathematically.
N t tE
Y
N
E
deviation
dard
S
1 2 4)
(
1
5
tan
(5)Where E4 is the mean and Yt is the signal storage with samples.
F.Kurtosis (E6):
It is the measure of the signal whether the data are peaked or flat relative to normal distribution. Data sets with high kurtosis tend to have a distinct peak near the mean and low kurtosis tend to have flat top near the mean
N tt
E
E
Y
N
E
Kurtosis
1 4 2 4)
/
5
)
((
1
6
(6)G. Variance (E7):
It is defined as the difference between the squared sums of the instantaneous samples to the distribution form of the mean (µ) divided by the number of terms in the distribution (N)
N t tN
Y
E
Variance
12
/
)
)
((
7
(7)H. Maximum Peak Amplitude (E8):
It is defined as the maximum value of the output of the signal. The target features are classified on the rule based model, in this model the distinctive features are found (the above all features i.e. from E1 to E8). Depend upon these features the power quality disturbances are classified as shown in the fig.2. In the figure.2 different colors are used for identification of PQ events. These PQ events will be shown at the top right corner side. On the basis of these target features of PQ events a simple decision tree was build it is discussed in section IV. All these power quality events are classified with the help of table. I
Interruptions
Transients/impulse/spike
Harmonics
Swell
Flicker
E1100 200 300 400 500 600 700 800
E2
0.5 1 1.5 2 2.5 3 3.5 4
E3
0.15 0.3 0.45 0.6 0.7 0.9 1.05 1.20
E4
-0.03 -0.02 -0.01 0 0.01 0.02
E5
0.15 0.3 0.45 0.6 0.75 0.9 1.05 1.20
E6
1.4 1.5 1.6 1.7 1.8 1.9
E7
0.2 0.4 0.6 0.8 1.0 1.2 1.4 1.6
E8
1.0 1.1 1.2 1.3 1.4 1.5 1.6 1.7
Fig.2. Target feature based PQ events classification E1-energy, E2- entropy, E3-RMS, E4-mean, E5-standard deviation, E6-kurtosis, E7- variance, E8- maximum peak
TABLE-I PERFORMANCE PARAMETERS FOR POWER QUALITY EVENTS
S N o
Event name
Sample Number
Target feature sets
Energy
Value (E1)
Entropy (E2)
RMS (E3)
Mean (E4)
Standar d (E5)
Kurtosi s (E6)
Maxim um (E7)
Varian ce (E8)
1 swell
1 873.638 3.0415 1.1684 0.0154 1.1692 1.9165 1.2251 1.3671
3 617.5288 3.0415 0.9823 -0.004 0.983 1.646 0.9664 1.5154
5 352.5636 3.6575 0.7422 0.0031 0.7428 1.5479 1.7669 0.5517
10 402.3172 3.3969 1.0794 -0.01 0.9004 1.6743 1.5353 0.8108
MAX 873.638 3.6575 1.1684 0.0154 1.1692 1.9165 1.7669 1.5154
MIN 352.5636 3.0415 0.7422 -0.01 0.7428 1.5479 0.9664 0.5517
2 Interrupti on
1 148.1271 3.7695 0.549 -0.0111 0.481 3.1829 0.9995 0.0959
5 61.285 3.2083 0.3094 0.0065 0.3096 7.9452 0.9991 0.4462
3 192.8878 3.7045 0.549 0.0011 0.5494 2.4777 0.3019 0.9999
10 285.1465 2.5971 0.6675 0.0295 0.668 1.693 1 0.3567
MAX 285.1465 3.7695 0.6675 0.0295 0.668 7.9452 1 0.9999
MIN 61.285 2.5971 0.3094 -0.0111 0.3096 1.693 0.3019 0.0959
3
Transient s/ Impulse/ spike
1 320.485 3.5 0.7076 0.0005 0.7082 1.5014 0.502 1
3 319.8526 3.5 0.7069 4.15E-04 0.7075 1.5012 0.5006 0.9994
5 320.0572 3.4288 0.7072 5.01E-04 0.7077 1.4995 0.5009 0.999
10 319.4 3.15 0.706 0.001 0.707 1.499 0.5 0.99
MAX 320.485 3.5 0.7076 0.001 0.7082 1.5014 0.502 1
MIN 319.4 3.15 0.706 0.000415 0.707 1.499 0.5 0.99
4 Harmonic s
1 332 3.31 0.72 2.18E-16 0.721 1.838 0.512 1.2043
5 330.923 3.2561 0.7191 -5.13E-17 0.7196 1.7561 0.5179 1.1946
3 325 2.9 0.713 -1.87E-16 0.713 1.408 0.5093 1.097
10 329.9419 2.9809 0.718 5.88E-17 0.7186 1.8386 0.5163 1.1431
MAX 332 3.31 0.72 2.18E-16 0.721 1.8386 0.5179 1.2043
MIN 325 2.9 0.713 -1.9E-16 0.713 1.408 0.5093 1.097
5 Flicker
1 329.85 4.44 0.717 0.0012 0.718 1.53 0.5162 1.097
5 324.0944 4.2789 0.7116 8.91E-04 0.7122 1.5142 0.5072 1.0665
3 322.5561 4.4465 0.7099 -6.59E-05 0.7105 1.5146 0.5048 1.0668
10 321.03 3.85 0.708 -0.00016 0.7083 1.514 0.5025 1.066
MAX 329.85 4.4465 0.717 0.0012 0.718 1.53 0.5162 1.097
MIN 321.03 3.85 0.708 -0.00016 0.7083 1.514 0.5025 1.066
6 Sag
1 246.6 3.918 0.6207 0.0191 0.6212 3.4009 0.385 1
5 153.8633 3.714 0.4903 -0.01 0.4906 1.7996 0.2407 0.9998
3 182.4174 3.8766 0.5339 -0.007 0.5343 2.6043 0.2854 0.9998
10 106.33 3.439 0.4076 -0.0104 0.4078 1.6278 0.166 0.99
MAX 246.6 3.918 0.6207 0.0191 0.6212 3.4009 0.385 1
MIN 106.33 3.439 0.4076 -0.0104 0.4078 1.6278 0.166 0.99
7 Notch
1 320.246 3.705 0.7074 0.0152 0.7078 1.7682 0.5009 1
5 3.01E+02 3.5 0.6862 3.35E-17 0.6868 1.5626 0.4717 0.9999
3 316.98 3.4688 0.7038 -0.0046 0.7043 1.5177 0.496 0.9993
10 276.43 3.437 0.657 -0.0046 0.6577 1.5018 0.4326 0.99
MAX 320.246 3.705 0.7074 0.0152 0.7078 1.7682 0.5009 1
IV. SIMPLEDESICISIONTREEBASEDPQEVENTCLASSIFIER
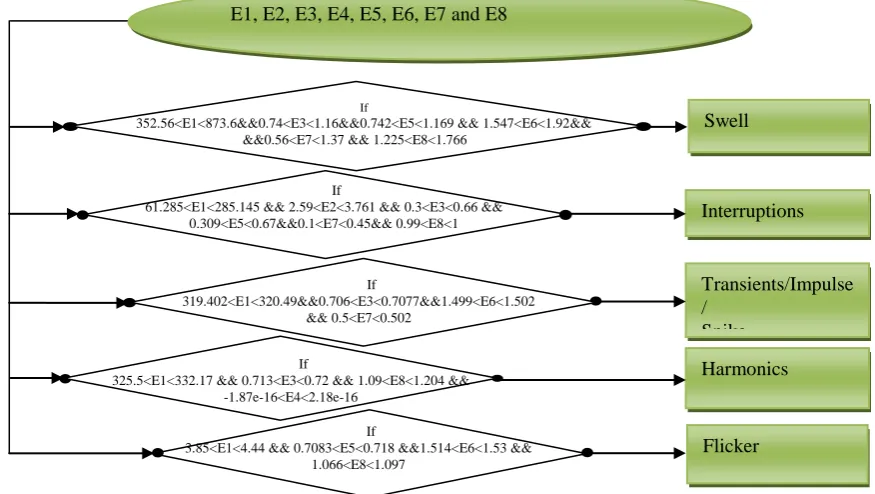
Fig.3 Decision tree for the proposed system
It is easy method to classify and diagnosis the power quality events under the disturbance conditions for the proposed method which was shown in the fig.3. Figure 3 shows decision tree for detecting the type of power quality events occurred when the disturbance created in the system. The PQ events classification with features is mathematically shown in the table I. the classification has the following procedure
Step -1: Write the code for above mentioned power quality events in the MATLAB script file.
Step -2: Run the program to generate above PQ events. Step -3: From these signals calculate the performance indices (features) with different samples.
Step -4: These features passed through the proposed decision tree for classifying the events.
Algorithm for decision tree for classification of PQ events Rule -1: If 352.56<E1<873.6 && 0.74<E3<1.16 && 0.742<E5<1.169 &&1.547<E6<1.916 && 0.56<E7<1.37 && 1.225<E8<1.766 then disturbance is swell
Rule -2: If 61.285<E1<285.145 && 2.59<E2<3.761 && 0.3<E3<0.66 && 0.309<E5<0.668 && 0.1<E7<0.45&& 0.99<E8<1 then disturbance is interruptions
Rule -3: If 319.402<E1<320.49&& 0.706<E3<0.7077 && 1.499<E6<1.5014 && 0.5<E7<0.502 then the disturbance is transients/impulse/spike
Rule -4: If 325.5<E1<332.17 && 0.713<E3<0.72 && 1.09<E8<1.204 && -0.01<E4<0.015 then the disturbance is harmonics.
Rule – 5: If 3.85<E1<4.44 && 0.7083<E5<0.718 && 1.514<E6<1.53 && 1.066<E8<1.097 then the disturbance is flicker
Else The PQ events are non distinctive
V. PERFORMANCEEVALUTIONFORPROPOSED
CLASSIFIER
To analyze the performance of the proposed technique it is necessary to calculate the efficiency of the technique. It defines the proposed technique ability to successfully classify the correct PQ events for the number of target samples. Efficiency can be defined as the ratio of the number of correct classified data sets to the randomly selected data sets from the overall set (raw set). The mathematical expression for efficiency is
100 events Overall
events classified correctly of
(%)
seletced randomly Number
Efficiency (8)
TABLE –II EFFICIENCY FOR THE PROPOSED METHOD
S No
Type of event
Total data sets collected
Taken data sets for testing technique
Efficie ncy %
1 Swell 10
100 random data sets from the overall set of 50 was chosen for testing
98.4 2 Interruptions 10
3 Transients/im pulse/spike 10
4 Harmonics 10
5 Flicker 10
Total Data Sets 50
After extracting performance indices, their
Harmonics E1, E2, E3, E4, E5, E6, E7 and E8
Swell
Interruptions
Transients/Impulse /
Spike
Flicker If
3.85<E1<4.44 && 0.7083<E5<0.718 &&1.514<E6<1.53 && 1.066<E8<1.097
If
319.402<E1<320.49&&0.706<E3<0.7077&&1.499<E6<1.502 && 0.5<E7<0.502
If
352.56<E1<873.6&&0.74<E3<1.16&&0.742<E5<1.169 && 1.547<E6<1.92&& &&0.56<E7<1.37 && 1.225<E8<1.766
If
61.285<E1<285.145 && 2.59<E2<3.761 && 0.3<E3<0.66 && 0.309<E5<0.67&&0.1<E7<0.45&& 0.99<E8<1
If
325.5<E1<332.17 && 0.713<E3<0.72 && 1.09<E8<1.204 && -1.87e-16<E4<2.18e-16
[image:5.595.302.555.543.831.2]distinctive values are passed through the decision tree based classifier (as shown in fig.3) to classify the PQ events. In this method 100 random test samples (out of entire 50 data sets) are passed through the decision tree based classifier. After that with use of equation 8, the efficiency of the proposed technique was found as 98.4% which is manifested in the table III.
A.flow chart for calculation of efficiency
Step -1: Let us assume that M is the number of events to be tested, D is number of correctly classified and initially it is zero (D = 0)
Step -2: Generate a random number (Rn) for which random number the initial prediction is generated (according to the following rule),
If Rn lies between 1 and 10 then the event is swell, then p set to be at 1.
If Rn lies between 11 and 20then the event is interruption, then p set to be 2.
If Rn lies between 21 and 30then the event is transients, then p set to be 3.
If Rn lies between 31 and 40then the event is harmonics, then p set to be 4.
If Rn lies between 41 and 50then the event is flicker, then p set to be 5.
Step-3: The data set ([E1, E2, E3, E4, E5, E6, E7, E8]1*8) pertaining to the row ‘Rn’ from the original set ([E1, E2, E3, E4, E5, E6, E7, E8]50*8) are taken as the testing data set which are passed through decision based classifier to generate ‘F’ i.e. final prediction of the algorithm based on the following rules
If algorithm conforms for swell F is set to be 1. Else
if algorithm conforms for interruptions F is set to 2. Else if algorithm conforms for transients F is set to be 3.
Else if algorithm conforms for harmonics F is set to be 4 Else if algorithm conforms for flicker F is set to be 5. Step- 4: if p = = F then D = D+1
Step- 5: Finally, efficiency of the algorithm will be calculated with the help of (D/M) * 100 and it will classify the correct event.
In order to prove the accuracy of the proposed algorithm, it is necessary to compare the efficiency of the proposed algorithm with existing methods [3, 8] which are illustrated in the table III.
TABLE –III COMPARISION BETWEEN PROPOSED AND EXISTING METHODS
S.NO Techniques Efficiency
(%)
1 Short time Fourier transform
[3] 91.8
2 Wavelet transform [8] 92.5
3 Proposed technique 98.4
From the above discussions (in table III) it is clear that the proposed method is exactly classified the PQ events with the help of performance indices without further processing them. Hence the computational complexity of the proposed algorithm is diminished without affecting the efficiency of the proposed algorithm
VI. PERFORMANCEEVALUTIONOFTHE
PROPOSEDTECHNIQUE
Initially, twenty-nine power quality events were simulated and passed through the signal processing algorithm for generating the target feature sets. After analyzing the target feature sets, it was found that, only five (out of the twenty-nine) classes can be distinctively classified. The overall classes have been classified by the proposed algorithm, with a classification accuracy of 98.4%, which as compared to the conventional methods, is verified to be efficient and superior. One of the shortcomings of the proposed method is that, it is unable to classify the all the twenty-nine events. This, with the help of any adaptive classification technique, will be addressed all the twenty-nine events in near future.
VII. CONCLUSION
In this paper a simple decision tree based power quality disturbance classification techniques has been developed. After processing the raw signals to generate the target feature sets, selected power quality events such as swell, interruption, transients, harmonics and flicker are efficiently and distinctively classified, with the help of a simple decision tree. classified. The proposed technique illustrates significant advantages such as better classification efficiency as compared to some existing techniques, as it doesn’t require further processing for classification. Finally, the proposed technique exhibits lesser computational complexity. The proposed method can employ the PQ monitoring and it is an effective tool for the PQ disturbances detection and classification.
REFERENCES
1. K. Thirumala, A. C. Umarikar and T. Jain, “Estimation of Single-Phase and Three-Phase Power-Quality Indices Using Empirical Wavelet Transform,” in IEEETransactions on Power Delivery, vol. 30, no. 1, pp. 445-454, Feb. 2015.
2. M. S. Manikandan, S. R. Samantaray and I. Kamwa, “Detection and
Classification of Power Quality Disturbances Using Sparse Signal Decomposition on Hybrid Dictionaries,” inIEEE Transactions on Instrumentation and Measurement, vol. 64, no. 1, pp.27-38, Jan. 2015. 3. M. Garrido, “The Feedforward Short-Time Fourier Transform,”
in IEEE Transactions on Circuits and Systems II: Express Briefs, vol. 63, no. 9, pp. 868-872, Sept. 2016.
4. S. Shukla, S. Mishra and B. Singh, “Empirical-Mode Decomposition
With Hilbert Transform for Power-Quality Assessment,” inIEEE Transactions on Power Delivery, vol. 24, no. 4, pp. 2159-2165, Oct. 2009.
5. P. D. Achlerkar, S. R. Samantaray and M. Sabarimalai Manikandan, “Variational Mode Decomposition and Decision Tree Based Detection and Classification of Power Quality Disturbances in Grid-Connected Distributed Generation System,” in IEEE Transactions on Smart Grid, vol. 9, no. 4, pp. 3122-3132, July 2018.
6. [6] H. Ghoddami and A. Yazdani, “A Mitigation Strategy for
Temporary Overvoltages Caused by Grid-Connected Photovoltaic Systems,” in IEEE Transactions on Energy Conversion, vol. 30, no. 2, pp. 413-420, June 2015.
7. R. Kumar, B. Singh, D. T. Shahani and C. Jain, “Dual-Tree Complex Wavelet Transform-Based Control Algorithm for Power Quality Improvement in a Distribution System,” in IEEE Transactions on Industrial Electronics, vol. 64, no. 1, pp. 764-772, Jan. 2017.
8. F. Hafiz, A. Swain, C. Naik, S. Abecrombie and A. Eaton, "Identification of power quality events: selection of optimum base wavelet and machine learning
9. M. Sahani and P. K. Dash, “Automatic Power Quality Events Recognition Based on Hilbert Huang Transform and Weighted Bidirectional Extreme Learning Machine,” in IEEE Transactions on Industrial Informatics, vol. 14, no. 9, pp. 3849-3858, Sept. 2018. 10. A. M. Abduljabbar, M. E. Yavuz, F. Costen, R. Himeno and H.
Yokota, “Continuous Wavelet Transform-Based Frequency Dispersion Compensation Method for Electromagnetic Time-Reversal Imaging”, inIEEE Transactions on Antennas and Propagation, vol. 65, no. 3, pp. 1321-1329, March 2017
11. F. A. S. Borges, R. A. S. Fernandes, I. N. Silva and C. B. S. Silva, “Feature Extraction and Power Quality Disturbances Classification Using Smart Meters Signals,” in IEEE Transactions on Industrial Informatics, vol. 12, no. 2, pp. 824-833, April 2016.
AUTHORSPROFILE
Dr. Rajesh Kumar Patnaik received his B.Tech, M.Tech and PhD degree in 2008, 2011 and 2016, in Electrical Engineering from BPUT, and SOA University, Bhubaneswar, Odisha, respectively. Currently he is an Associate Professor at GMR Institute of Technology, Rajam, Andhra Pradesh. He has published more than 20 papers in the area of renewable power systems in the area of control, protection and dynamics of non-linear power systems.
Mr. Kanche Anjaiah: received B.Tech degree in EEE from SKIST (Sree Kavitha Institute of Science and Technology), Madhira in 2015. He worked as a polytechnic lecturer with 2 years experience in Vijaya Engineering College, currently pursuing M Tech in GMRIT, Rajam.