City, University of London Institutional Repository
Citation
:
MacFarlane, A., Secker, A., May, P. and Timmis, J. (2010). An experimental comparison of a genetic algorithm and a hill-climber for term selection. Journal of Documentation, 66(4), pp. 513-531. doi: 10.1108/00220411011052939This is the unspecified version of the paper.
This version of the publication may differ from the final published
version.
Permanent repository link:
http://openaccess.city.ac.uk/1693/Link to published version
:
http://dx.doi.org/10.1108/00220411011052939Copyright and reuse:
City Research Online aims to make research
outputs of City, University of London available to a wider audience.
Copyright and Moral Rights remain with the author(s) and/or copyright
holders. URLs from City Research Online may be freely distributed and
linked to.
City Research Online: http://openaccess.city.ac.uk/ [email protected]
An Experimental Comparison of a Genetic Algorithm and a
Hill-Climber for Term Selection
A. MacFarlane1, A. Secker2, P. May2 and J. Timmis3
1Centre for Interactive Systems Research, Dept. Of Information Science, City University, Northampton Square, LONDON
EC1V 0HB, UK
2Computing Laboratory, University of Kent, Canterbury, CT2 7NF
3 Departments of Electronics and Computer Science, University of York. YO 10 5DD
ABSTRACT
Purpose – The term selection problem for selecting query terms in information filtering and routing has been investigated using hill-climbers of various kinds, largely through the Okapi experiments in the TREC series of conferences. Although these are simple deterministic approaches which examine the effect of changing the weight of one term at a time, they have been shown to improve the retrieval effectiveness of filtering queries in these TREC experiments. Hill-climbers are, however, likely to get trapped in local optima, and the use of more sophisticated local search techniques for this problem that attempt to break out of these optima are worth investigating. To this end, we apply a genetic algorithm (GA) to the same problem.
Design/Methodology/Approach – We use a standard TREC test collection from the TREC-8 filtering track, recording mean average precision and recall measures to allow comparison between the hill-climber and GA algorithms. We also vary elements of the GA, such as probability of a word being included, probability of mutation and population size in order to measure the effect of these variables. Different strategies such as Elitist and Non-Elitist methods are used, as well as Roulette Wheel and Rank selection GA algorithms.
Findings – The results of tests suggest that both techniques are, on average, better than the baseline, but the implemented GA does not match the overall performance of a hill-climber. The Rank selection algorithm does better on average than the Roulette Wheel algorithm. There is no evidence in this study that varying word inclusion probability, mutation probability or Elitist method make much difference to the overall results. Small population sizes do not appear to be as effective as larger population sizes.
Research limitations/implications – The evidence provided here would suggest that being stuck in a local optima for the term selection optimization problem does not appear to be detrimental to the overall success of the hill-climber. The evidence from term rank order would appear to provide extra useful evidence which hill-climbers can use efficiently and effectively to narrow the search space.
Originality/Value – The paper represents the first attempt to compare hill-climbers with GAs on a problem of this type.
Keywords: Term selection, local search, genetic algorithms, hill-climbers.
Article Type: Research paper.
INTRODUCTION
a user profile) and used to select new items from an incoming document stream. Of particular interest is the issue of term selection from a set of documents judged relevant by a user for a given topic. There are a wide range of techniques for term selection including traditional relevance feedback techniques (Harman, 1992) and machine learning techniques (Sebastiani, 2002). Both can be used independently for term selection, but they can also be combined with each other (Robertson et al, 1995). In this paper we present a comparison between a hill-climber, a popular method for optimizing the terms selected in a query, and a genetic algorithm (GA), tested on a term-selection problem. It is a well known disadvantage of hill-climbers that they may become trapped on a local optima, however GAs are not so prone to this drawback, and so it is hypothesized that a GA will perform better when applied to the term selection problem. The GA presented in this paper not only selects the terms to be included in the query, but also adjusts the weight of each word, reflecting the importance of the word in the final query. In addition to this straightforward comparison, the results of adjusting various parameters of the GA are described, giving the reader a more rounded view of how a GA may behave in this situation.
The remainder of the paper is laid out as follows. In the next section we describe the work done on the term selection problem and related research on GAs in information retrieval, thus providing the motivation for our research. The system used for our experiments and how the components were integrated is then described. The experimental design is declared, and the results are analysed. We then provide a discussion and conclusion.
PREVIOUS WORK IN THE AREA
The initial term selection algorithm used in Okapi at TREC-3 was a two stage process, applying relevance feedback and then using a single pass algorithm which selected a term if it yielded an increase in average precision. The algorithm started with the top three ranked terms for each topic (Robertson et al, 1995). This, in fact, was a steepest ascent hill-climber (Tuson, 1998), which was developed further at TREC 4 under the title of ‘Find Best’, together with two new algorithms, ‘Choose All Positive’ and ‘Choose First Positive’ - the latter being a first ascent hill-climber (Robertson et al, 1996). These TREC-4 experiments also introduced the concept of removing terms as well as adding them to the list, yielding a number of different operations on term lists, namely: add only; add-remove; and remove only. The
add-remove operation was shown to be the most beneficial (Robertson et al, 1996). The Okapi at TREC-5 experiments introduced the concept of weight variation for terms (Beaulieu et al, 1997), using a simple technique of multiplying a weight by 1.5 or 0.67 and taking the best result for that particular term. The use of simulated annealing to the weight variation function was tried in Okapi at TREC-6 (Walker et al, 1998), but without success. More recent work in the area was carried out by MacFarlane et al (2003), using parallel computing techniques to speed up the algorithms and operations mentioned above. These are local search techniques, where traversal through the search space is restricted to neighbourhood solutions.
used a GA to adapt weights for pre-selected keywords (no optimisation on terms was completed). Martin-Bautista et al (1999) take this idea further and use GA’s to learn ranking functions as well, while Fan et al (2003) apply Genetic Programming (GP) techniques to the same problem. Lopez-Pujalte et al (2002), Lopez-Pujalte et al (2003a) and Lopez-Pujalte et al (2003b) investigated the issue of different fitness functions for GAs in relevance feedback, learning terms, weights and thresholds for a given query. Martin & Shackleton (2003) use a GA to address a different problem, namely term selection, thus a Boolean query is produced, rather than a list of terms with weights. GAs, unlike hill-climbers, allow global search solutions as crossover allows the algorithm to break out of the neighbourhood, but iteratively converges on a local search solution as the algorithm learns which of the neighbourhood solutions it has examined yield better results.
It should be emphasised that none of the GA methods use the two stage process described in this paper. The paradigm we use is known as attribute weighting (Rozsypal and Kubat, 2001). In addition to this, most of the research, apart from Boughanem et al (2002) and Tamine et al (2003) who use TREC data, deploy rather small test collections for their experiments, e.g., Cranfield. More information on the area can be found in the following review papers: Chen (1995), Sebastiani (2002) and MacFarlane & Tuson (2008).
MOTIVATION
The primary aim of the research in this paper is to investigate the use of genetic algorithms in the second stage selection process (described briefly above) and compare this with a hill-climber. A key question for us is therefore: do increasingly sophisticated local search techniques improve the term selection process? Our reasoning behind this strategy is that, whilst hill-climbing techniques have been successfully used in Okapi at TREC, techniques which are less likely to get stuck in local optima, like GAs, may be able to achieve better performance on this task (in terms of retrieval effectiveness). GAs are able to do this because of crossover (see above). GAs have previously been used before in this research area, but have not been used in the way that we propose here, namely a two level selection process for terms on which a limited set of terms are chosen and the weights of which are optimised. Furthermore, research using GAs has tended to use small collections; we propose the use of the much larger TREC collections used on the TREC Routing task.
DESCRIPTION OF THE SYSTEM
In this section we describe the system used for experimentation and its components, namely the Okapi information retrieval (IR) system, the genetic algorithm, and how these components were integrated to create the system.
Description of the Okapi System
terms using Boolean (e.g., and, or), Adjacency (e.g., adj) and term weighting (e.g., BM25) operations (Robertson, 1997).
Description of the Genetic Algorithm
Genetic algorithms have been shown to be robust and adaptive optimisers (Mitchell, 1999). GAs use the Darwinian process of natural selection on a number of candidate solutions to determine the optimum solution to a task. Mechanisms found in the natural world, such as fitness proportional selection and genetic variation of individuals, provide strong evolutionary pressure on a population to maximise the average quality of that population in its environment. Each individual in a population contains genetic information (a chromosome) encoding a potential solution to a problem. In this case, the chromosome held by each individual is an array of integers (see figure 1), whereby each position represents a word that could be included in the search, and each value in that position represents the weighting for that word in the search. Terms with a weight of 0 are excluded from the search, while terms with values between 1 and 7 are included in the Okapi query with a weight determined by 2n-4, n being the integer value between 0 and 7. We used this scheme to allow the GA a greater degree of freedom through the search space than the hill-climber in order to reduce the chance of the algorithm getting stuck in local optima.
Figure 1. Structure of a chromosome
The GA optimises the population of these chromosomes through a process of evolution as follows. In the first step of the algorithm, a finite sized population of chromosomes is initialised by randomly generating chromosomes. Each element of a chromosome is randomly assigned a weight of either 0 or 4 (a value of 4 in the chromosome results in that word being included in the search with default weight). This process is biased towards assigning a weight of 0 in an attempt to produce less complex queries – i.e., the aim was to keep the number of words included in the query to a minimum in order to promote efficiency, whilst maintaining accuracy of the result. In reality, approximately 1 in 10 words will be selected (i.e., have a weight greater than 0) at this initial stage.
added to an offspring population ready for the next iteration. This process continues until the offspring population is the same size as the parent population. A disadvantage with this reproduction mechanism alone is that it is possible that the highest fitness individual will not be selected for reproduction, implying any information it encoded is lost. One approach to solve this, employed in this research, is to always copy the highest fitness individual to the offspring population in each iteration. In this manner, the fitness of the best individual can never decrease from one generation to the next.
Figure 2. Optimisation algorithms used in experiments
In total, these steps comprise one iteration of a genetic algorithm; in this investigation the GA repeats these until either 100 iterations have occurred or the individual with the highest fitness in the population has not increased its own fitness for 5 iterations.
Integration of Okapi and the GA
The GA integrates with the Okapi system, and forms the entry point for the combined system. The GA initialises Okapi which returns the total number of available words that can be used in a query. The number of terms in the query determines the size of a chromosome, which the GA uses to randomly initialise its population. Fitness calculations are performed by passing each chromosome to the Okapi system for precision evaluation. Once a stopping criterion is met, the chromosome with the highest fitness is returned to Okapi and can be evaluated for quality.
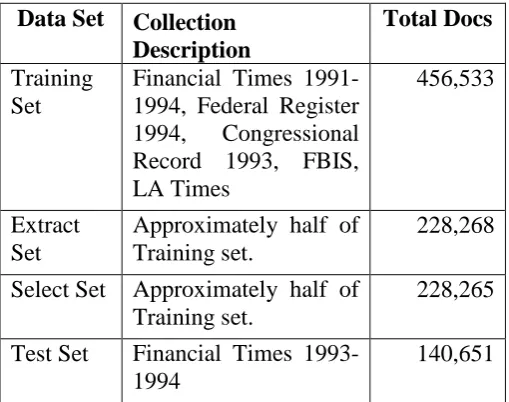
Table 1. The TREC 8 Routing collection
DESCRIPTION OF THE EXPERIMENT
Care needs to be taken when handling the training data for experiments. This is largely due to the problem of over-fitting (Robertson et al, 1996), which could occur, for example, if both stages of the selection process were done on the whole training set - e.g., there is a danger of selecting rare terms which may produce good results on the whole training set, but poor results otherwise. A number of different strategies can be used to overcome this problem. One way is to split the training set into two and use one set for extracting terms and the other set for evaluating the methods under consideration by selecting terms. The whole training set can then be used to produce the final query which is then applied to the test set (Robertson et al, 1996). This had a considerable influence on the testing strategy, although we used a slightly different methodology as described in MacFarlane et al (2003). We split the training set into two: one part was used for extracting terms from the document set for each topic (the extract set in table 1), while the second part (the select set in table 1) was used to optimise queries using terms from the first part. We did not use any further stages on the training data; the queries we produced on the 2nd stage were applied directly to the test set. Another way of splitting the collection would be to use an additional validation set (a three way split), and validate the query generated from the selection database for each topic with this – we did not use this method due to time constraints.
average precision measure. Significance tests are somewhat controversialin the field (MacFarlane and Tuson, 2008), therefore we used the standard percentage increase on average precision to measure difference i.e. 5% and 10% increases.
The initial GA runs were completed using the default values declared in table 2. For the hill-climbers in the experiment we used the add/remove operations with weight variation of 0.67, 1.0 and 1.5; the first weight to yield a positive result was accepted. Terms in the Hill-climbers were ‘dropped’ from the list if they did not increase scores in 4 iterations, and only re-examined after 10 iterations had passed. This approach speeds up the Hill-climbers and has shown to be of some benefit with respect to effectiveness (Robertson et al, 1996). We used two i686 Linux machines running Red Hat version 9 with 1 GB of main memory: one machine was a uni-processor (1.6 GhZ), one a dual-processor (1 GhZ). For each run we recorded the standard IR measures of precision and recall. Note that we did not record the effort made in terms of evaluations, as we have evidence from previous research that the number of evaluations carried out is not the primary driver of optimising queries i.e., examining more of the search space can be both beneficial and detrimental (MacFarlane, 2000).
ANALYSIS OF RESULTS
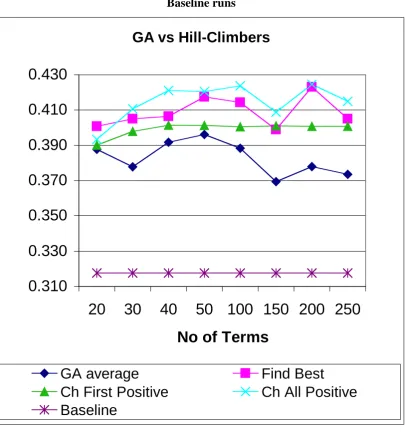
Figure 3. Initial experiments: Average Precision on GA, Hill-Climber and Baseline runs
Initial Runs and Comparison with Hill-Climbers
The average precision figures obtained are shown in figure 3, with the average over the GA runs being shown (details of the variation on the GA runs can be found in the appendix). Using average precision as a measure, the chart shows that both the best hill-climbers (0.425) and GA average (0.396) are much better than the baseline run (0.318). This corresponds to an increase of approximately 33% for the hill-climbers, and 23% for the best GA, both of which are above the 10% increase level.
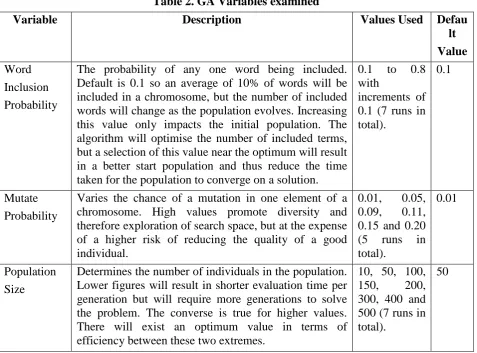
Table 2. GA Variables examined
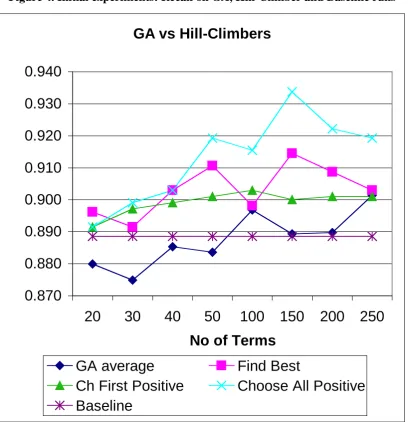
Figure 4. Initial experiments: Recall on GA, Hill-Climber and Baseline runs
Comparing the average precision results against the participants of the track which produced this data, is largely favourable (Hull and Robertson, 2000). In this track were 10 participants: the baseline did better than four runs (these systems are using much more sophisticated techniques than simple top 20 terms from relevance feedback), whilst the best hill-climber run (Choose All Positive) did better than seven runs. The best performing average GA (on 50 terms), did better than five runs.
With respect to recall (see figure 4 – variation on this measure can been seen in the appendix), the hill-climber runs are all above the baseline - the best run (150 terms on Choose All Positive) yielding a 5% increase over the baseline. The average GA runs yield a noticeable increase in recall (over the baseline) only on two occasions - at 100 and 250 terms. Otherwise, recall is below or very near the baseline on all term sets. Comparing the worst average GA run on 30 terms with the baseline, there is less than 1% difference. The evidence provided here suggests that using any of the query optimisation techniques put forward in this paper provides an increase in precision without adversely affecting recall. These techniques are stable on the recall metric i.e., recall is not adversely affected.
Results for variation of GA Variables
Given the results in our initial experiments, we decided to observe the effect of modifying a number of the GA’s variables with the goal of increasing the quality of the term selection process.
Experiments for Word Inclusion Probability
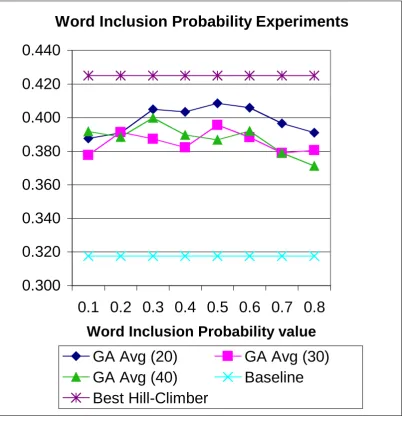
With respect to average precision, runs are all above 10% over the baseline (the lowest average run 0.8 on 40 is 17% better than the baseline), however at no point do any of the runs reach the level achieved by the best hill-climber. There is very little difference between the runs on this variable. On average, runs using 20 terms are better than either runs on 30/40 terms, but most of these record less than 5% difference over the baseline. As this variable only affects the initial population, the evidence provided in figure 5 clearly indicates that the GA is not sensitive to starting conditions (i.e., the number of words included in each initial chromosome) cause by this variable.
Figure 5. Word Inclusion Probability experiments: Average Precision on GA versus baseline and best Hill-Climber run
This is a very desirable property for a GA on term selection - as an elitist GA is being used with average precision as the fitness function, the expected result would be either a slight increase or the same result for average precision. If a higher word inclusion probability has a lower initial precision score, then the precision must increase more (for that word inclusion probability value) in order for the final precision to be similar to the final precision achieved by a lower word inclusion probability value (which starts with a higher initial precision score). The increase is not caused by the word inclusion probability value however, and is a result of the GA itself. Word inclusion probability only affects the initial iteration, not subsequent ones. A higher word inclusion probability value could mean that more terms will be included in a query, and therefore more documents will be retrieved before ranking.
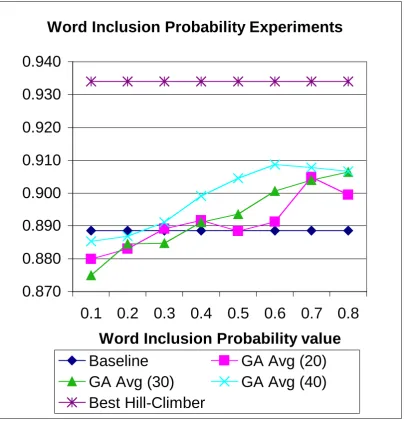
inclusion probability implies more terms, increasing coverage of relevant documents retrieved, implying a higher initial recall. As the mutation rate will remain constant across the different experiments, the amount of change will remain roughly the same regardless of the word inclusion probability, and so if a run has a better starting point (with respect to recall) – as a result of a higher word inclusion probability – then this will retain it’s higher recall as the iterations progress.
Figure 6. Word Inclusion Probability experiments: Recall on GA versus baseline and best Hill-Climber run
With respect to recall, it is possible that there is an important interaction between the Word Inclusion Probability and Mutate Probability variables. Lower rates of probability for including words will produce a “narrower” starting query (the implication being that recall will be lower) and a large number of iterations would do little to improve performance. For example, on 100 iterations, the default mutation rate of 0.01 on 40 terms produces an average of 0.4 mutations per iteration. If the mutation rate is increased too much, the increased amount of change on a chromosome in any iteration will detract from improvements in recall – the search will effectively become random. From figure 7, it can be seen that the average recall using 40 terms increases with Mutate Probability values to 0.11 then decreases, with a similar trend on 20 terms, increasing up to 0.15 mutation rate, before decreasing. It is expected that a higher (rather than the default) mutation rate with a higher rate of Word Inclusion Probability will offer better recall (due to time constraints we were unable to examine this issue further – this will be examined in further research).
Experiments for Mutate Probability
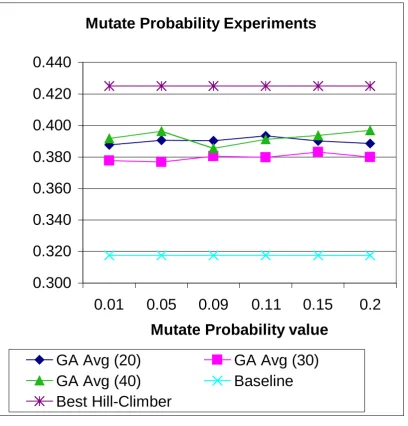
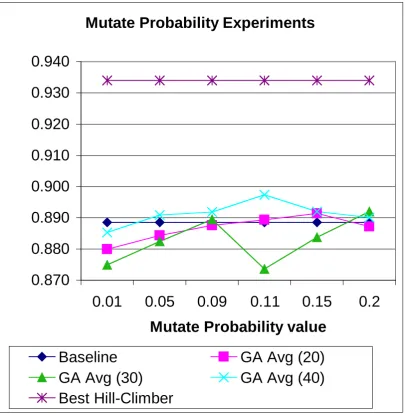
With respect to the probability of mutation, the average precision in all cases appears to be better than the baseline (see figure 7). On average, these are much better than the baseline (e.g., on 30 terms the average increase over the baseline is 22/23% for values of Mutate Probability). However, no GA matches the best hill-climber run. There is very little variation on the value of MutateProbability or its interaction with term set size. The results presented in figure 7 also fit in with the results for the Word Inclusion Probability experiments – this had little impact over the precision on the individual sizes tested. A higher word inclusion probability means more included words at the start. The best precision cannot decrease over iterations, as we are using an elitist GA, therefore the precision remains constant with small changes in mutation rate. It is probable that a higher figure for the probability of mutation (e.g., 0.8) would reduce performance as it is likely any useful term information would be destroyed, resulting in the GA approximating to a random search. The recall results (see figure 8) show small variations around the baseline.
Figure 7. Mutate Probability experiments: Average precision on GA versus baseline and best Hill-Climber run
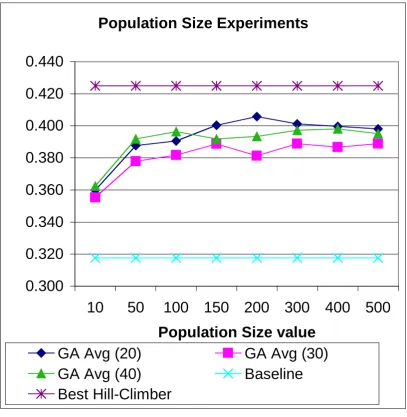
Figure 9. Population Size experiments: Average precision on GA versus baseline and best Hill-Climber run
Figure 10. Population Size experiments: Recall on GA versus baseline and best Hill-Climber run
Experiments for Population Size
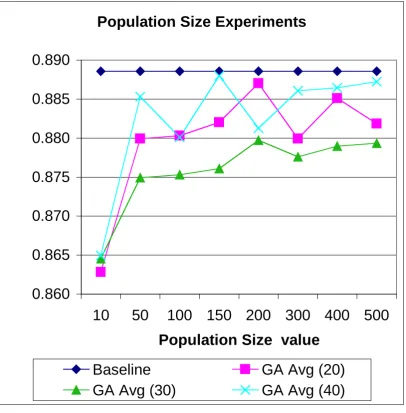
In terms of average precision it does seem beneficial to use a Population Size of 100 or over (see figure 9). The increase from 10 to 100 on this variable for 40 terms results in a precision increase of 9.3%, on average. With respect to recall there is a slight upwards trend (all below the 5% level), but a smaller population (below 50) does appear to be detrimental, particularly on the minimum runs (see figure 10). This phenomenon is probably related to the low mutation rate used. The default mutation rate of 0.01 on 20 terms means 0.2 words mutated per individual per iteration, and only 2 words for a population of 10 individuals per iteration. Increasing the Population Size to 100 means 20 words modified per iteration (all averages). The larger the population size the more diverse the population so a moderate to large size results in better performance. With a small population the algorithm cannot adequately cover the search space at the beginning and the range of genetic material is not adequate enough to increase fitness in an efficient manner.
Results for variation of Algorithm, Elistism and Crossover strategies
Figure 11 Roulette Wheel vs Best Hill-Climber runs
Figure 12 – Rank Selection vs Best Hill-Climber runs
reasonably equal chance of selection (i.e. approx 1/20). In Rank selection however, the differences would be exaggerated so, in order, the lowest would have a 1/15 chance of selection, the next 2/15, the next 3/15, then 4/15, then 5/15. Therefore a slightly better solution has more chance of being chosen.
Comparing hill-climbing results to GA Rank Selection results also yields some interesting results. When optimizing on 20 terms, all Rank Selection runs are better than the best hill-climber run. However none match the hill-climber after 30 terms, with a number of runs virtually identical. Difference between these runs are small however – all bar two runs on 40 terms are below the 5% increase mark. This together with the clear trend upwards for hill-climbing methods points to the nature of the term selection process used e.g. evidence from the initial term selection process when using the Term Selection Value to rank terms (Robertson, 1990). This ranking mechanism has shown to be useful providing a sufficiently large number of relevance assessments are provided (Robertson et al, 1995). Therefore the hill-climber will be moving in a space which is known to be generally good anyway, and the results from figure 3 which show there is very little gain after runs optimizing on 40 terms provide some further evidence. Although all optimized runs used the top 3 terms from the ranked list, after this initialization the GA’s throw this evidence away and start from scratch. Prior evidence based on the term selection value would appear to provide an advantage to any method that can exploit it.
When comparing Elitist vs non-Elitist strategies and crossover methods (uniform, 1 and 2 point) in figures 11 and 12, there does not appear to be much of a difference between them, as all are within the 5% mark. The results on elitist approaches are perhaps counterintuitive; as they keep the best performing chromosome from one generation to the next, allowing successive improvement in much the same way as the hill-climber, it would be expected that the elitist approach would yield an improved precision over the non-elitist strategy. This implies that the mutation/crossover strategies cause very little variation/improvement in the population's overall fitness in successive generations, and evidence from figure 7 above does in fact show that that mutation probability has little effect on the average precision (i.e. the fitness). This lack of variation in the population may well support the advantage which the Rank Selection method has over Roulette Wheel, explained above. A further factor could be that non-elitist strategies used more iterations to achieve the same result, although confirming this would require analysis of iterations (we did not collect this information in the experiments).
DISCUSSION AND CONCLUSION
Whilst it is clear that using GA’s on the term selection problem addressed in this paper can improve performance in terms of average precision over the baseline, it is also clear that there is no guarantee of success in using such a method. Even though the worst average GA run can provide a performance which was much better than the baseline, there is no evidence that the GA on average is better than the various hill-climbing algorithms used here. In fact, the evidence is to the contrary. Both the hill-climber algorithms and the GA appear to be able to improve precision over the baseline without reducing recall.
tried, for example the amount of chromosome that swaps during crossover, with the aim of making the GA more competitive compared to the hill-climber. Further experiments were conducted, comparing selection strategies (Roulette Wheel vs. Rank selection), elitist vs non-elitist and varying crossover (uniform, 1 point and 2 point). Although the Rank Selection method did better than Roulette Wheel, it did not match the hill-climber on the larger term sets used – although differences were small for most runs. No real difference was found on elitist vs. non-elitist strategies or crossover variation. Evidence from the Term Selection Value used by the hill-climber to rank terms would appear to give it something of an advantage on optimization problems of this type.
This paper presents the first real attempt to compare the performance of GA’s against hill-climbers directly on an IR problem of this type. We had hypothesised that GAs should not get stuck in local optima so readily and would therefore have better performance. However, on the evidence provided in this paper, it appears that being stuck in local optima is not such a problem for hill-climbers as these methods consistently out-performed a GA. The ability of the hill-climber to use term rank order would appear to provide the method with something of an advantage when moving through the search space. The GA, which finds other optima, does on average appear to find many more peaks, which are superior to the baseline (e.g., see figure 3) but may not on average be as good as the single hill-climber peak. Further research could include the comparison of other stochastic searches such as Artificial Immune Systems (AIS), Particle Swarm Optimisation (PSO), Ant Colony Optimisation (ACO) in order to verify these results.
ACKNOWLEDGMENTS
The authors gratefully acknowledge travel funding from the ARTIST network. The authors are grateful to Alex Freitas for his input, and to Steve Robertson for suggesting the term re-weighting scheme that is used in this paper.
REFERENCES
Beaulieu, M. Gatford, M, Huang, X., Robertson, S, Walker, S. and Williams P. (1997). Okapi at TREC-5, In: Voorhees, E. and Harman, D (eds). Proceedings of the Fifth Text Retrieval Conference, Gaithersburg, November 1996, NIST SP 500-238, pp143-166.
Boughanem, M. Chrisment, C., and Tamine, L, (2002). On using Genetic Algorithms for Multimodel relevance optimisation in information retrieval, Journal of the American Society for Information Science and Technology, 53(11), 934-942.
Chang, Y., and Chen, S. (2006). A new query reweighting method for document retrieval based on genetic algorithms. IEEE Transactions on Evolutionary Computation, 10(5), pp617-622.
Chen, H, Shankaranarayanan, G. and She, L. (1998). A machine learning approach to inductive query by examples: an experiment using relevance feedback, ID3, genetic algorithsm and simulated annealing. Journal of the American Society for Information Science and Technology, 49(8), pp693-705.
Fan, W., Gordon, M. D., & Pathak, P. (2004). A generic ranking function discovery framework by genetic programming for information retrieval. Information Processing and Management, 40(4), pp587– 602.
Goldberg, D. E. (1989). "Genetic Algorithms in Search, Optimization, and Machine Learning." Addison-Wesley.
Harman, D. (1992). Relevance Feedback and other Query Modification Techniques, In: Frakes, W. and Baeza-Yates, ‘Information Retrieval: Data Structures and Algorithms’, Prentice-Hall, pp241-263.
Harman, D., Fox, E, Yates, R. and Lee, W. (1992). Inverted Files, In: Frakes, W. and Baeza-Yates, ‘Information Retrieval: Data Structures and Algorithms’, Prentice-Hall, pp28-43.
Horng, J., and Yeh, C. (2000). Applying genetic algorithms to query optimization in document retrieval, Information Processing and Management, 36(5), pp737-759.
Hull, D. and Robertson, S. (2000). The TREC-8 Filtering Track Final Report. In: Voorhees and Harman, D (eds). Proceedings of the Eighth Text Retrieval Conference, Gaithersburg, November 1999, NIST SP 500-246, pp35-55.
Lopez-Pujalte, C., Guerrero Bote, V. and de Moy Anegon. (2002). A test of genetic algorithms in relevance feedback, Information Processing and Management 38 (6), pp793-805.
Lopez-Pujalte, C., Guerrero Bote, V. and de Moy Anegon. (2003a). Genetic algorithms in relevance feedback: a second test and new contributions, Information Processing and Management 39(5), pp669-687.
Lopez-Pujalte, C., Guerrero Bote, V. and de Moy Anegon. (2003b). Order-Based fitness functions for Genetic Algorithms applied to relevance feedback, Journal of the American Society for Information Science and Technology, 54(2), pp152-160.
MacFarlane, A., Robertson, S, and McCann, J. (2003). Parallel Computing for Term Selection in Routing/Filtering, In: Sebastiani, F (ed), Proceeding of the 25th European Conference on IR Research, ECIR 2003, Pisa Italy, LNCS 2633, Springer-Verlag, pp537-545.
MacFarlane, A., and Tuson, A. (2008). Local search: A guide for the information retrieval practitioner, Information Processing and Management, 45(1), pp 159–174
Martin-Bautista, M.J., Vila, M.A., and Larsen, H.L. (1999). A fuzzy genetic algorithm approach to an adaptive information retrieval agent, Journal of the American Society for Information Science, 50(9), p760-771.
Martin J. and Shackleton, M. (2003). Investigation of the importance of the genotype-phenotype mapping in information retrieval, Future Generation Computer Systems 19(1), pp55-68.
Mitchell, M. (1999). "An Introduction to Genetic Algorithms", MIT Press. 6th edition.
Robertson, A., and Willett, P. (1996). An upperbound to the performance of ranked-output searching: optimal weighting of query terms using a genetic algorithm, Journal of Documentation, 52(4), pp405-420.
Robertson, S., and Sparck-Jones, K. (1976). Relevance weighting of search terms, Journal of the American Society Information Science, 27, pp129-146.
Robertson, S. (1990). On term selection for query expansion, documentation note. Journal of Documentation, 46 (4), pp359-364.
Robertson, S. (1997). Overview of the Okapi projects: special issue, Journal of Documentation, 53 (1), pp3-7.
Robertson, S, Walker, S., Jones, S., Hancock- Beaulieu, M., and Gatford, M. (1995), Okapi at TREC-3, In: Harman, D (ed). Proceedings of the Third Text Retrieval Conference, Gaithersburg, November 1994, NIST SP 500-226, pp 109-126.
Robertson, S., Walker, S., and Hancock- Beaulieu, M. (1995). Large test collection experiments on an operational interactive system: Okapi at TREC. Information processing and Management, 31(3), pp345-360.
Rozsypal, A., & Kubat, M. (2001). Using the Genetic Algorithm to Reduce the Size of a Nearest-Neighbour Classifier and to Select Relevant Attributes. 18th International Conference on Machine Learning (ICML 2001), Massachusetts, USA. Morgan Kaufmann, pp. 449-45.
Sebastiani, F. (2002). Machine learning in Automated Text Categorization, ACM Computing Surveys, 34(1), pp1-47.
Tamine, L, Chrisment, C., and Boughanem, M. (2003). Multiple query evaluation based on enhanced genetic algorithm, Information Processing and Management 39(2), pp21-231.
Tuson, A. (1998). Optimisation with Hillclimbing on Steroids: An Overview of Neighbourhood Search Techniques. In the Keynote Papers of the 10th Young OR Conference, Operational Research Society.
Vrajitoru, D. (1998). Crossover improvement for the genetic algorithm in information retrieval.
Information Processing and Management, 34 (4), 405-415.
Walker, S., Robertson, S, and Boughanem, M. (1998). Okapi at TREC-6: automatic ad hoc, VLC, routing and filtering. In: Voorhees, E. and Harman, D (eds). Proceedings of the Fifth Text Retrieval Conference, Gaithersburg, November 1996, NIST SP 500-240, pp125-136.
Appendix – Run variation data for the Genetic Algorithm on Initial Runs
Figure A1. Box Plot data for average precision in initial GA runs
Figure 1. Structure of a chromosome
Individual
=
Figure 2. Optimisation algorithms used in experiments
1) Randomly initialise population 2) While stopping criterion not met, do:
a. Calculate fitness of all population members using average precision as fitness metric.
b. Create a new individual with a chromosome identical to the fittest individual in the current population and place in the (currently empty) offspring population.
c. While size of offspring population does not equal size of current population, do:
i. Choose two individuals probabilistically based on their fitness
ii. Swap genetic material between these two parent individuals to create two child individuals (using fixed rate probability)
iii. Mutate both child individuals (using fixed rate probability)
iv. Place child individuals in the offspring population
d. Replace current population with offspring population.
Figure 2a = GA psedocode
Load term pool
Generate base and evaluation term sets Obtain relevance information for a topic Form accumulated set from base set Loop while no stopping criteria is reached Loop list of terms in evaluation set Evaluate an operation on the current term If operation is successful
If algorithm is CAP Add current term to query If algorithm is FB
Record current term as best term. If algorithm is CFP
Leave inner loop EndLoop
If algorithm is FB or CFP Update query with best term Check the stopping criteria Endloop
Table 1. The TREC 8 Routing collection
Data Set Collection Description
Total Docs
Training Set
Financial Times 1991-1994, Federal Register 1994, Congressional Record 1993, FBIS, LA Times
456,533
Extract Set
Approximately half of Training set.
228,268
Select Set Approximately half of Training set.
228,265
Test Set Financial Times 1993-1994
Figure 3. Initial experiments: Average Precision on GA, Hill-Climber and Baseline runs
GA vs Hill-Climbers
0.310
0.330
0.350
0.370
0.390
0.410
0.430
20
30
40
50 100 150 200 250
No of Terms
GA average
Find Best
Ch First Positive
Ch All Positive
Table 2. GA Variables examined
Variable Description Values Used Defau lt Value
Word
Inclusion
Probability
The probability of any one word being included. Default is 0.1 so an average of 10% of words will be included in a chromosome, but the number of included words will change as the population evolves. Increasing this value only impacts the initial population. The algorithm will optimise the number of included terms, but a selection of this value near the optimum will result in a better start population and thus reduce the time taken for the population to converge on a solution.
0.1 to 0.8 with
increments of 0.1 (7 runs in total).
0.1
Mutate
Probability
Varies the chance of a mutation in one element of a chromosome. High values promote diversity and therefore exploration of search space, but at the expense of a higher risk of reducing the quality of a good individual.
0.01, 0.05, 0.09, 0.11, 0.15 and 0.20 (5 runs in total).
0.01
Population Size
Determines the number of individuals in the population. Lower figures will result in shorter evaluation time per generation but will require more generations to solve the problem. The converse is true for higher values. There will exist an optimum value in terms of efficiency between these two extremes.
10, 50, 100, 150, 200, 300, 400 and 500 (7 runs in total).
Figure 4. Initial experiments: Recall on GA, Hill-Climber and Baseline runs
GA vs Hill-Climbers
0.870
0.880
0.890
0.900
0.910
0.920
0.930
0.940
20
30
40
50
100
150
200
250
No of Terms
GA average
Find Best
Ch First Positive
Choose All Positive
Figure 5. Word Inclusion Probability experiments: Average Precision on GA versus baseline and best Hill-Climber run
Word Inclusion Probability Experiments
0.300
0.320
0.340
0.360
0.380
0.400
0.420
0.440
0.1 0.2 0.3 0.4 0.5 0.6 0.7 0.8
Word Inclusion Probability value
GA Avg (20)
GA Avg (30)
GA Avg (40)
Baseline
Figure 6. Word Inclusion Probability experiments: Recall on GA versus baseline and best Hill-Climber run
Word Inclusion Probability Experiments
0.870
0.880
0.890
0.900
0.910
0.920
0.930
0.940
0.1
0.2
0.3
0.4
0.5
0.6
0.7
0.8
Word Inclusion Probability value
Baseline
GA Avg (20)
GA Avg (30)
GA Avg (40)
Figure 7. Mutate Probability experiments: Average precision on GA versus baseline and best Hill-Climber run
Mutate Probability Experiments
0.300
0.320
0.340
0.360
0.380
0.400
0.420
0.440
0.01
0.05
0.09
0.11
0.15
0.2
Mutate Probability value
GA Avg (20)
GA Avg (30)
GA Avg (40)
Baseline
Figure 8. Mutate Probability experiments: Recall on GA versus baseline and best Hill-Climber run
Mutate Probability Experiments
0.870
0.880
0.890
0.900
0.910
0.920
0.930
0.940
0.01
0.05
0.09
0.11
0.15
0.2
Mutate Probability value
Baseline
GA Avg (20)
GA Avg (30)
GA Avg (40)
Figure 9. Population Size experiments: Average precision on GA versus baseline and best Hill-Climber run
Population Size Experiments
0.300
0.320
0.340
0.360
0.380
0.400
0.420
0.440
10
50
100
150
200
300
400
500
Population Size value
GA Avg (20)
GA Avg (30)
GA Avg (40)
Baseline
Figure 10. Population Size experiments: Recall on GA versus baseline and best Hill-Climber run
Population Size Experiments
0.860
0.865
0.870
0.875
0.880
0.885
0.890
10
50
100
150 200
300 400
500
Population Size value
Baseline
GA Avg (20)
Figure A1. Box Plot data for average precision in initial GA runs
Average precision variation data
0.320 0.330 0.340 0.350 0.360 0.370 0.380 0.390 0.400 0.410 0.420
20 30 40 50 100 150 200 250
Terms
q1 min median max q3
Figure A2. Box Plot data for Recall in initial GA runs
Recall variation data
0.860 0.870 0.880 0.890 0.900 0.910 0.920
20 30 40 50 100 150 200 250
Terms
[image:32.595.90.526.371.576.2]