International Journal of Emerging Technology and Advanced Engineering
Website: www.ijetae.com (ISSN 2250-2459, ISO 9001:2008 Certified Journal, Volume 6, Issue 4, April 2016)
94
Implementation of an Efficient and Accurate Software
Bug Prediction System
Surbhi Parnerkar
1, Ati Jain
2, Preetesh Purohit
31Student, 2Assistant Professor, Department of Computer Science and Engineering, SVCE Indore, India
3Head, Department of Computer Science and Engineering, SVCE Indore, India
Abstract— The main aim of the software engineering process model is to understand the real world problem and to design and develop a good quality software solution. Traditionally for quality assessment and improvements of software solutions, testing is performed where a number of test cases are designed and executed for tracking bugs and errors. But this effort is a cost and effort effective process of QoS. Therefore to reduce the efforts and cost of the quality solution the bug prediction modules are implemented. These models help to predict the future occurrence of bugs in the software code lines. Therefore it is an essential aspect of software engineering processes these days. In this presented work a software bug prediction model is introduced. The model is a supervised learning model which first trained over the previously occurred bugs and then it predicts the bugs according to the recent trends. The entire modeling of the system is defined here in three main phases first the pre-processing and feature selection, second the model training and final the prediction and performance assessment. During the initial phases the effort is made to improve the quality of training dataset and then using KPCA algorithm the optimum features of the training set are extracted. These features are in future used with the BPN (back propagation neural network) to take the training and then test set is applied on the trained data model for prediction of bugs. The implementation of the proposed concept is provided using JAVA technology and their performance is estimated. The performance of the implemented system is evaluated in terms of memory consumption, time consumption, accuracy and error rate. The experimental results show the effectiveness of the proposed technique over the traditional Bayesian classifier’s performance.
Keywords—software engineering, code analysis, bug tracking, bug prediction, testing.
I. INTRODUCTION
Software engineering is a set of processes involved for developing the real world solutions. These solutions have made our lifestyle easy and have also being used for providing various kinds of services online and offline. Software engineering is a group of processes involved to understand the requirement, design the concept of solution, and implement using the tools and techniques and test for quality improvements.
Each of the step in process model produces impact on the quality of software thus in individual phases a significant amount of hard word is required. In addition of that the implementation phase in process model has a less amount of time for proper implementation, thus the technical assistance about the bugs and future errors are required to predict for fast and quality solution development in less amount of time.
The bug prediction helps a software programmer to write the code in correct manner. Additionally it provides support to approximate the type of error and bugs occurred during implementation. In this presented work the software bug prediction models are investigated in detail. Additionally a new method for predicting the accurate bug during code writing is also proposed. Basically the bugs in code blocks occur due to number reasons such as the environment, version of development tools and other similar attributes. Thus the accurate bug prediction is a task of data analysis or code analysis. Therefore in this work the bug prediction is treated as the data mining problem where the predictive models are taking training from previous patterns of data and tries to predict the new trends about the data.
Software engineering technology is used for producing the solutions for the real world problems. Therefore it is required to develop solutions with high reliability and which are bug free. Thus testing is an essential domain of software engineering where the entire developed solutions are cross verified and tested for solution quality improvements. But writing the test cases and execute them are a complex and exhaustive task. Therefore during implementation the bug prediction modules are developed to predict the bugs and errors on code lines. But the prediction is a task of machine learning and data mining therefore the entire effort of the study is made on developing the data mining based prediction system.
International Journal of Emerging Technology and Advanced Engineering
Website: www.ijetae.com (ISSN 2250-2459, ISO 9001:2008 Certified Journal, Volume 6, Issue 4, April 2016)
95 For predicting the bugs in software systems the old bug patterns are used with the machine learning algorithms to train algorithms and then use them to predict the similar patterns of bugs. In literature a number of research efforts are available which are predicting the bugs for the training and testing most of them are usages the eclipse dataset. Thus in orders to accurately classify the datasets the following issues are found.
a. Dimensions of dataset
b. Accurate classification and prediction
Therefore the key focus of the proposed work is placed on the dataset quality improvement and feature extraction using KPCA (kernel principal component analysis) and for learning and prediction the back-propagation algorithm is used. This section provides the formal overview of the proposed concept for performance improvement of the eclipse dataset [2] classification.
II. RELATED WORK
The given section introduces the different techniques and methods that are recently developed for improving the
quality of prediction in software engineering technologies
.
A new Support Vector based Fuzzy Classification System (SVFCS) [3] proposed for defective module prediction. In this model a set of rules is constructed using Fuzzy logic and support vectors. And for rule optimization Genetic algorithm is used. Additionally the method compared with two other models namely Naive Bayes and Support Vector Machine by precision and probability of detection. It is found that the performance of SVFCS approach is generally better than other approaches. In the similar direction for improving the performance of fault prediction model, another paper [4] discusses a new model towards reliability and quality improvement of software systems by predicting fault-prone module before testing. Model usage classification techniques of data mining and stored knowledge in software metrics to classify the software fault-prone or not thus a decision tree (ID3 algorithm) is used for the purpose of decision making.
The modification over decision tree is also made by converting information gain into fuzzy rules to predict faults on software modules. The goal is to help and reduce testing efforts in order to improve the reliability and quality of software. Software metrics may be used in fault prediction models to improve software quality by predicting fault location [5]. The aim is to identify software metrics and to assess their applicability in software fault prediction.
They investigated the influence of context on metrics’ selection and performance. This systematic literature review includes 106 papers published between 1991 and 2011. The selected papers are classified according to metrics and context properties. Object-oriented metrics (49%) were used nearly twice as often compared to traditional source code metrics (27%) or process metrics (24%). Chidamber and Kemerer’s (CK) object-oriented metrics were most frequently used. According to the selected studies there are significant differences between the metrics used in fault prediction performance. Object-oriented and process metrics have been reported to be more successful in finding faults compared to traditional size and complexity metrics. Process metrics seem to be better at predicting post-release faults compared to any static code metrics. More studies should be performed on large industrial software systems to find metrics more relevant for the industry and to answer the question as to which metrics should be used in a given context.
Software testing is a crucial activity during software
development and fault prediction models assist
International Journal of Emerging Technology and Advanced Engineering
Website: www.ijetae.com (ISSN 2250-2459, ISO 9001:2008 Certified Journal, Volume 6, Issue 4, April 2016)
96 First, the authors constructed software dependency networks regarding five dependency scenes at the class-level granularity. Second, they used a set of nine representative and commonly used metrics—namely, centrality, degree, PageRank, and HITS, as well as modularity—to quantify the importance of each class. Third, authors identified how these metrics were related to the proneness and severity of fixed bugs in Tomcat and Ant and determined the extent to which they were related. Finally, the significant metrics were considered as predictors for bug proneness and severity. The result suggests that there is a statistically significant relationship between class’s importance and bug prediction. Furthermore, between-ness centrality and out-degree metric yield an impressive accuracy for bug prediction and test prioritization. The best accuracy of prediction or bug proneness and bug severity is up to 54.7% and 66.7% (top 50, Tomcat) and 63.8% and 48.7% (top 100, Ant), respectively, within these two cases.
In a manual examination of more than 7,000 issue reports from the bug databases of five open-source projects, it was found that 33.8% of all bug reports to be misclassified—that is, rather than referring to a code fix, they resulted in a new feature, an update to documentation, or an internal refactoring. This misclassification [8] introduces bias in bug prediction models, confusing bugs and features: On average, 39% of files marked as defective actually never had a bug. They discuss the impact of this misclassification on earlier studies and recommend manual data validation for future studies.
There have been many bug prediction models built with historical metrics, which are mined from version histories of software modules. Many studies have reported the effectiveness of these historical metrics. For prediction levels, most studies have targeted package and file levels. Prediction on a fine-grained level, which represents the method level, is required because there may be interesting results compared to coarse-grained (package and file levels) prediction. These results include good performance when considering quality assurance efforts, and new findings about the correlations between bugs and histories. However, fine-grained prediction has been a challenge because obtaining method histories from existing version control systems is a difficult problem. To tackle this problem, a fine-grained version control system for Java, Historage has been developed [9]. With this system, they target Java software and conduct fine-grained prediction with well-known historical metrics. The results indicate that fine-grained (method-level) prediction outperforms coarse-grained (package and file levels) prediction when taking the efforts necessary to find bugs into account.
Using a correlation analysis, authors show that past bug information does not contribute to method-level bug prediction.
Machine learning techniques can be used to analyze data from different perspectives and enable developers to retrieve useful information. Machine learning techniques are proven to be useful in terms of software bug prediction. In this paper [10], a comparative performance analysis of different machine learning techniques is explored for software bug prediction on public available data sets. Results showed most of the machine learning methods performed well on software bug datasets.
Bug fixing is a time-consuming and costly job which is performed in the whole life cycle of software development and maintenance. For many systems, bugs are managed in bug management systems such as Bugzilla. Generally, the status of a typical bug report in Bugzilla changes from new to assigned, verified and closed. However, some bugs have to be reopened. Reopened bugs increase the software development and maintenance cost, increase the workload of bug fixers, and might even delay the future delivery of software. Only a few studies investigate the phenomenon of reopened bug reports. In this paper [11], they evaluate the effectiveness of various supervised learning algorithms to predict if a bug report would be reopened. They choose 7 state-of-the-art classical supervised learning algorithm in
machine learning literature, i.e., kNN, SVM,
SimpleLogistic, Bayesian Network, Decision Table, CART and LWL, and 3 ensemble learning algorithms, i.e., AdaBoost, Bagging and Random Forest, and evaluate their performance in predicting reopened bug reports. The experiment results show that among the 10 algorithms, Bagging and Decision Table (IDTM) achieve the best performance. They achieve accuracy scores of 92.91% and 92.80%, respectively, and reopened bug reports F-Measure scores of 0.735 and 0.732, respectively. These results improve the reopened bug reports F-Measure of the stateof-the-art approaches up to 23.53%.
International Journal of Emerging Technology and Advanced Engineering
Website: www.ijetae.com (ISSN 2250-2459, ISO 9001:2008 Certified Journal, Volume 6, Issue 4, April 2016)
97 In addition, we compared the two-phase model with three other prediction models: the Usual Suspects, the one-phase model, and BugScout. The two-one-phase model manifests the best prediction performance.
Software bug is a buzz word now a day. A software bug has many attributes, some of which are filled at the time of reporting and others are filled during the process of fixing. Some attributes are qualitative in nature but some are quantitative. A clear understanding of bug attributes, their interdependence and their contribution in predicting the other attributes will help in improving the quality of software. In the literature, prediction models based on linear regression have been proposed to predict the bug attributes and to determine their linear relationships. Cc list (manpower involved in monitoring the progress of bug fix) is an important bug attribute for which no prediction model has been developed in literature. The paper [26] investigates the contribution of bug attributes in predicting the bug cc list i.e. the manpower involved in monitoring the progress of bug fix based on multiple linear regression (MLR), support vector regression (SVR) and fuzzy linear regression (FLR). We conducted the experiments to develop prediction models for 21,424 bug reports of Firefox, Thunderbird, Seamonkey, Boot2Gecko, Add-on SDK, Bugzilla, Webtools and addons.mozilla.org products of the Mozilla open source project. They have also investigated a linear relation among bug attributes. The empirical results conclude that the value of R2 in predicting cc list across all datasets lies in the range of 0.31 to 0.70, 0.54 to 0.88, 0.25 to 0.68 and 0.69 to 0.93 for multiple linear regression, support vector regression, fuzzy linear regression(robust off) and fuzzy linear regression (robust bisquare) respectively.
"An ounce of prevention is worth a pound of cure." In software, these expressions translate into the common observation that the longer a defect stays in process, the more expensive it is to fix. Moreover software defects are expensive and time consuming. The cost of finding and correcting defects represents one of the most expensive software development activities. And that too, if the errors get carried away till the final acceptance testing stage of the project life cycle, then the project is at a greater risk in terms of its Time and Cost factors. A small amount of effort spent on quality assurance will see good amount of cost savings in terms of detecting and eliminating the defects. To gain a deeper understanding of the effectiveness of the software process, it is essential to examine the details of defects detected in the past projects and to study how the same can be eliminated due to process improvements and newer methodologies.
This work [14] will focus on finding the total number of defects that has occurred in the software development process for five similar projects and aims at classifying various defects using first level of Orthogonal Defect Classification (ODC), finding root causes of the defects and use the learning of the projects as preventive ideas. They also showcases on how the preventive ideas are implemented in a new set of projects resulting in the reduction of the number of similar defects.
III. PROPOSED WORK
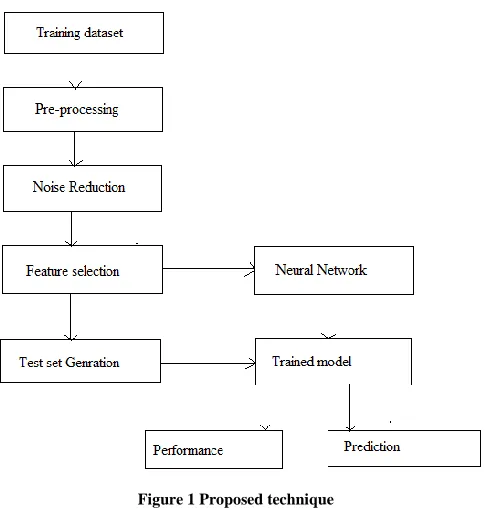
[image:4.612.326.570.326.581.2]The proposed model [15] for software bug prediction is described in the figure 1. The proposed data model is a data mining based supervised learning model which works in two modules training and testing. Both the modules are demonstrated in the same figure.
Figure 1 Proposed technique
Input training data: The data mining algorithms can be
International Journal of Emerging Technology and Advanced Engineering
Website: www.ijetae.com (ISSN 2250-2459, ISO 9001:2008 Certified Journal, Volume 6, Issue 4, April 2016)
98 Eclipse dataset: The bug prediction dataset is a collection of models and metrics of software systems and their histories. The goal of such a dataset is to allow people to compare different bug prediction approaches and to evaluate whether a new technique is an improvement over existing ones. In particular, the dataset contains the data needed to:
1. Run a prediction technique based on source code
metrics and/or historical measures and/or process information.
2. Compute the performance of the prediction by
comparing its results with an oracle set, i.e., the number post release defects reported in bug tracking system.
The dataset is designed to perform bug prediction at the class level. However package or subsystem information can be derived by aggregating class data, since per each class it is specified the package that contains it.
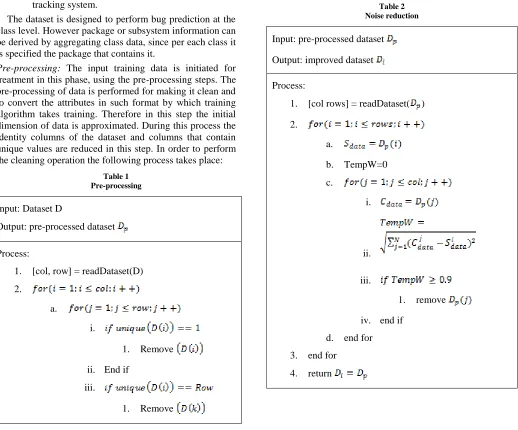
Pre-processing: The input training data is initiated for
treatment in this phase, using the pre-processing steps. The pre-processing of data is performed for making it clean and to convert the attributes in such format by which training algorithm takes training. Therefore in this step the initial dimension of data is approximated. During this process the identity columns of the dataset and columns that contain unique values are reduced in this step. In order to perform the cleaning operation the following process takes place:
Table 1 Pre-processing
Input: Dataset D
Output: pre-processed dataset
Process:
1. [col, row] = readDataset(D)
2.
a.
i.
1. Remove
ii. End if
iii.
1. Remove
iv. End if
b. End for
3. End for
4. Return
Noise reduction: The size of dataset is significantly large
[image:5.612.52.570.288.718.2]thus noisy content can occur in the dataset. Thus there is a need to refine dataset for finding good quality of dataset for learning. Therefore in this step the duplicate rows of the data are removed from the dataset. In order to perform such a process the following steps are taking place:
Table 2 Noise reduction
Input: pre-processed dataset
Output: improved dataset
Process:
1. [col rows] = readDataset( )
2.
a.
b. TempW=0
c.
i.
ii.
iii.
1. remove
iv. end if
d. end for
3. end for
International Journal of Emerging Technology and Advanced Engineering
Website: www.ijetae.com (ISSN 2250-2459, ISO 9001:2008 Certified Journal, Volume 6, Issue 4, April 2016)
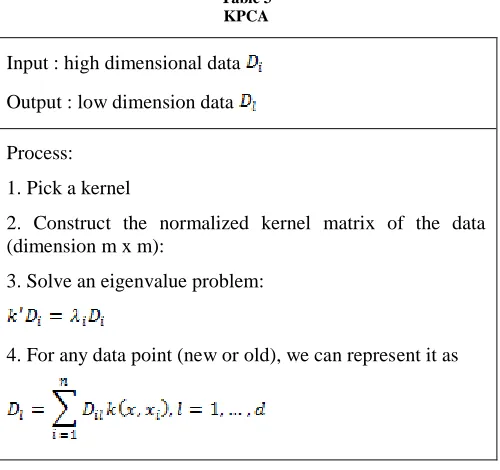
[image:6.612.45.295.238.473.2]99 Feature selection: The well refined or improved dataset is used in this phase for feature extraction or selection. The basic need of feature selection is to reduce the dimension of the input dataset. By which the less amount of data is produced to the learning algorithm, that results efficient learning with less amount of time and space complexity. In this process the KPCA algorithm is consumed for feature selection. The process of KPCA algorithm is given as:
Table 3 KPCA
Input : high dimensional data
Output : low dimension data
Process:
1. Pick a kernel
2. Construct the normalized kernel matrix of the data (dimension m x m):
3. Solve an eigenvalue problem:
4. For any data point (new or old), we can represent it as
Test set generation: in a data mining application the key issues is related to the validation of the trained data model therefore need to prepare a test set by which model is tested. Therefore in this phase the reduced data set is processed again for preparing the test set. Therefore 30% of entire data is selected randomly from the selected features with their class labels. Additionally this selected 30% dataset is used as the test set for the system.
Neural network: The implementation of neural network is defined in two phases’ first training and second prediction: training method utilizes data and designs the data model. By this data model next phase prediction of values is performed [17].
Training:
1.Prepare two arrays, one is input and hidden unit and
the second is output unit.
2.Here first is a two dimensional array is used and
output is a one dimensional array Yi.
3.Original weights are random values put inside the
arrays after that the output is given as.
Where, yi is the activity level of the jth unit in the
previous layer and is the weightof the connection
between the ith and the jth unit.
4. Next, action level of yi is estimated by sigmoidal
function of the total weighted input.
When event of the all output units have been determined,
the network calculates the error (E) given in equation.
Where, yi is the event level of the jth unit in the top layer
and di is the preferred output of the ji unit.
Calculation of error for the back propagation algorithm is as follows:
Error Derivative ( is the modification among the
real and desired target:
Error Variations is total input received by an output changed
In Error Fluctuations calculation connection into output
unit is required:
Overall Influence of the error:
International Journal of Emerging Technology and Advanced Engineering
Website: www.ijetae.com (ISSN 2250-2459, ISO 9001:2008 Certified Journal, Volume 6, Issue 4, April 2016)
100 Trained model: after learning of the neural network the model is prepared for prediction or classification. Thus the trained model needs to accept the test dataset for producing their approximated class labels.
Performance: The output of trained data model after accepting the input of test dataset is performance and their predicted classes. This phase provides the performance of developed bug prediction system, for demonstration and experimentation accuracy, error rate, memory and time complexity is computed and represented for each experiments.
Prediction: the test dataset input for classification provides the detection of input patterns. Therefore for each instance in the selected feature dataset, the class labels are predicted by the algorithm the predicted class labels are compared with actual outcomes of the datasets. According to this concept the performance is computed with the experimental datasets.
IV. RESULT ANALYSIS
The section provides understanding about the
performance study of the proposed predictive algorithm. The performance study of the proposed technique is performed over different performance factors. The obtained performances according to the evaluated parameters are compared with a traditional classifier Bayesian using WEKA machine learning tool and their performance is reported.
A. Accuracy
The accuracy is a measurement of the data model for finding the amount of correctly classified data using the input samples. The performance of the algorithm in terms of accuracy can be evaluated using the following formula.
86 88 90 92 94 96 98 100 102
50 100 150 200 300 400 500
Ac
cu
rac
y i
n
%
Dataset instances
Hybird classification
[image:7.612.324.571.132.350.2]Bayesian classifier
Figure 2 Accuracy
The performance of the proposed hybrid classifier and the traditional Bayesian classifier is compared using the figure 2. In this diagram the X axis shows the training samples in the dataset and the Y axis shows the obtained accuracy in terms of percentage.
[image:7.612.325.562.419.625.2]International Journal of Emerging Technology and Advanced Engineering
Website: www.ijetae.com (ISSN 2250-2459, ISO 9001:2008 Certified Journal, Volume 6, Issue 4, April 2016)
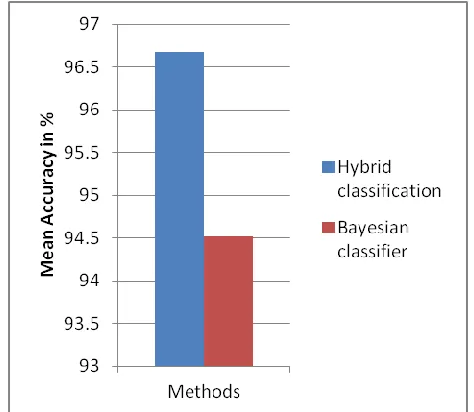
101 The results of both the classifiers are demonstrating the different behaviors of classification aspects, in the traditionally implemented classifier the performance of the classification is reduces as the amount of training instances are increases. On the other hand the performance of the proposed classification technique is increases as the amount of training samples are increase. Thus the proposed classifier performs more effectively as compared to traditional manner of classification. For analyzing the results in the statistical manner the mean accuracy of both the classifiers are computed and their difference in performance is reported using the figure 3. In this diagram the mean performance of both the method in terms of accuracy is demonstrated using the Y axis and the X axis contains the implemented methods for making comparative performance study. According to the obtained performance the proposed classifier is producing approximately 96% of accurate results and the traditional classifier produces the 94 % of accurate results. Thus the proposed classification technique is much efficient and accurate as compared to the traditional technique of data classification.
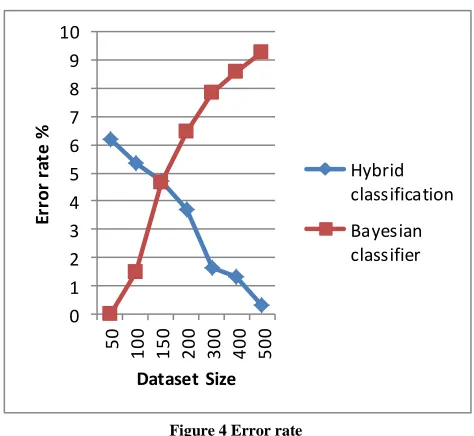
B. Error rate
The error rate of the classifier provides the estimation about the misclassified samples during the testing of the trained classifier. The evaluation of error rate can be performed using the following formula.
Or
The comparative error rate of the proposed and traditional classification technique is provided using the figure 4.
0 1 2 3 4 5 6 7 8 9 10
50 100 150 200 300 400 500
Er
ror
r
at
e
%
Dataset Size
Hybrid classification
[image:8.612.326.563.133.351.2]Bayesian classifier
Figure 4 Error rate
International Journal of Emerging Technology and Advanced Engineering
Website: www.ijetae.com (ISSN 2250-2459, ISO 9001:2008 Certified Journal, Volume 6, Issue 4, April 2016)
102 0
1 2 3 4 5 6
Methods
M
e
an
E
rr
or
r
at
e
%
Hybrid classification
[image:9.612.323.569.131.569.2]Bayesian classifier
Figure 5 Mean error rate
According to the obtained results the from the mean error rate percentage the proposed hybrid classifier produces more effective and improving performance as compared to the traditional classification technique.
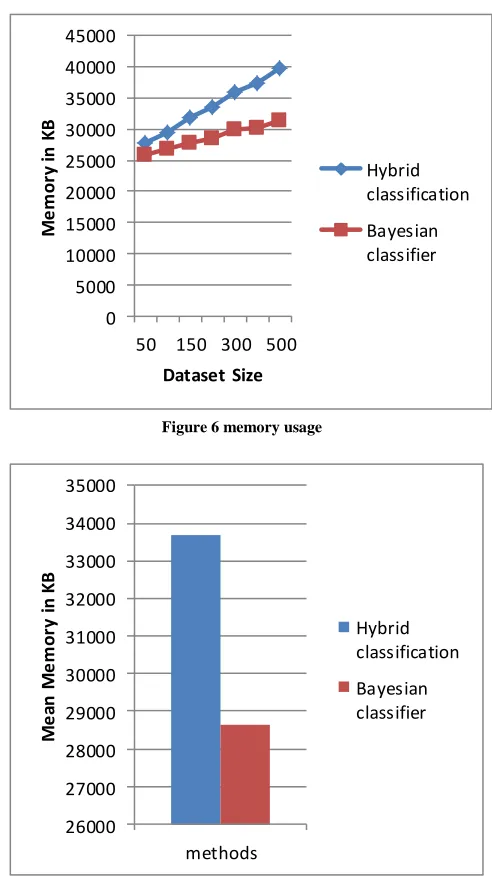
C. Memory usages
The amount of main memory required to successfully execute the algorithms is known as the memory consumption of the algorithms. The given figure 6 shows the comparative performance of both the implemented classifiers. In the given diagram the X axis shows the number of training input samples produced for the training to the data models and the Y axis shows the amount of main memory consumed by the implemented algorithms. According to the obtained results the amount of memory consumption in the proposed data modeling is higher as compared to traditional technique because the proposed classifier needs to process the data using both the classifiers. In order to understand the memory usage difference among both the classification technique the mean memory consumption is demonstrated using the figure 7 in this diagram the X axis shows the amount of instances of the data used for training and the Y axis shows the amount of main memory consumed during evaluation of data.
0 5000 10000 15000 20000 25000 30000 35000 40000 45000
50 150 300 500
M
e
m
or
y
in
K
B
Dataset Size
Hybrid classification
Bayesian classifier
Figure 6 memory usage
26000 27000 28000 29000 30000 31000 32000 33000 34000 35000
methods
M
e
an
M
e
m
or
y
in
K
B
Hybrid classification
Bayesian classifier
Figure 7 Mean memory consumption
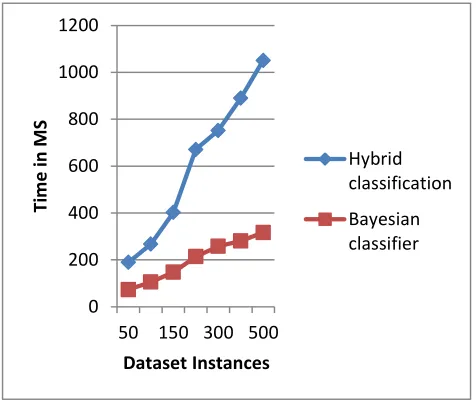
D. Time consumption
[image:9.612.51.305.132.364.2]International Journal of Emerging Technology and Advanced Engineering
Website: www.ijetae.com (ISSN 2250-2459, ISO 9001:2008 Certified Journal, Volume 6, Issue 4, April 2016)
103 In this diagram the X axis contains the amount of data used for training and the Y axis shows the amount of time required to process the data samples. According to the obtained results the proposed technique consumes higher time as compared to the traditional classifier. The proposed scheme utilizes the back propagation neural network and learning of this algorithm is an iterative process thus the amount of time is higher as compared to the Bayesian classifier.
0 200 400 600 800 1000 1200
50 150 300 500
Ti
m
e
in
M
S
Dataset Instances
Hybrid classification
[image:10.612.327.563.136.339.2]Bayesian classifier
Figure 8 Time consumption
In order to understand the difference among both the technique’s performance the mean time consumption of both the algorithms are computed. According to the obtained performance the proposed technique consumes more time as compared to the traditional technique. Thus the proposed model is a time consuming model for training time.
0 100 200 300 400 500 600 700
methods
Ti
m
e
in
M
S
Hybrid classification
[image:10.612.51.289.246.448.2]Bayesian classifier
Figure 9 Mean time consumption
V. CONCLUSION
The key aim of the proposed investigation and solution development is to accomplish an accurate and efficient prediction algorithm. That algorithm is used with software engineering to minimize the efforts of programmer and tester, additionally improve or maximize the production of good quality software solutions. This chapter provides the summary of the entire effort made for proposed solution development and additionally the future extension of the work is also suggested.
A. Conclusion
International Journal of Emerging Technology and Advanced Engineering
Website: www.ijetae.com (ISSN 2250-2459, ISO 9001:2008 Certified Journal, Volume 6, Issue 4, April 2016)
104 This process needs a hard work and a significant amount of time. Thus the entire software engineering process needs a number of steps, among them the implementation and testing is one of the most essential part of process. During these phases the software are implemented and tested to complete the functional goals. In order to reduce the efforts of software engineers a number of efforts in different phases of software life cycles are applied such as agile development technology and others. But fewer efforts are placed on the development and development time bug tracking. Therefore in this presented work a software bug prediction technique is developed and demonstrated.
The key aim of the proposed work is develop a bug prediction system for software engineering. The bug prediction involves the data mining approaches to analyze the previous bug patterns and predict the bugs according to the traditional patterns. According to the required scenario the prediction system needs to implement the supervised learning model for prediction. Therefore a hybrid classifier for predicting the bug is introduced in this work. The proposed classifier first pre-processes the training data and then using the KPCA algorithm the dimension of the data is reduced. Finally the low dimension data is used for training and testing purpose. For the training of prediction system back propagation neural network is used and their performance is estimated. The performance evaluation of the system is provided using the accuracy, error rate, memory, and time complexity. According to the obtained performance of the proposed hybrid software bug prediction system the proposed technique found efficient and accurate as compared to traditional classification and prediction algorithm. Therefore that is adoptable for efficient and accurate prediction methodology.
B. Future work
In this work the data mining based a supervised learning algorithm is used with the dimensionality reduction concept to improve the classification performance of exiting classifier. In addition, the less dimensional data is efficiently consumed with the learning algorithms for proper and efficient training. Thus the performance of the traditional BPN is improved in terms of accuracy and computational resource consumption. In near future the given concept can be extended with unsupervised and supervised learning algorithm’s combination. In this concept the unsupervised learner is used for sub-dividing the patterns into groups and then the base supervised learning algorithm is used to improve learning of the classifiers.
REFERENCES
[1] Importance of Predictive Analytics in Business, http://www.orchestrate.com/blog/importance-of-predictive-analytics-in-business/
[2] Marco D'Ambros, Michele Lanza, Romain Robbes, ―An Extensive Comparison of Bug Prediction Approaches‖, In Proceedings of MSR 2010 (7th IEEE Working Conference on Mining Software Repositories), pp. 31 - 41. IEEE CS Press, 2010.
[3] Bharavi Mishra, K.K. Shukla, ―Defect Prediction for Object Oriented Software using Support Vector based Fuzzy Classification Model‖, International Journal of Computer Applications (0975 – 8887) Volume 60– No.15, Dec 2012
[4] Ajeet Kumar Pandey, Neeraj Kumar Goyal, ―Predicting Fault-prone Software Module Using Data Mining Technique and Fuzzy Logic‖, Special Issue of IJCCT Vol. 2 Issue 2, 3, 4; 2010
[5] Danijel Radjenovic´, Marjan Hericˇko, Richard Torkar, Aleš Zˇivkovicˇ, ―Software fault prediction metrics: A systematic literature review‖, Information and Software Technology, 2013 Elsevier B.V. All rights reserved.
[6] Karel Dejaeger, Thomas Verbraken, and Bart Baesens, ―Toward Comprehensible Software Fault Prediction Models Using Bayesian Network Classifiers‖, IEEE Transections on Software Engineering, Vol. 39, No. 2, February 2013
[7] Peng He, Bing Li, Yutao Ma and Lulu He, ―Using Software Dependency to Bug Prediction‖, Hindawi Publishing Corporation Mathematical Problems in Engineering Volume 2013, Article ID 869356, 12 pages
[8] Kim Herzig, Sascha Just, Andreas Zeller, ―It’s Not a Bug, It’s a Feature: How Misclassification Impacts Bug Prediction‖, 978-1-4673-3074-9/13/$31.00 c 2013 IEEE
[9] Hideaki Hata, Osamu Mizuno, and Tohru Kikuno, ―Bug Prediction Based on Fine-Grained Module Histories‖, 978-1-4673-1067-3/12/$31.00 c 2012 IEEE
[10] Saiqa Aleem, Luiz Fernando Capretz and Faheem Ahmed, ―Comparative Performance Analysis of Machine Learning Techniques For Software Bug Detection‖, ITCS, CST, JSE, SIP, ARIA, DMS – 2015 pp. 71–79, 2015. © CS & IT-CSCP 2015 [11] Xin Xia, David Lo, Xinyu Wang, Xiaohu Yang, Shanping Li, ―A
Comparative Study of Supervised Learning Algorithms for Re-opened Bug Prediction‖, 2013 17th European Conference on Software Maintenance and Reengineering, 1534-5351/13 $26.00 © 2013 IEEE
[12] Dongsun Kim, Yida Tao, Sunghun Kim, and Andreas Zeller, ―Where Should We Fix This Bug? A Two-Phase Recommendation Model‖, IEEE Transactions on Software Engineering, Vol. 39, No. 11, November 2013
[13] Meera Sharma, Madhu Kumari, V B Singh, ―Understanding the Meaning of Bug Attributes and Prediction Models‖, ICARE 2013 New Delhi, India, Copyright 2013 ACM 978-1-4503-2320-8 [14] Sakthi Kumaresh, R Baskaran, ―Defect Analysis and Prevention for
Software Process Quality Improvement‖, International Journal of Computer Applications (0975 – 8887) Volume 8– No.7, October 2010
International Journal of Emerging Technology and Advanced Engineering
Website: www.ijetae.com (ISSN 2250-2459, ISO 9001:2008 Certified Journal, Volume 6, Issue 4, April 2016)
105 [16] Ghazaleh Khodabandelou, Charlotte Hug, Rebecca Deneckere,
Camille Salinesi, ―Supervised vs. Unsupervised Learning for Intentional Process Model Discovery‖, Business Process Modeling, Development, and Support (BPMDS), Jun 2014, Thessalonique, Greece. pp.1-15, 2014