IJEDR1404098
International Journal of Engineering Development and Research (www.ijedr.org)3990
Implementation and Empirical Analysis of IT
Monitoring System Using Open Source Software
based on Nagios Core
Ravikant Sahu
1, Samta Gajhbhiye
21M.E. Student, Computer Science and Engineering Department, CSVTU, Bhilai FET, SSGI, Bhilai, India 2
Prof. Computer Science and Engineering Department, CSVTU, Bhilai FET, SSGI, Bhilai, India
________________________________________________________________________________________________________
Abstract - IT monitoring System offers you the sting with open source monitoring by providing a simple to put in and assemble a system that delivers increased functionality during an extremely scalable, commercially supported system. Ngaios provides support to administrator(s) for police investigation issues before users. The present paper deals with the Implementation and Analysis for IT monitoring through open source software (OSS) technique with the help of open source software established with the basic monitoring server, running a Linux based operating system using a Multi Router Traffic Grapher (MRTG) to gather statistics from the target machine via Simple Network Management Protocol (SNMP). The foundation of our IT monitoring focuses on our physical or virtual devices, called ‘hosts’ – such as a Windows server, Linux server, Cisco router, Nokia firewall, VMware virtual machine, etc. and these are often the lowest level of the ‘stacks’ – and we ensure they are up by pinging them. Once configured, this allows us a view into the devices we have added and notifies which ones are up or down – allowing us to see if a device has crashed or been powered off. This minimal setup establishes the foundational baseline that is important to be regularly reviewed as part of a proactive strategy to manage the day to day operations of a server environment used for NIC network cluster and server cluster proactive services 24x7 monitoring to testing and execution.
Index Terms - network security, packet, monitoring, segregating, network, MRTG, Nagios Core and SNMP
________________________________________________________________________________________________________
I.INTRODUCTION
IT Monitoring System is an open source application that supports tight, 2-way assimilation with other systems like ticketing and helpdesk consoles [1] [2]. In doing so, OSS offers a cost-effective way to upgrade your core monitoring and performance management capabilities with minimal disruption to existing procedures and processes.
Another key consideration for the value of any IT monitoring system is not just only how simple to use it, also how simple it is to take on in the first place. That‟s why OSS makes relocation effortless. The utilize of standard frameworks such as Catalyst and Perl DBI makes development straightforward and developer documentation supported by the strong open source community is freely available online.
OSS integration and compatibility characteristics mean you don‟t have to replace existing monitoring agents and that it will work with presented plug-ins. That manner you don‟t lose any of the value already invested in obtainable monitoring capabilities – you enhance them. OSS provides APIs for system arrangement, monitoring information and renew of host information.
The open nature of OSS locks down costs because your IT department is not supporting new versions, nor is a group of consultants required to just carry out an improvement. Moreover the display of system position information on everything from a corporate local network and websites to the publishing of performance and availability metrics on a client portal is possible from a single monitoring solution more willingly than multiple point solutions generating silted reports and metrics.
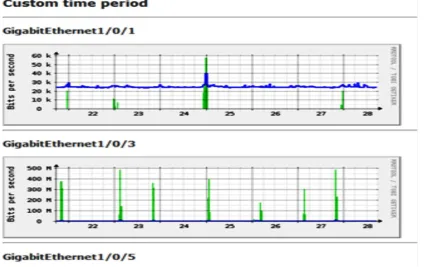
IT monitoring using open source software‟s techniques is very difficult task when different. This situation prompted the development of the Multi Router Traffic Grapher. Every five minutes, it queried the „„Octet Counters‟‟ of the university‟s internet entrance router.
The visual presentation on the Web allowed everyone with a web browser to monitor the status of the link presents an MRTG-generated web page. While the availability of these groups did of course not increase the power of the link, the piece data offered by MRTG proved to be a key argument to convince management that a faster Internet link was indeed needed.
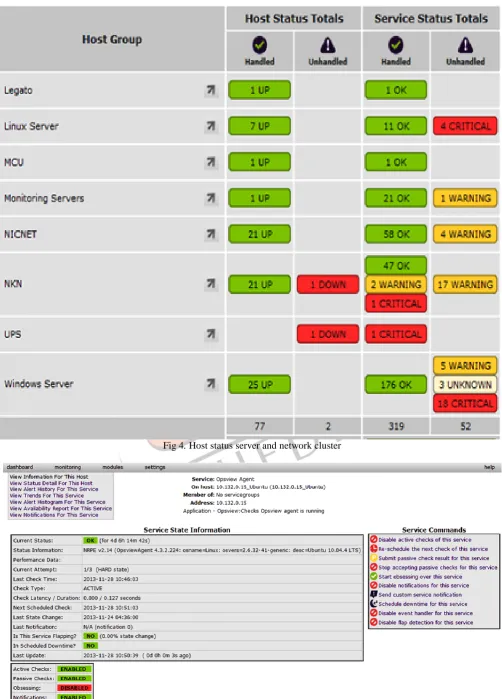
The foundation of our IT monitoring focuses on our physical or virtual devices, called „hosts‟ – such as a Cisco router Windows and Linux server, VMware virtual machine, etc. and these are often the lowest level of the „stack‟ – and we ensure they are up by pinging them. Once configured, this allows us a view such as the image shown below into the devices we have added and which ones are up or down – allowing us to see if a device has crashed or been powered off.
II.NAGIOS CORE
Nagios is an open source computer network monitoring, system monitoring and infrastructure observance software application. It alerts the users when things go wrong and alerts them a second time when the problem has been resolved. Nagios was originally designed to run under Linux but also runs well on other variants of Linux. It offers:
IJEDR1404098
International Journal of Engineering Development and Research (www.ijedr.org)3991
Monitoring of host resources (processor load, disk usage, system logs) on a majority of network operating systems,including Microsoft Windows with the NSClient++ plugin or Check MK. Monitoring by the use of remotely run scripts via Nagios Remote Plugin Executor Remote monitoring supported in the course of SSH or SSL encrypted tunnels.
A plugin design that offers users to easily develop their own service checks depending on needs, by using their tools of choice.
Available data graphing plugins. Parallelized service checks.
Contact notifications when service or host problems occur and get resolved (via e-mail, pager, SMS, or any user-defined method through plugin system).
The facility to classify event handlers to be run during service or host events for proactive problem resolution. Automatic log file rotation.
Data storage via text files rather than a database.
III.WORK FLOW OF MRTG
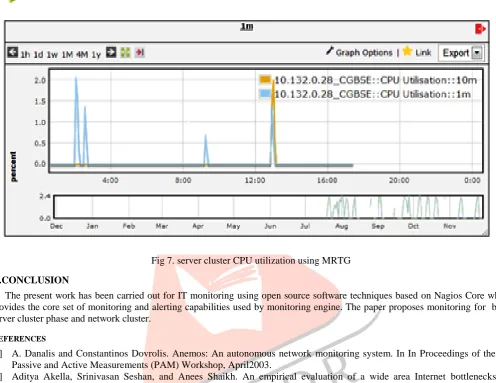
The Multi Router Traffic Grapher, or just simply MRTG, is open source software for monitoring and measuring the traffic load on network. It allows the users to see traffic load on a network over time in graphical form. It was originally developed by Tobias Oetiker and Dave Rand to monitor router traffic, also creates graphs and statistics for almost anything. MRTG is written in Perl.
The MRTG logged its data to an ASCII file, modifying it every six minutes, constantly consolidating it, so that the log file would not increase over time. The log file only stores more data than were needed to draw the graphs on the web page. The graphs are converted into GIF format by piping a graph in PNM format to the pnm to GIF tool from the PBM package. This business limited MRTG to watch about 20 router ports from a workstation.
A second barrier for potential users was that MRTG required SNMP get from the CMU NMP package. This package proved to be rather difficult to compile on various platforms at that time. MRTG was not one of my top priority tasks. Since the CMU SNMP library did not compile on Solaris I had not even a working installation of MRTG. This all changed when Dave contributed a small C program called rate up. Rate up solved MRTG‟s performance problem by implementing the two most CPU intensive tasks in C and thus moving them out of the MRTG script. A key feature of MRTG-2 is its method for preserving the logfiles. The basic goals for designing the MRTG-2 logfile was that the interest in detailed information about the load of the network diminishes proportionally to the amount of time which has passed between the collection of the information and its analysis. This led to the implementation of a log file which stores traffic data with a decreasing resolution in the past. Data older than two years is dropped from the logfile. The resolution of the graphs shown on the web page matches the resolution of the logfile. This logfile has the benefit that it does not grow over time and therefore allows unattended operation of the system for extended periods of time. Making the graphs is relatively fast because no data reduction step is required and thus disk I/O is minimized.
Fig 1. Multi Router Grapher (MRTG) Graphical Presentation
IV.IMPLEMENTATION OF IT MONITORING SYSTEM
IJEDR1404098
International Journal of Engineering Development and Research (www.ijedr.org)3992
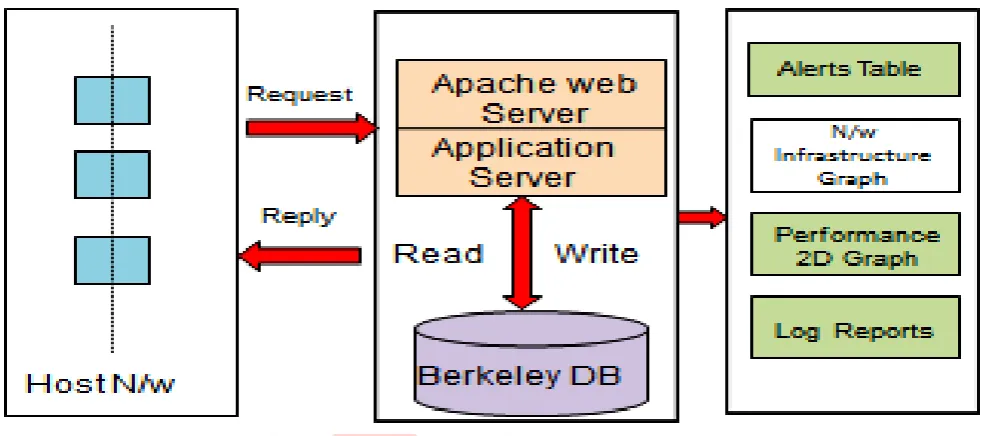
source of the problem by way of a meaningful alert. A server on which you host, the monitoring key, or the monitoring function itself is as vulnerable as the other resources on the network.Fig 2. Main working structure IT Monitoring System
V.HARDWARE AND SOFTWARE REQUIREMENTS
Nagios Core: Provides the core set of monitoring and alerting capabilities and used monitors engine. Perl: The primary programming language.
Catalyst: Web application framework used for building the web application
MySQL: A relational database used for configuration, runtime (Berkley Light Wight Database) Net-SNMP: Provides SNMP support
MRTG: Provides lightweight 2D graphing Nagvis: Network infrastructure Graph
Webmin: Web base Dashboard Controlling utility OS: Ubuntu 14.04 64bit
VMware: Virtual Server
VI.FUNCTIONING OF IT MONITORING SYSTEM
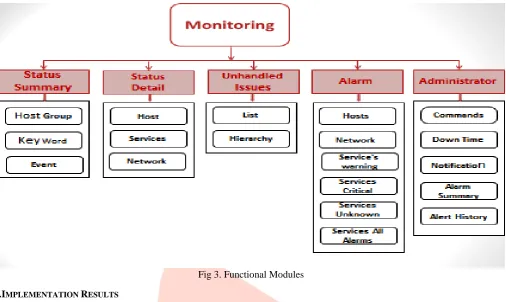
We are given an overlay network represented as a directed graph G = (V, E), and each edge e∈ E of the network has loss probability pe, 0 ≤ pe < 1. We assume that a packet traversing a link e is lost with probability pe, and that losses are independent. Also, given a set of S⊆ V of nodes that can act as sources of probe packets, a set R⊆ V of nodes that can act as receivers of probe packets, and a set of links L⊆ V. The goal is to estimate the link loss probabilities {pe,e∈L}, by sending probe packets from nodes in S to nodes in R. Our performance measure is a cost function proportional to the link utilization required to estimate {pe,e∈L} with a desired accuracy. We will assume that the desired accuracy can be achieved by using a rate of α probe packets. Without loss of generality, we can assume that each edge of our graph has capacity α. This is a typical problem statement in the network monitoring literature. The new idea in this paper is that we assume that nodes in V have the capability to linearly combine incoming packets; also, in estimating the link loss-rate, we consider not only the number of received probe packets but also their contents. To deploy our approach we need the functional modules as shown in Fig. 4.3 and nodes in the overlay to have the following capabilities:
1. A node can look at the contents of several packets arriving from different incoming links, and linearly combine them to create an outgoing packet.
2. A node can send replicate and transmit a copy of the same packet to several outgoing links.
IJEDR1404098
International Journal of Engineering Development and Research (www.ijedr.org)3993
Fig 3. Functional ModulesVII.IMPLEMENTATION RESULTS
The experimental setup of the work has been carried over NIC Chhattisgarh state Data centres IT monitoring system. The developed open source code is based on the near most efficient 70% other IT monitoring software‟s and very optimal to compare. Now that we are monitoring our hosts and services, we can start to be intelligent with the interpretation of the data.
Commonly in IT, servers and network devices make up larger objects such as websites, applications, services, etc. and we actually want to monitor these items rather than the actual items which they be made of. Finally the failure of an IT system is what will impact our business and our customers, so avoidance of these problems is the objective of the monitoring.
So now we have templates to reduce our time-to-value, our only time consuming task is adding these hosts “hostname by hostname”. Again, innovation in monitoring has deemed this an unnecessary evil – with the creation of auto discovery.
Auto-discovery, in its most simplistic form, allows a monitoring system to “go out” and scan a predefined subnet or network and find devices on that network. In our Windows example, we can scan the subnet and discover all hosts on that network and import them into our monitoring system.
The development of IT monitoring system knowledge-base consists of various steps. The experimental setups involved in framing of the knowledge-based module.
IJEDR1404098
International Journal of Engineering Development and Research (www.ijedr.org)3994
Fig 4. Host status server and network clusterIJEDR1404098
International Journal of Engineering Development and Research (www.ijedr.org)3995
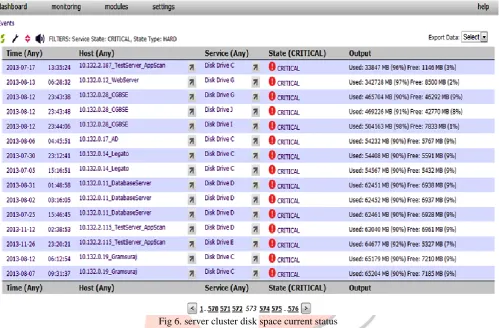
VIII.CASE STUDY FOR TRAINING PHASEThe experimental setup has been done in the present work using IT monitoring open source software‟s as analysis, network for server cluster from various sources. A thorough case study has been done.
Fig 6. server cluster disk space current status
This is what takes an average monitoring tool to the next level – how it deals with services and “top down views”, compared to bottom-up views i.e. focusing on business services rather than components within the service.
IX.ENHANCEMENT OF IT MONITORING SYSTEMS
IJEDR1404098
International Journal of Engineering Development and Research (www.ijedr.org)3996
Fig 7. server cluster CPU utilization using MRTGX.CONCLUSION
The present work has been carried out for IT monitoring using open source software techniques based on Nagios Core which provides the core set of monitoring and alerting capabilities used by monitoring engine. The paper proposes monitoring for both, server cluster phase and network cluster.
REFERENCES
[1] A. Danalis and Constantinos Dovrolis. Anemos: An autonomous network monitoring system. In In Proceedings of the 4th Passive and Active Measurements (PAM) Workshop, April2003.
[2] Aditya Akella, Srinivasan Seshan, and Anees Shaikh. An empirical evaluation of a wide area Internet bottlenecks. In Proc.ACM IMC, October2003.
[3] Kostas G. Anagnostakis, Michael B.Greenwald, and RaphaelS.Ryger. cing: Measuring network internal delays using only existing infrastructure. In Proc. IEEE INFOCOM, April2003.
[4] GiuseppeDi Battista, Maurizio Patrignani, and Maurizio Pizzonia. Computing the types of the relationships between autonomously stems. InProc. IEEEINFOCOM, April2003.