https://doi.org/10.5194/nhess-19-1167-2019 © Author(s) 2019. This work is distributed under the Creative Commons Attribution 4.0 License.
Towards multi-objective optimization of large-scale
fluvial landscaping measures
Menno W. Straatsma1, Jan M. Fliervoet2, Johan A. H. Kabout3, Fedor Baart4, and Maarten G. Kleinhans1
1Faculty of Geosciences, Department of Physical Geography, Utrecht University,
P.O. Box 80115, 3508 TC, Utrecht, the Netherlands
2Faculty of Science, Institute for Science, Innovation and Society, Radboud University,
P.O. Box 9010, 6500 GL, Nijmegen, the Netherlands
3Arcadis Nederland B.V., Department Rivers, Coast and Sea, P.O. Box 220, 3800 AE, Amersfoort, the Netherlands 4Deltares, Department Marine and Coastal Systems, P.O. Box 177, 2600 MH, Delft, the Netherlands
Correspondence:Menno W. Straatsma ([email protected]) Received: 31 August 2018 – Discussion started: 19 September 2018 Revised: 20 May 2019 – Accepted: 26 May 2019 – Published: 17 June 2019
Abstract. Adapting densely populated deltas to the com-bined impacts of climate change and socioeconomic devel-opments presents a major challenge for their sustainable de-velopment in the 21st century. Decisions for the adaptations require an overview of cost and benefits and the number of stakeholders involved, which can be used in stakeholder discussions. Therefore, we quantified the trade-offs of com-mon measures to compensate for an increase in discharge and sea level rise on the basis of relevant, but inexhaustive, quantitative variables. We modeled the largest delta distribu-tary of the Rhine River with adaptation scenarios driven by (1) the choice of seven measures, (2) the areas owned by the two largest stakeholders (LS) versus all stakeholders (AS) based on a priori stakeholder preferences, and (3) the eco-logical or hydraulic design principle. We evaluated measures by their efficiency in flood hazard reduction, potential bio-diversity, number of stakeholders as a proxy for governance complexity, and measure implementation cost. We found that only floodplain lowering over the whole study area can offset the altered hydrodynamic boundary conditions; for all other measures, additional dike raising is required. LS areas com-prise low hanging fruits for water level lowering due to the governance simplicity and hydraulic efficiency. Natural man-agement of meadows (AS), after roughness smoothing and floodplain lowering, represents the optimum combination be-tween potential biodiversity and flood hazard lowering, as it combines a high potential biodiversity with a relatively low hydrodynamic roughness. With this concept, we step up to
a multidisciplinary, quantitative parametric, and multi-objective optimization and support the negotiations among stakeholders in the decision-making process.
1 Introduction
al., 2015). Flood protection measures (interventions) there-fore need careful integration in the spatial planning of trans-port infrastructure and cities with a temporal horizon of 2100 and beyond. At the conceptual level, a strong point has been made for adaptation planning and nature-based solu-tions (Brown et al., 2014; Cheong et al., 2013), but the tools are missing to quickly apply these concepts at the delta scale. Measures for flood hazard reductions should also take na-ture restoration into account. Rivers and deltas potentially have a high biodiversity because of the periodic flooding (Tockner and Stanford, 2002; Ward et al., 1999). However, land use change and population growth have degraded the biodiversity of floodplain habitats, especially in North Amer-ica and Europe (Vorosmarty et al., 2010). River restoration efforts over the last three decades have tried to reverse de-graded fluvial ecosystems (Bernhardt et al., 2005; Buijse et al., 2002), which were supported by the Clean Water Act in the USA and the Water Framework Directive in the EU (Her-ing et al., 2010). The combined efforts of projects with a joint objective of lowering the flood hazard and increasing bio-diversity proved possible, although the biobio-diversity of pro-tected and endangered species is still far below its potential (Straatsma et al., 2017).
River management has to combine varying objectives: flood safety is the primary goal in densely populated deltas, and navigation is often second. River restoration is increas-ingly included in industrialized countries to improve the bio-diversity. A key challenge for environmental management is the number and diversity of the actors and sectors involved in the decision process because each has its own perceptions, interests, and resources (Robinson et al., 2011). Differences are fueled by the short temporal horizon for political deci-sions and the long-term effects of climate change but also by the perceived necessity of landscaping (i.e., terraforming; reconfiguration of the channel-floodplain geomorphology in US terms) measures to climate-proof the delta and societal resentment against large measures. Given the multitude of objectives and options for spatial planning, the need for deci-sion support systems (DSSs) has long been recognized. Ide-ally, a DSS provides rational input, which could remove emo-tional objectives against specific adaptations, but we recog-nize that the personal threat experience also strongly drives actions to limit the flood risk (Grothmann and Reusswig, 2006). Newman et al. (2017) reviewed 101 DSSs for natu-ral hazards, of which 19 focused on fluvial flood risk. Two included studies in the Netherlands: Hübner et al. (2009) de-veloped the “Nature-oriented flood damage prevention”, tar-geting regional water systems, whereas Schielen and Gijs-bers (2003) created “DSS-large rivers”, which was oriented towards the national to continental scale. Both DSSs required the manual implementation of landscaping measures in the accompanying geographic information system (GIS). To the best of our knowledge, none of the DSSs for fluvial flooding listed by Newman et al. (2017) enabled the semi-automatic planning of measures at the spatial scale of the river reach.
A semi-automatic system was presented by Straatsma and Kleinhans (2018), who used a rule-based system for the po-sitioning and parameterization of measures. Coupling a DSS with semi-automated planning of mitigation measures could have additional value in the exploratory planning phase to provide all stakeholders with the efficiency of measures with respect to flood hazard reduction, costs, and biodiversity. No quantitative methodology exists that can combine the plan-ning and parameterization of measures with a multidisci-plinary evaluation.
The implementation of large-scale measures requires the alignment of governance at national, provincial, and munic-ipal level and the involvement, compensation, or expropri-ation of different land owners. Land owners and actors in-volved in river management have diverse perspectives on, and incentives for, implementing river management mea-sures based on socioeconomic, cultural, and land use char-acteristics (Rosenberg and Margerum, 2008; Verbrugge et al., 2017). New adaptation measures could therefore be im-plemented faster when fewer stakeholders are involved, pro-vided they can agree about the type of measure. There-fore, it is necessary to understand land owner character-istics and their motivating factors to indicate the poten-tial for implementing large-scale measures (Rosenberg and Margerum, 2008). Our objectives were to (1) quantify mul-tifaceted trade-offs between landscaping measures to adapt a large delta distributary to sea level rise and increased river discharge while honoring ecological value and societal stakes and (2) include government complexity by positioning the measures in areas owned by the two largest stakeholders ver-sus all stakeholders based on a priori preferences. The mea-sures were parameterized based on nature restoration princi-ples or maximizing flood conveyance capacity.
The decision on different possible interventions requires a multidisciplinary evaluation. Scientists can help to support this evaluation by transforming their data, models, and tools into quantities that can be used to objectively evaluate the different interventions. Here we show an example of how us-ing advanced DSSs, that include cost estimates, as well as physical and ecological quantities, can help to move towards an evidence-based decision based on multidisciplinary per-formance metrics. We assessed the ability of 17 measures to compensate for increased discharge and rising sea levels in the Waal River in the Netherlands while improving the po-tential for biodiversity.
2 Study area
navigabil-Figure 1.The river Waal, a river reach 85 km long between the Pannerden bifurcation near the Dutch–German border and Gorinchem, upstream of significant tidal influence. The center of the study area is located at 51◦530N and 5◦370E. The greyscale differences show the 94 individual floodplain sections.
ity and ecosystem functioning. The study area spans a river reach 85 km long, with an average water surface gradient of 0.10 m km−1. The total area of the embanked floodplains
amounts to 132 km2. Recent nature rehabilitation programs led to increased areas with herbaceous vegetation, shrubs, and forest (Koopman et al., 2018) in an area dominated by meadows. The design discharge for levee height is now set to 16 000 (Q16) and 10 165 m3s−1 for the Rhine branches and the Waal River, respectively. Q16 represents an average return period of 1250 years. Such a discharge is expected to give a 3.99 m water level above ordnance datum (+OD) at the downstream end of the study area. The main channel, 250 m wide, is fixed in place by groynes (spur dikes, wing dikes) for the navigation and prevention of ice dams. It in-cises in its own deposits due to limited sediment supply from the catchment. Maintenance dredging in the insides of the bends is required to maintain the minimum navigable depth. The dredged material is dumped again in the deeper parts of the outer bend. Excavation of floodplain sediments oc-curs mainly in combination with interventions for flood haz-ard reduction. The groynes were partly lowered during the “Room for the River” project (Van Stokkom et al., 2005). In 2017, the new risk-based policy for flooding was accepted, which determines the local individual risk based on the de-sign discharge and the failure probability of the flood protec-tion structures (Van Alphen, 2016).
Flood risk management involves a number of public and private stakeholders (Table 1). It traditionally focused on the construction and maintenance of embankments (artificial lev-ees), but recently the link with sustainable spatial planning has gained attention (Jong and Brink, 2017). Governmen-tal responsibilities are divided over four levels, i.e., national, provincial, regional (water boards), and local (municipali-ties). The two largest land owners are Public Works and Wa-ter Management (PWWM; RijkswaWa-terstaat in Dutch), which owns 2889 ha, mostly consisting of the main channel and groyne fields, and the State Forestry Service (SFS; Staats-bosbeheer in Dutch), which owns 2813 ha that is mostly sit-uated in the floodplains (Table 1). PWWM is the national water authority, and SFS is the national nature conservation organization; both are governmental organizations. The
to-tal number of owners is 1233 between the embankments and 5512 within an additional 50 m buffer (Table 1) based on the cadastral database, which highlights the complexity of im-plementing area-wide measures.
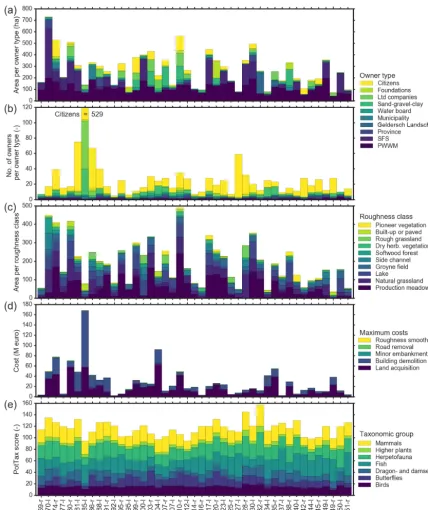
The floodplain consists of 94 individually labeled areas on the left river bank (south) and the right bank, to which we will refer as floodplain sections (Fig. 1, grey shading). The area per stakeholder type differs strongly over the sec-tions (Fig. 2a) as well as the number of owners (Fig. 2b). For example, the section at river kilometer (rkm) 870 on river left (Fig. 2; 870-l) is called the Millingerwaard. It has a total surface area of 721 ha including the main channel, is largely owned by the State Forestry Service (428 ha), and has a total of 17 different owners, of which 12 are private citizens. Sec-tion 885_l (city of Nijmegen) contained the largest number of owners in the embanked area: 633 in total.
3 Methods
The rule-based planning and evaluation of measures required detailed input data (Table 2). Here, we describe the modeling tools plus their input data and the choices made within the hydrodynamic and landscaping scenarios.
3.1 Modeling tools
Here, we briefly describe the existing tools, RiverScape, Delft3D Flexible Mesh, and BIOSAFE, and elaborate on the cost assessment and the land ownership of all stake-holder groups. Reproduction, application, and extension of this work can also be conducted with other hydraulic models and other codes for biodiversity, while RiverScape has novel capabilities (Straatsma and Kleinhans, 2018).
3.1.1 RiverScape: rule-based positioning and parameterization of measures
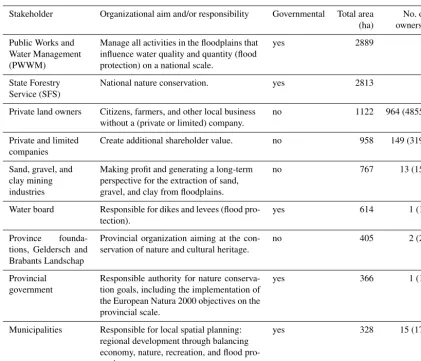
special-Table 1.Characteristics of nine land owner types involved in the maintenance of floodplains (based on Fliervoet and Van den Born, 2017). The remaining area is owned by foundations (66) and churches (20).
Stakeholder Organizational aim and/or responsibility Governmental Total area No. of (ha) owners∗
Public Works and Water Management (PWWM)
Manage all activities in the floodplains that influence water quality and quantity (flood protection) on a national scale.
yes 2889 1
State Forestry Service (SFS)
National nature conservation. yes 2813 1
Private land owners Citizens, farmers, and other local business without a (private or limited) company.
no 1122 964 (4855)
Private and limited companies
Create additional shareholder value. no 958 149 (319)
Sand, gravel, and clay mining industries
Making profit and generating a long-term perspective for the extraction of sand, gravel, and clay from floodplains.
no 767 13 (15)
Water board Responsible for dikes and levees (flood pro-tection).
yes 614 1 (1)
Province founda-tions, Geldersch and Brabants Landschap
Provincial organization aiming at the con-servation of nature and cultural heritage.
no 405 2 (2)
Provincial government
Responsible authority for nature conserva-tion goals, including the implementaconserva-tion of the European Natura 2000 objectives on the provincial scale.
yes 366 1 (1)
Municipalities Responsible for local spatial planning: regional development through balancing economy, nature, recreation, and flood pro-tection.
yes 328 15 (17)
∗Number of owners between the main embankments per type of stakeholders (sum=1233). In brackets the number of owners is given between the
embankments plus a 50 m buffer (sum=5512).
Table 2.Overview of input datasets used for intervention planning and evaluation.
Dataset Derived data Reference
Baseline River geometry, trachytopes Scholten and Stout (2014) BAG-2015 Building locations and type BAG (2016)
Cadastral map Stakeholder type http://www.kadaster.nl/-/eigendomskaart-eigenarenkaart (last access: 28 November 2016)
Soil pollution map Areas of polluted soil Stienstra (2011)
Top10vector Road location, type, and width http://www.kadaster.nl/-/top10nl (last access: 20 November 2016) Ecotope map 2012 Ecotopes, side channel location Scholten and Stout (2013)
ist translates the position of the measure and the parameter-ization in terms of land cover and terrain height into layers of spatial data, for example with HEC-GeoRAS (Ackerman, 2011) or Baseline (Scholten and Stout, 2014). Both steps are time-consuming, and, therefore, often only a few scenarios are developed (Nardini and Pavan, 2012). For this study, we used RiverScape, a software tool for the rule-based
Figure 2.Overview of attributes of floodplain sections (Fig. 1). The sections are labeled by the mean river kilometer, followed by the “-r” for river right and “-l” for river left: (a)surface area per type of owner (churches not shown),(b)number of owners per owner type, (c)surface area of the 10 dominant hydrodynamic roughness classes,(d)costs per item over the whole section in millions of euro (M euro), and(e)floodplain biodiversity scores per taxonomic group.
new bathymetry and the height of minor embankments (mi-nor levee for the prevention of summer flooding of floodplain agricultural fields) and groynes (wing dikes, or spur dikes) are controlled by user-specified reference heights expressed as water levels at the river axis with a specific exceedance probability. The new land cover is given as an ecotope and
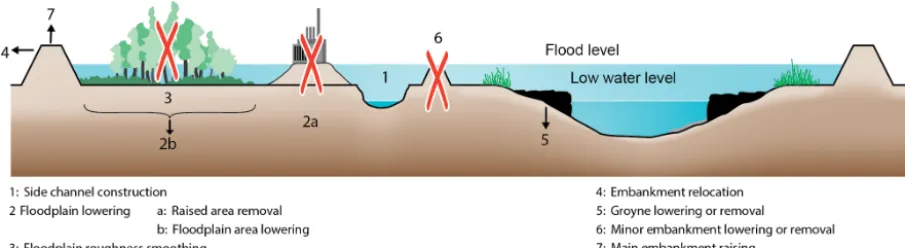
embank-Figure 3.Typical landscaping measures implemented in this paper (figure after Middelkoop and Van Haselen, 1999).
ment height), together with the user settings. The generation of measures takes less than 2 min, which makes it a fast op-tion for scenario development.
3.1.2 Delft3D Flexible Mesh: hydrodynamics
RiverScape was coupled to a calibrated 2-D hydrodynamic model. We used Delft3D Flexible Mesh (DFM), the open-source hydrodynamic model that is developed and main-tained by Deltares (2016). The computational core of DFM solves the shallow water equations based on the finite-volume method on an unstructured grid (Kernkamp et al., 2011; UGRID Conventions, 2016). The computational mesh of the study area consisted of 71 000 active cells between the main embankments. The DFM input files consisted of bathymetry, trachytopes, fixed weirs for groyne height and minor embankment height, thin dams for buildings and bridge pillars, and dry areas for embankment relocation. These files were updated with the RiverScape measure def-inition of each intervention following procedures described by Straatsma and Kleinhans (2018). The boundary condi-tions are specified by the upstream discharge and the down-stream water level (Fig. 1). Only stationary discharges were simulated.
3.1.3 BIOSAFE: potential biodiversity
We applied the BIOSAFE model (De Nooij et al., 2004; Lenders et al., 2001; Straatsma et al., 2017) to evaluate the measures on the potential biodiversity for protected and en-dangered species that are representative of the fluvial envi-ronment. The BIOSAFE conceptual model comprises a set of links between riverine species and legal and policy docu-ments for species protection on the one hand and links be-tween species and ecotopes on the other hand. These two sets create a link between the legal domain and ecotopes via species. BIOSAFE calculates scores of potential biodiversity for seven taxonomic groups. The scores represent potential species presence based on habitat requirements, which were weighed by (1) the number of legal and policy documents as-suming equal importance for all documents and (2) the
sur-face area of associated ecotopes, and that are normalized by the area under consideration, enabling the comparison of the scores over floodplain sections with different sizes. In this study we calculated thePotTax, the potential biodiversity of protected and endangered species for each of the taxonomic groups (higher plants, dragonflies plus damselflies, butter-flies, fish, herpetofauna, birds, and mammals). PotTax val-ues were summed up into a singlePotAllscore for all groups together.PotTaxandPotAllscores were calculated for each floodplain section (Figs. 1; 2e) separately and averaged over the whole study area for each scenario. Figure 2e shows the PotTaxscores for the reference situation.
3.1.4 Cost evaluation
River restoration projects are costly, but costs are often re-ported in aggregated form over the whole project (Bernhardt et al., 2005). Ayres et al. (2014) compiled the available ev-idence of the cost of river restoration and showed that the costs varied strongly for a single type of measure but also that only a few of the cost estimates contained information on dif-ferent cost items. They proposed a cost typology, which dis-tinguished nonrecurring costs (planning, transaction, land ac-quisition, and other construction/investment costs) from re-curring costs (annual maintenance and monitoring costs). In this study, we limited the scope to the nonrecurring costs re-quired for the implementation of the measures. The data for the cost appraisal (Appendix A; S. Prins, unpublished data) should be interpreted as indicative, as neither the building contractor nor the client that orders the measure wants to share their valuation tables for fear of losing their position during negotiations. Recurring costs are generally an order of magnitude lower and depend on the land management af-ter the implementation of the measure.
type, and width; (3) the ecotope map of 2012 for a simpli-fied land cover; (4) the Baseline geodatabase for the posi-tion and length of groynes and minor and main embank-ments; and (5) the soil pollution map (Table 2 and refer-ences therein). Polluted soil is expected only in the top 1 m of the soil (Middelkoop, 2002) from sediment deposition in the floodplains. The ecotope map was used for the cost of roughness smoothing. Units of river kilometer were used to calculate the cost of dike raising. To calculate the nonrecur-ring costs, we determined the capital expenditures (CAPEX) for each measure. We are aware that additional operational expenditures (OPEX) increase the total cost over the lifetime of the measure and that different trade-offs could be found depending on the temporal horizon, but this is beyond the scope of this study. For each cost item, we mapped the unit cost in Euro per unit; the standard deviation is around 15 % of the unit price (Appendix A). The spatial distribution of the costs of smoothing, road removal, minor embankment removal, building acquisition and demolition, and land ac-quisition (Fig. 2d) indicates that the acac-quisition cost of land and buildings dominates the overall cost of measures.
The calculation of the cost per measure comprised the overlay of the cost maps with the measure definition. For side channel recreation and floodplain lowering, the unit costs of earthwork per cubic meter were added. The volume of earth-work depended on the measure settings and the existing to-pography. Postprocessing was required to correct for the use of data from different sources. For example, the ecotope map does not contain road information, but the cost for road re-moval should be equal to zero for a smoothing measure. No land acquisition costs are assumed for roughness lowering. 3.1.5 Owner type and number of owners
We used the cadastral map (http://www.kadaster.nl/-/ eigendomskaart-eigenarenkaart) to classify the owners into different types of stakeholders (Fig. 2a, b). The name of the entitled person of each parcel was processed with a set of rules to classify them into nine different stakeholder types listed in Table 1. In addition, we defined the type “foun-dations” and the remaining type “other”, which consisted mainly of parcels owned by churches. PWWM and SFS were easily classified as they consisted only of a single or a few entitled owners. Sand, gravel, and clay companies were ex-tracted by their specific names, e.g., WAAL BRICKS B.V. The number of owners was determined by counting the num-ber of individual owners within the area of the measure or within each floodplain section (Fig. 2b) using vector over-lay operations. The number of owners was used as a proxy for governance complexity because the area of the measure extent is owned by a person or organization, which requires (1) the alignment of the majority of the stakeholders with the measure and (2) expropriation of the other land owners. This process is more complex when many stakeholders are involved.
3.2 Scenario development
The modeling tools of Sect. 3.1 enabled the exploration of different adaptation scenarios with respect to changing hy-drodynamic boundary conditions and adaptation measures. We used 17 measures (Table 3) for each of the three hydro-dynamic scenarios. Trade-offs between flood safety, imple-mentation cost, potential biodiversity, and number of stake-holders were quantified for each hydrodynamic scenario. The trade-offs consisted of the measures that represented the op-timal combination of two variables and were represented as a line. The optimal measures were extracted from the convex hull of the measures’ scores in the attribute space. No at-tempt was made to select a single optimal measure by means of minimizing an objective function because such techniques require weighing factors for the four aspects, and these are currently unknown. The weighing factors can also change quickly due to changing public opinions and political will, and they differ between stakeholders. Nonetheless, we high-light specific interventions as optima in the multidimensional parameter space.
3.2.1 Hydrodynamics
The hydrodynamic boundary conditions were given by the upstream river discharge and the downstream water level. The embankments have a flood protection standard for a flood (Q16) with a statistical return period of 1250 years (Silva et al., 2004). However, Q16 did not include the pro-jected effects of climate change. The future design dis-charge of the river Rhine is uncertain. In policy documents, 18 000 m3s−1 (Q18) is used as the likely maximum
Table 3.Overview of 17 landscaping scenarios: six measures, two locations based on stakeholders (all stakeholders and large estate own-ers), and two design principles (smooth and natural). All measures were evaluated for three sets of hydrodynamic boundary conditions (Q16_dh0.0, Q18_dh0.0, and Q18_dh1.8). The abbreviations are used in results’ figures.
Measure type Stakeholders∗ Design Abbreviation principle
Roughness lowering All natural Smoothing_AS_natural
Roughness lowering All smooth Smoothing_AS_smooth
Roughness lowering Large natural Smoothing_LS_natural
Roughness lowering Large smooth Smoothing_LS_smooth
Side channel creation All natural Sidechannel_AS_natural Side channel creation All smooth Sidechannel_AS_smooth Side channel creation Large natural Sidechannel_LS_natural Side channel creation Large smooth Sidechannel_LS_smooth
Floodplain lowering All natural Lowering_AS_natural
Floodplain lowering All smooth Lowering_AS_smooth
Floodplain lowering Large natural Lowering_LS_natural
Floodplain lowering Large smooth Lowering_LS_smooth
Minor embankment lowering All NA Minemblowering_AS
Minor embankment lowering Large NA Minemblowering_LS
Groyne lowering All NA Groynelowering_AS
Groyne lowering Large NA Groynelowering_LS
Dike raising All NA Dikeraising_AS
NA: not applicable.∗Abbreviated to “AS” for all stakeholders and to “LS” for large stakeholders, i.e., Public Works
Department and State Forestry Service.
boundary conditions, labeled as “Q16_dh0.0”, “Q18_dh0.0”, and “Q18_ dh1.8” for all measures. We compared the result-ing water levels at the river axis for each measure with the modeled reference water levels of Q16_dh0.0 without any measure.
3.2.2 Location: stakeholder involvement
The options for landscaping measures for flood safety and river restoration by far exceed the two options to change hy-drodynamic boundary conditions. The evaluation of all these options in terms of flood hazard, biodiversity, and costs is very time-consuming to carry out using preexisting software. The multitude of possible scenarios is driven by the respon-sible authorities and the number of stakeholders, their land ownership, and their preferred land use and legal permis-sions. At the same time, the perceived urgency to reduce the flood risk, the available budget, and political will also affect the choice for measures and the speed of implementation, al-though all stakeholders agree about flood safety as the num-ber one priority. We simplified and summarized the stake-holders’ preferences for specific measures based on their ganizational objectives and responsibilities (Table 1) in or-der to or-derive a manageable set of scenarios for landscaping measures (Table 3). The stakeholders’ preferences (Table 4) were based on Table 1, literature (Fliervoet and van den Born, 2017; Fliervoet et al., 2013), and expert judgement.
The directorate for Public Works and Water Management (PWWM) is the largest landowner (Table 1). They are the
responsible authority for the flood protection objectives to-gether with the water boards. Therefore, both are in favor of measures that improve the flood protection levels, especially on their own lands, such as roughness smoothing, floodplain lowering, and groyne lowering (Table 4). Although many side channels were constructed in the Room for the River program to realize flood protection and nature objectives, the PWWM does not have a clear preference for side channels because of high maintenance costs and increased sedimenta-tion in the navigasedimenta-tion channel (Van Vuren et al., 2015).
The State Forestry Service aims to develop more natural (unregulated) river systems by giving more room to natural erosion and sedimentation processes, in line with the vision of “self-regulating nature” (Stanford et al., 1996; Ward et al., 2001). This vision became a source of information for the Dutch ecological rehabilitation programs of the Rhine branches and Meuse River (Buijs, 2009), and it addresses measures which create a more dynamic floodplain environ-ment, such as the construction of a side channel or lowering of the floodplains (Table 4).
Table 4.Simplified stakeholder preferences for different measures.
Stakeholder type Public Works State Private Company Mining Water Province Provincial Municipa-and Water Forestry land companies board foundations government lities Management Service owners
Measure
Side channel construction 0 + 0 − +b 0 0 +a 0 Roughness smoothing + − +c 0 0 0 +d 0 0 Floodplain lowering + + −c − +b 0 − +a 0
Groyne lowering +e 0 0 0 0 0 0 0 0
Minor embankment lowering 0 0 − − 0 +f − 0 0
Dike raising 0 0 0 0 +b +g 0 0 0
Legend is as follows:+denotes those in favor of implementing measure on own properties; 0 denotes those with no clear opinion or no mandate;−denotes those against measure. Notes are given as follows.aIn the case flood safety and spatial quality are combined, e.g., in the Room for the River program.bExtraction of sand, clay, or gravel.cAgricultural function.dTo maintain cultural landscape.eResponsible for groynes.fResponsible for minor embankments.gResponsible for, and owner of, the main embankment.
a side channel or lowering a floodplain. Both measures have the opportunity to reconcile the objectives of flood protection and restoring nature in the floodplains.
The water boards are responsible for, and the owners of, the dikes and minor embankments. They prefer the follow-ing measures: minor embankment lowerfollow-ing and dike raisfollow-ing. Private land owners (especially farmers) and companies are often against measures such as minor embankment lower-ing and floodplain lowerlower-ing, due to the increased floodlower-ing frequency of their land, which negatively affects their activ-ities. The sand, gravel, and clay mining industries are often in favor of measures that lead to the excavation of soil in the floodplains. Finally, the province foundations (“Gelder-sch and Brabants Land(“Gelder-schap”) are aiming at the conservation of nature and cultural heritage, such as braid hedges (woven growing hedges used as parcel delineation) or fortresses in the floodplains. These foundations perceive minor embank-ment lowering and floodplain lowering negatively and rough-ness smoothing positively where a “park-like” landscape is concerned (Fliervoet et al., 2013).
Stakeholder involvement and their land ownership deter-mined the locations where the measures were positioned. The first option for the location of measures was the com-bination of the large stakeholders (LS) that own large areas, being PWWM and SFS, based on their a priori preferences of measures. They own 56 % of the whole study area to-gether (Table 1) and 31 % of the groyne field plus floodplain area. They agree with floodplain lowering as a possible mea-sure, disagree with roughness smoothing, and do not disagree with the other measures (Table 4). SFS opposes roughness smoothing because it opposes their vision of self-regulating nature, except when it is performed within the context of cyclic floodplain rejuvenation. Given the large area owned by these two stakeholders only, they can relatively easily im-plement the different measures on their own property, even though they pursue different ultimate objectives. The second option was that the measures could be implemented on the property of all stakeholders (AS). This means that all 1233
stakeholders would need to endorse the measure or be com-pensated. Given the different objectives of the stakeholders, this can only be realized after a major disaster when the ur-gency is high. Although this is not the current state in the Netherlands, we still include it because of the changing hy-drodynamic boundary conditions over time. This gave two location scenarios: LS and AS.
3.2.3 Measure type and design principle
Six adaptation measures were implemented in the groyne field and the existing floodplains (Fig. 3); measures in the main channel and the areas protected by the main embank-ments were not considered. The design principle of the mea-sure affected the choices made within RiverScape with re-spect to the new land cover and the cross-sectional shape of new side channels. The first option, labeled as “smooth”, was to optimize the conveyance capacity of the floodplain, whereas the second option, labeled as “natural”, included ecological qualities as favored by SFS and the provincial government. No difference between smooth and natural de-signs was implemented for minor embankment lowering, groyne lowering, and dike raising because the land use is as-sumed to remain identical.
option, similar to roughness lowering. Thirdly, natural and smooth side channels differed in their cross-sectional shape and depth. Both were connected to the main channel only at the downstream end. We choose a width of 75 m, a depth of 2.5 m, and lateral slopes of 1 to 3 for smooth side chan-nels. Natural side channels were parameterized with a 50 m width, a 1 m depth, and lateral slopes of 1 to 7. Ecotopes for deep and shallow side channels were assigned, which trans-lates into the same trachytope. Finally, minor embankments and groynes were lowered to the water level which exceeded 50 and 150 d yr−1, respectively. The main embankment was raised by 1 m over the whole study area. Embankment relo-cation was excluded.
4 Results
In order to quantify the trade-offs, we will first describe indi-vidual components to gain a detailed understanding. The hy-drodynamic evaluation is given most attention because flood safety represents the top priority for all stakeholders.
4.1 Measure positioning and hydrodynamic effects The measures were positioned in the areas owned by the large stakeholders (PWWM and SFS; Fig. 4), or over the whole area. The fraction of the surface area owned by the large stakeholders varied strongly between the floodplain sections. The main channel and the groyne field are completely owned by the PWWM, whereas SFS owns the majority of specific floodplains sections, such as around 900-l and 928-r (Fig. 1). The different hydrodynamic boundary conditions (Fig. 5a, b) led to spatial variation in the water levels. Q18_dh0.0 gives a 0.33 m increase in water levels at the downstream boundary, which increased rapidly in the upstream direc-tion to a maximum of 0.76 m at rkm 880. Conversely, the Q18_dh1.8 scenario gave the highest water level increase downstream: 2.12 m. In the upstream direction, the differ-ences decline due to the reduced impact of the backwater effect further upstream, with a minimum increase of 0.76 m at rkm 868, the model boundary on the upstream end. Two measures give lower water levels than in the reference situa-tion in the Q18_dh0.0 and Q18_dh1.8 scenario, which is an over-dimensioning of the measures.
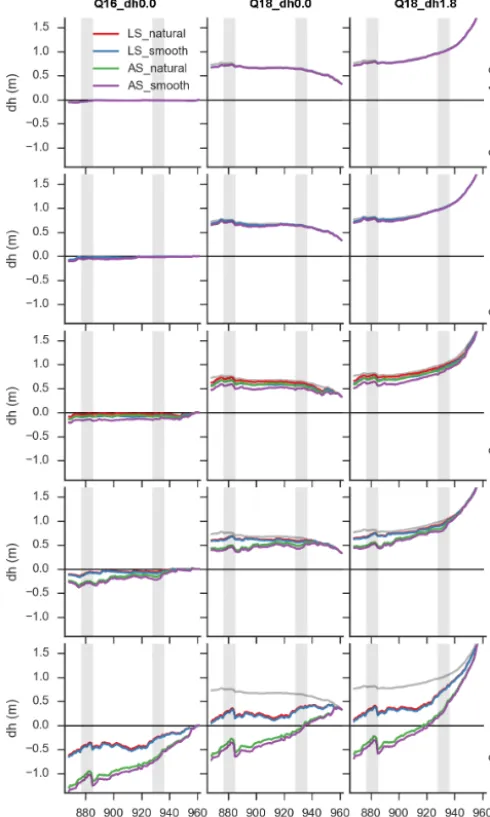
The effects of the measures differed strongly between the type of measure and the location (Fig. 6, left column). We compared the simulated water level with the reference situ-ation (Q16_dh0.0, without measures) for all hydrodynamic and landscaping scenarios to see to what extent the mea-sures can lower the flood hazard or mitigate the changing hydrodynamic conditions. Groyne lowering mainly affected the upstream area, with a maximum lowering of 0.06 m. Mi-nor embankment lowering gave a maximum lowering of 0.07 and 0.11 m for large stakeholders (LS) and all stakeholders (AS), respectively. Roughness lowering was more effective,
with a maximum of 0.21 m for AS_smooth and a minimum of 0.09 m for LS_natural. LS_smooth and AS_natural both reach 0.14 m water level lowering. The largest effects and the largest differences between the measure parameteriza-tions were observed for side channels and floodplain low-ering. Side channels showed a sequence of backwater curves from the individual measures, with a maximum lowering of 0.38 m for AS_smooth and 0.34 m for AS_natural (Fig. 6) in the upper part of the Waal, which is due to the combined effects of all channels and the higher water surface slope. Floodplain lowering gave the maximum water level reduc-tions, which ranged between 0.62 m for lowering_LS_natural and 1.37 m for lowering_AS_smooth.
The water level lowering per measure was almost equal between the hydrodynamic scenarios. The correlation coeffi-cient between water level lowering exceeded 0.999 between Q16_dh0.0, Q18_dh0.0, and Q18_ dh1.8. The similarity in lowering can be observed in Fig. 6 by comparing the differ-ences in water level between the reference (y=0 in the left column and the grey lines in the middle and right column) and the colored lines representing the measures. This differ-ence is nearly identical between the three columns.
The measure efficiency in compensating the changing hy-drodynamic conditions (Fig. 6 middle and right columns) showed that only floodplain lowering was able to lower water levels below the reference situation. Lowering was more efficient upstream, with the zero crossing at rkm 933 and 920 for AS_smooth in Q18_dh0.0 and Q18_dh1.8, respectively (Fig. 6). The other measures did not lower the water levels below the reference. All measures were more efficient in water level lowering in the upper reach. On average, the lowering was 2.2 times larger upstream (rkm 868–894) than downstream (rkm 919–945), ranging from 1.1 times for smoothing_AS_natural to 4.4 times for minemblowering_LS. Floodplain lowering at the locations of all stakeholders could compensate for the additional dis-charge (Q18_dh0.0) both upstream and downstream, but for Q18_dh1.8 this measure only suffices upstream (Fig. 6 bot-tom right panel).
4.2 Effects on potential biodiversity and implementation costs
Figure 4.Location of the two largest stakeholder, the state (Public Works and Water Management) and the State Forestry Service (SFS). The other public and private stakeholders own the remaining areas in white. The location of the side channels represents the smooth option for the whole area (AS). Water flows right to left. Measures are implemented over the whole reach, independent of the reference water level being exceeded.
Figure 5. (a)Absolute water level for the three hydrodynamic sets of boundary conditions (solid lines) and the effects of the implemented measures for Q16_dh0.0 and Q18_dh1.8 in the shaded areas.(b)Changes in water level relative to the reference situation, Q16_dh0.0 without measures. The thick lines represent the relative changes without any measures; the thin lines represent the 16 different measures for each set of boundary conditions. Water flows left to right.
reference situation to 41 and 67 after the implementation of smoothing_AS_smooth and lowering_AS_smooth, respec-tively. The effects of side channels on PotAll scores were positive for all scenarios, except for section 932-r. However the differences were smaller compared to floodplain lowering and roughness smoothing (Fig. 7) due to the smaller spatial extent of the side channels.
The PotAll scores increase from the floodplain lowering and roughness smoothing when the area is managed as a moist natural grassland after the measure has been carried out. This holds even for floodplain sections that already had a highPotAllvalue in the reference situation. The increase rep-resents the difference in potential biodiversity between natu-ral moist grasslands and the dominant production-oriented land cover in floodplains along many northwest European rivers.
The implementation costs varied strongly between the measures, ranging from EUR 1.7 billion for lowering_AS to EUR 2 million for floodplain smoothing (Fig. 8). The largest costs are inferred by the acquisition of buildings and land, and the costs of forest removal and mowing for floodplain
smoothing are very low. The costs of raising the dikes repre-sent a 1 m increase in dike height. The fraction of the costs for building removal is 9 % for the LS case and 35 % for the AS case, indicating that the LS have relatively few built-up areas.
4.3 Quantification of trade-offs for climate adaptation measures
repre-Figure 6.Water level changes (dh) at the river axis relative to the reference situation (Q16_dh0.0). The water levels of Q18_dh0.0 and Q18_dh1.8 are shown as grey lines. Water flows left to right, with the upper and lower area highlighted as grey vertical bands; see text for statistics. Measure (msr) type is indicated on the right. The grey lines in the middle and right column represent the effects of boundary conditions only.
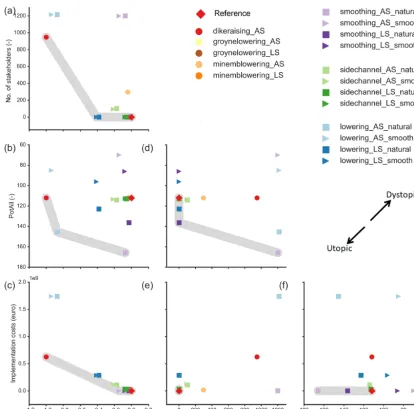
sent the trade-off. Note that thePotAllaxes were reversed to visualize utopia in the lower left corner. Dike raising by 1 m was visualized as a water level lowering of 1 m for visualiza-tion purposes.
We considered a low number of stakeholders favorable for fast implementation of a measure. The number of stakehold-ers involved in measures has an optimum in water level low-ering for dike raising (n=948), lowering_LS, and sidechan-nels_LS (both n=2) (Fig. 9a). Smoothing_AS_natural is closest to dystopia, with 1200 stakeholders and only a small reduction in water level, which highlights the problems of
managing the floodplain roughness. However, legislation ex-ists that makes roughness lowering obligatory in areas with high conveyance capacity.
The trade-offs between PotAll and water level lowering consisted of dike raising, lowering_AS_natural, and smooth-ing_AS_natural (Fig. 9b). The mean reference value of PotAllis 112 as represented by dike raising and the “refer-ence”. All measures above this reference line (PotAll=112) have a lowerPotAllscore (note the reversed axis) and a de-creased potential biodiversity. The natural and smooth sce-narios for floodplain lowering and smoothing show up as paired points above and below the reference line with a sim-ilar water level lowering. For example, the mean potential biodiversity can be increased to 166 for floodplain smooth-ing over the whole area and natural grassland as land cover (smoothing_AS_natural), but it can also be decreased to 70 by applying production meadow as the land cover (smooth-ing AS_smooth). The mean difference in water level reduc-tion between these two measures is less than 0.08 m due to the similarity in vegetation roughness between these trachy-topes.
Cost-effectiveness measures in terms of water level low-ering consisted of dike raising and smoothing_AS_smooth (Fig. 9c), which are the two traditional methods of flood risk prevention in the Netherlands. Floodplain lowering_LS touches the grey optimum line and keeps an intermediate po-sition. Lowering_AS is almost 3 times more expensive than dike raising and does not lower the water levels much in the lower reaches (Fig. 6). All roughness smoothing measures have low implementation costs, but it should be noted that they will differ in productivity after implementation.
Improving the PotAll scores was easiest in terms of number of stakeholders with smoothing_LS_natural, which was followed by smoothing_AS_natural, even though 1200 stakeholders were involved (Fig. 9d). The reference situa-tion is also on the optimum line because zero stakeholders were involved. These measures also represent the cheapest way to increasePotAllvalues (Fig. 9f). The optimum in the number of stakeholders against total costs is represented by groyne lowering, minor embankment lowering, and smooth-ing at the LS locations. These points are not obvious in the plot (Fig. 9e); they only show up after zooming in on the lower left corner. The reference situation was ignored be-cause it does not represent a measure.
5 Discussion
gover-Figure 7.Changes inPotAllscores per floodplain section for three measure types:(a)smoothing (roughness lowering),(b)side channels, and(c)floodplain lowering. Note the different vertical scale in panel(b).
Figure 8. Comparison of costs between scenarios in millions of euro (M euro).
nance complexity using land ownership and stakeholder pref-erences as a proxy. Our methodology suits the early stages of the planning process as it provides an overview of possi-ble measures to adapt to climate change and the associated
capital expenditures, plus the hydrodynamic and ecologic ef-fects. Compared to other DSSs targeted at intervention plan-ning (Hübner et al., 2009; Schielen and Gijsbers, 2003), we added the option for automatic positioning and parameteriza-tion of measures over arbitrary areas, costs, and the number of stakeholders. Our modular structure enables more evalu-ation criteria to be added. In the final stages of intervention planning, additional weighting of interventions is required in practice using a multi-criteria analysis. Changing the weights will alter the trade-offs between the evaluation parameters. For example, the single objective of flood hazard reduction would rank embankment raising, floodplain lowering, side channels, and roughness smoothing as top priorities, whereas conversion to natural grassland would be favored from the river restoration perspective of protecting threatened and en-dangered species.
comple-Figure 9.Scatterplot matrix of the main criteria for intervention planning. The grey areas indicate the optimum combination of criteria for each panel. Similar colors represent one type of measure, and shading represents the difference in location. The two design principles are visualized, with a rectangle for natural and a triangle for smooth. The diamond represents the reference situation.
tion of the so-called Room for the River program. This pro-gram aimed at increasing the design discharge from 15 000 to 16 000 m3s−1, and now river managers focus on efficient maintenance of the floodplains (Fliervoet and van den Born, 2017). However, given the large uncertainties in sea level rise and river discharge, the focus may quickly change.
The quantified trade-offs led to new insights in the po-tential effectiveness of the two largest stakeholders for wa-ter level lowering and biodiversity. Measures in the areas owned by the two largest stakeholders lowered the water lev-els more effectively per unit area because these stakehold-ers own the areas with the highest conveyance capacity. The parameter space between potential biodiversity and imple-mentation cost gave a surprising quasi-horizontal trade-off, with the highest biodiversity scores for roughness
smooth-ing and conversion to natural grassland at a low cost, which is followed by the reference situation. This highlights nat-ural grassland as a good candidate for multi-objective opti-mization on biodiversity increase and flood hazard decrease because the difference in water level lowering was small. Such an intervention would not have shown up in the typical cost-effectiveness of measures. The addition of biodiversity scores to the evaluation enables simultaneous evaluation of measures for the EU Flood Directive and Water Framework Directive.
in-tegrated river management is more complex and dynamic in reality because of the number and diversity of stakeholders and sectors involved, each with their own views, interests, and resources (Mostert et al., 2007; Robinson et al., 2011). The outcome of stakeholder sessions, the preferred measure, will vary depending on the individuals involved in the debate, which possibly leads to a suboptimal solution. We deter-mined the stakeholder preferences a priori (Table 4) and used their preferences and land ownership to position and parame-terize the measures. Our findings suggest that despite varying views of stakeholders, it is useful to model stakeholder pref-erences based on factors such as their role, responsibility, and visions for floodplain management. This provides valuable knowledge for stakeholders prior to or during engagement in multi-stakeholder platforms from the perspective of social learning (Borowski, 2010). The scores per land owner group (LS and AS) provide the stakeholders with a better under-standing of the possibilities and limitations of the solution space. It has the potential to accelerate the decision-making processes because the stakeholder preferences and their in-terdependence are concisely visualized and immediately ap-parent with our methodology. Mutual recognition of interde-pendence and a shared understanding of the possible solu-tions are essential elements in the decision-making process (Ansell and Gash, 2008).
To the best of our knowledge, stakeholder sessions have not been repeated to assess their variation in outcomes be-cause they are time-consuming. Alternatively, the variation in stakeholder processes could be modeled using game theory, or agent-based models, but this is still in its infancy: Samsura et al. (2010) used game theory to extract the strategic deci-sions used by stakeholders, Strager and Rosenberger (2006) integrated GIS with stakeholders preferences in a spatial multicriteria analysis to identify high priority areas for land conservation, and Becu et al. (2003) created an agent-based system of a catchment in northern Thailand, including farm-ers’ individual decisions. They attributed the agents with the availability of water, land, cash, and labor force and focussed on decisions made by farmers, instead of including the pref-erences made by other stakeholders. These studies generally focussed on catchment scale and require substantial adapta-tion before they can be applied in the management of large lowland rivers. Our a priori preferences could serve as input for these types of models, and their output could be used to drive the planning of measures.
In this paper, we used water level lowering as the starting point for the positioning of the measures. An alternative to the owner-specific areas of measure locations could be eco-logical or financial considerations. Ecoeco-logical optimization would involve ranking the ecotopes according to their po-tential biodiversity. High-ranking ecotopes should be left un-touched, whereas ecotopes with a low potential biodiversity are suitable candidates for river restoration measures. Addi-tional weighting of the ranking could be the hydrodynamic roughness or specific taxonomic groups. Likewise, the
loca-tions with high economic value could be left untouched to lower the costs of implementation. All these choices could be implemented as alternatives in the rule-based positioning and parameterization of measures.
The limited capacity within the floodplain area to lower the flood hazard points to the need to create more space for the river and robust measures for additional discharge (Q18) and sea level rise (dh1.8). Our results are useful for developing an integrated river management plan because we provided large-scale boundaries for decision-making at the scale of a river reach. The results can help to argue in favor of estab-lishing multi-stakeholder platforms, such as river basin orga-nizations, collaborative watershed partnerships, stewardship councils (in Dutch Waardschap), and “collaborative supera-gencies” (Fliervoet and van den Born, 2017; Jaspers, 2003; Pratt Miles, 2013; Verbrugge et al., 2017). With such col-laborative structures, the major problem of fragmentation in terms of the number of land owners (Table 1, Fig. 9) could potentially be overcome.
Our methods were limited to the implementation of the measures and the effects on the peak water levels. Several extensions would create additional value for decision sup-port. Firstly, extending flood hazard to flood risk of the pro-tected land would provide insight into the costs of the mea-sures in relation to the avoided losses in the case of inun-dation of the protected land. For this, the failure probability of the embankment should be assessed (Marijnissen et al., 2019) as part of a full flood risk assessment (Vrijling, 2001). Secondly, the altered flow patterns from the measures will give a morphologic response over time in the floodplain and in the main channel. Increased floodplain inundation affects the sediment deposition, with a mean sedimentation rate of 0.13 mm d−1inundation for the floodplains and 2 mm d−1
leading to a maximum increase in water level of 0.6 m for the IJssel distributary of the Rhine (Makaske et al., 2011). The succession positively affects the biodiversity, with a max-imum increase of around 10 % after 30 years. BIOSAFE needs to be updated to include these succession stages, as no ecotope succession model is currently available, and more detailed models (Asaeda et al., 2014; Sanjaya and Asaeda, 2017; van Oorschot et al., 2018; Camporeale et al., 2013) can not yet be linked to BIOSAFE. Fourthly, compensation of land owners that have increased inundation of their land due to the removal of minor embankments could be included just like avoided damage from lower exposure to flood risk in a full cost–benefit analysis. See Mechler and Bouwer (2015) and Di Baldassarre et al. (2015) for further discussion on risk management. Finally, we assumed that all measures are implemented instantaneously, whereas the timing could be made dependent on updated sea level rise projections to opti-mize the measures under uncertainty and avoid unnecessary costs (Postek et al., 2018; Kind, 2014). These potential ex-tensions were beyond the scope of this paper.
6 Conclusions
Adapting large and densely populated deltas to chang-ing hydrodynamic conditions is a dauntchang-ing task, especially since both river restoration and socioeconomic developments compete for space, which prevents a single-objective solu-tion. Careful spatial planning with stakeholder involvement should benefit from the integrated assessment of possible alternatives. We presented a rule-based method for the im-plementation and evaluation of landscaping measures, which was used to evaluate 17 scenarios based on the type of mea-sure, the number of stakeholders involved, and ecological de-sign principles. We found that (1) the traditional measures of flood hazard reduction in the Netherlands, dike raising and roughness lowering, represent the most cost-effective solutions; (2) using natural grassland as the land cover af-ter roughness smoothing and floodplain lowering provides an optimum between improved biodiversity and water level lowering; (3) the two largest stakeholders could effectively lower flood levels as they own 31 % of the groyne field plus floodplain, but the water level lowering from measures in these locations accounted for 34 % to 54 % of the lower-ing due to measures in the whole study area; and (4) only floodplain lowering over the whole area can compensate for the increased discharge and sea level rise at the costs of EUR 1.74 billion and the involvement of 1200 stakeholders.
Our method and its application provide decision makers and local stakeholders with (1) a wide range of measures that either requires the two largest or all of the owners in the area and (2) a standardized quantification of the trade-offs between water level lowering, ecology, and implementation costs. No single measure ranked highest on all attributes, un-derlining the wickedness of the problem. Our approach con-trasts with the detailed analyses carried out in typical prac-tice of river management, which normally considers a single floodplain section at a time due to the governance complex-ity. For these sections detailed plans are made in coopera-tion with stakeholders. Our setup enables fast exploracoopera-tion of pathways at the scale of a whole river reach, which can be adjusted by changing the rules for positioning and parame-terization of the measures. The method can be transported to other regions, such as the Elbe, Mississippi, and Mekong rivers, and upscaled to the entire delta to support sustainable land use planning. Extensions of the method are required to include morphological changes, recurring costs, timing of measures, cost–benefit assessment, and vegetation succes-sion. We argue that our results provide a common ground for any stakeholder meeting, which increases mutual under-standing. Application in real-life stakeholder sessions is re-quired to prove this point. The benefit of our approach lies in the large scale of the measures and the multiple criteria used in the evaluation, which enable higher-quality and more transparent planning with long time horizons. It also shows the future challenges and normative choices that need to be made.
Flood hazard management is embedded in a larger frame-work of river management as guided by international legis-lation (e.g., EU Flood Directive and Water Framework Di-rective). To achieve societal impact and adjust to chang-ing boundary conditions, we need evidence-based and quan-titative trade-offs to weigh the different stakes in soci-ety. With our approach, we are moving away from the traditional hydraulics-only analyses and towards multidis-ciplinary, multi-parametric, multi-objective optimizations for supporting the negotiations among stakeholders in the decision-making process.
Appendix A
Table A1.Nonrecurring costs of measure implementation in unit prices. The unit prices represent the 2015 price level and exclude VAT and indirect costs for engineering, design, and unexpected costs. “kEUR” denotes EUR 1000.
Category Cost item Price Price Unit
per unit standard
deviation
Real estate Acquisition
Agricultural area 6.7 0.8 EUR m−2
Nature areas 1.2 0.2 EUR m−2
Water areas 0.8 0.1 EUR m−2
Built-up areas 190 50 EUR m−2
Individual house 500 120 kEUR per piece
Farms 900 220 kEUR per piece
Business 1400 330 kEUR per piece
Demolition
Individual house 20 3 kEUR per piece
Farm 40 6 kEUR per piece
Business 120 20 kEUR per piece
Earthwork Floodplain lowering
Storage at 25 km 7.2 1 EUR m−3
Additional cost of polluted soil 10.2 3.4 EUR m−3 Earthwork floodplain lowering, local usage 3.1 0.8 EUR m−3 Side channel
Storage at 25 km 8.1 1.2 EUR m−3
Additional cost of polluted soil 10.2 3.4 EUR m−3 Earthwork floodplain lowering, local usage 3.1 0.8 EUR m−3 Minor embankment
Storage at 25 km 6.9 1 EUR m−3
Additional cost of polluted soil 10.2 3.4 EUR m−3 Earthwork floodplain lowering, local usage 1.9 0.5 EUR m−3
Roads and Removal
bridges Bike lane removal, incl. dumping/recycling 14 1 EUR m−2 Road removal, incl. dumping/recycling 27 3 EUR m−2 Bike lane construction (width<2 m) 28 3 EUR m−2 Road construction (width<7 m) 50 10 EUR m−2
Roughness Removal
smoothing Grass mowing and removal 540 170 EUR ha−1
Herbaceous vegetation mowing and removal 810 270 EUR ha−1
Forest clearing and removal 1330 440 EUR ha−1
Groynes Lowering and conversion
Groyne lowering 650 170 EUR m−1
Conversion to longitudinal training dam 1900 390 EUR m−1
Dikes Raising by one meter
Author contributions. The authors’ contributions varied between the following four categories. The contributions to conception and design were MWS 30 %, MGK 20 %, JMF 20 %, JAHK 15 %, and FB 15 %; contributions to data collection were MWS 80 % and JMF 20 %; contributions to data analysis and conclusions were MWS 70 %, MGK 20 %, and JMF 10 %; and the contributions to the pa-per preparation were MWS 60 %, MGK 10 %, JMF 10 %, JAHK 10 %, and FB 10 %.
Competing interests. The authors declare that they have no conflict of interest.
Special issue statement. This article is part of the special issue “Flood risk assessment and management”. It is a result of the EGU General Assembly 2018, Vienna, Austria, 8–13 April 2018.
Acknowledgements. This research is part of the research pro-gramme RiverCare, supported by the domain Applied and Engineer-ing Sciences (AES), which is part of the Netherlands Organization for Scientific Research (NWO), and which is partly funded by the Ministry of Economic Affairs under the Perspective Programme. We thank Mitja Brilly and Holger Sandberg plus the two anony-mous reviewers for their feedback, which significantly improved the paper.
Financial support. This research has been supported by the NWO-TTW (grant no. P12-14).
Review statement. This paper was edited by Cristina Prieto and re-viewed by Mitja Brilly and two anonymous referees.
References
Ackerman, C. T.: GeoRAS, GIS tools for support of HEC-RAS using ArcGIS, USGS, Davis, USA, CACPD-83, 242, 2011. Alfieri, L., Bisselink, B., Dottori, F., Naumann, G., Roo, A., Salamon, P., Wyser, K., and Feyen, L.: Global projections of river flood risk in a warmer world, Earth’s Future, 5, 171–182, https://doi.org/10.1002/2016ef000485, 2016.
Ansell, C. and Gash, A.: Collaborative Governance in The-ory and Practice, J. Publ. Adm. Res. Theor., 18, 543–571, https://doi.org/10.1093/jopart/mum032, 2008.
Asaeda, T., Rashid, M. H., and Abu Bakar, R.: Dynamic Modelling of Soil Nitrogen Budget and Vegetation Colonization in Sedi-ment Bars of a Regulated River, River Res. Appl., 31, 470–484, https://doi.org/10.1002/rra.2802, 2014.
Ayres, A., Gerdes, H., Goeller, B., Lago, M., Catalinas, M., García Cantón, Á., Brouwer, R., Sheremet, O., Vermaat, J., Angelopoulos, N., and Cowx, I.: Inventory of river restoration measures: effects, costs and benefits, eport REFORM-D1.4, 96 pp., available at: https://reformrivers.eu/
inventory-river-restoration-measures-effects-costs-and-benefits (last access: 13 June 2019), 2014.
Baptist, M. J., Penning, W. E., Duel, H., Smits, A. J. M., Geerling, G. W., Van der Lee, G. E. M., and Van Alphen, J. S. L.: As-sessment of the effects of cyclic floodplain rejuvenation on flood levels and biodiversity along the Rhine River, River Res. Appl., 20, 285–297, 2004.
Basisadministratie adressen en gebouwen (National database ad-dresses and buildings): http://www.kadaster.nl/BAG, last access: 28 November 2016 (in Dutch).
Becu, N., Perez, P., Walker, A., Barreteau, O., and Page, C. L.: Agent based simulation of a small catchment water management in northern Thailand: Description of the CATCHSCAPE model, Ecol. Model., 170, 319–331, https://doi.org/10.1016/S0304-3800(03)00236-9, 2003.
Bernhardt, E. S., Palmer, M. A., Allan, J. D., Alexander, G., Barnas, K., Brooks, S., Carr, J., Clayton, S., Dahm, C., Follstad-Shah, J., Galat, D., Gloss, S., Goodwin, P., Hart, D., Hassett, B., Jenkin-son, R., Katz, S., Kondolf, G. M., Lake, P. S., Lave, R., Meyer, J. L., O’Donnell, T. K., Pagano, L., Powell, B., and Sudduth, E.: Synthesizing U.S. River Restoration Efforts, Science, 308, 636– 637, https://doi.org/10.1126/science.1109769, 2005.
Borowski, I.: Social Learning Beyond Multistakeholder Platforms: A Case Study on the Elbe River Basin, Soc. Nat. Resour., 23, 1002–1012, https://doi.org/10.1080/08941920903204307, 2010. Brown, S., Nicholls, R. J., Hanson, S., Brundrit, G., Dearing, J. A., Dickson, M. E., Gallop, S. L., Gao, S., Haigh, I. D., Hinkel, J., Jiménez, J. A., Klein, R. J. T., Kron, W., Lázár, A. N., Neves, C. F., Newton, A., Pattiaratachi, C., Payo, A., Pye, K., Sánchez-Arcilla, A., Siddall, M., Sha-reef, A., Tompkins, E. L., Vafeidis, A. T., van Maanen, B., Ward, P. J., and Woodroffe, C. D.: Shifting perspectives on coastal impacts and adaptation, Nat. Clim. Change, 4, 752–755, https://doi.org/10.1038/nclimate2344, 2014.
Buijs, A. E.: Public support for river restoration. A mixed-method study into local residents’ support for and fram-ing of river management and ecological restoration in the Dutch floodplains, J. Environ. Manage., 90, 2680–2689, https://doi.org/10.1016/j.jenvman.2009.02.006, 2009.
Buijse, A. D., Coops, H., Staras, M., Jans, L. H., Van Geest, G. J., Grift, R. E., Ibelings, B. W., Oosterberg, W., and Roozen, F.: Restoration strategies for river floodplains along large lowland rivers in Europe, Freshwater Biol., 47, 889–907, https://doi.org/10.1046/j.1365-2427.2002.00915.x, 2002. Camporeale, C., Perucca, E., Ridolfi, L., and Gurnell, A. M.:
Modeling The Interactions Between River Morphodynam-ics And Riparian Vegetation, Rev. Geophys., 51, 379–414, https://doi.org/10.1002/rog.20014, 2013.
Cheong, S.-M., Silliman, B., Wong, P. P., van Wesenbeeck, B., Kim, C.-K., and Guannel, G.: Coastal adaptation with ecological engineering, Nat. Clim. Change, 3, 787–791, https://doi.org/10.1038/nclimate1854, 2013.
DeConto, R. M. and Pollard, D.: Contribution of Antarctica to past and future sea-level rise, Nature, 531, 591–597, https://doi.org/10.1038/nature17145, 2016.
Deltares: Delft3D Flexible Mesh Suite: user manual, Deltares, Delft, the Netherlands, Manual version 1.1.0, 384 pp., 2016. De Nooij, R. J. W., Lenders, H. J. R., Leuven, R. S. E. W., De Blust,
G., Geilen, N., Goldschmidt, B., Muller, S., Poudevigne, I., and Nienhuis, P. H.: BIO-SAFE: assessing the impacts of physical reconstruction on protected and endangered species, River Res. Appl., 20, 299–313, 2004.
de Winter, R. C. and Ruessink, B. G.: Sensitivity analysis of climate change impacts on dune erosion: case study for the Dutch Holland coast, Climatic Change, 141, 685–701, https://doi.org/10.1007/s10584-017-1922-3, 2017.
Di Baldassarre, G., Viglione, A., Carr, G., Kuil, L., Yan, K., Brandimarte, L., and Blöschl, G.: Debates – Perspectives on socio-hydrology: Capturing feedbacks between physical and social processes, Water Resour. Res., 51, 4770–4781, https://doi.org/10.1002/2014WR016416, 2015.
Fliervoet, J. M. and van den Born, R. J. G.: From imple-mentation towards maintenance: sustaining collabora-tive initiacollabora-tives for integrated floodplain management in the Netherlands, Int. J. Water Resour. D., 33, 570–590, https://doi.org/10.1080/07900627.2016.1200962, 2017. Fliervoet, J. M., Van den Born, R. J. G., Smits, A. J. M.,
and Knippenberg, L.: Combining safety and nature: A multi-stakeholder perspective on integrated floodplain management, J. Environ. Manage., 128, 1033–1042, https://doi.org/10.1016/j.jenvman.2013.06.023, 2013.
Frings, R. M., Berbee, B. M., Erkens, G., Kleinhans, M. G., and Gouw, M. J. P.: Human-induced changes in bed shear stress and bed grain size in the River Waal (The Netherlands) dur-ing the past 900 years, Earth Surf. Proc. Land., 34, 503–514, https://doi.org/10.1002/esp.1746, 2009.
Geerling, G. W., Kater, E., van den Brink, C., Baptist, M. J., Ragas, A. M. J., and Smits, A. J. M.: Nature re-habilitation by floodplain excavation: The hydraulic effect of 16 years of sedimentation and vegetation succession along the Waal River, NL, Geomorphology, 99, 317–328, https://doi.org/10.1016/j.geomorph.2007.11.011, 2008. Giosan, L., Syvitski, J., Constantinescu, S., and Day, J.:
Cli-mate change: Protect the world’s deltas, Nature, 516, 31–33, https://doi.org/10.1038/516031a, 2014.
Grothmann, T. and Reusswig, F.: People at Risk of Flooding: Why Some Residents Take Precautionary Action While Others Do Not, Nat. Hazards, 38, 101–120, https://doi.org/10.1007/s11069-005-8604-6, 2006.
Hegnauer, M., Beersma, J., Van den Boogaard, H. F. P., Buishand, T. A., and Passchier, R. H.: Generator of rainfall and discharge extremes (GRADE) for the Rhine and Meuse basins, Deltares, Delft, the Netherlands, report 1209424-004, 84 pp., 2014. Hering, D., Borja, A., Carstensen, J., Carvalho, L., Elliott,
M., Feld, C. K., Heiskanen, A.-S., Johnson, R. K., Moe, J., Pont, D., Solheim, A. L., and de Bund, W. V.: The European Water Framework Directive at the age of 10: A critical review of the achievements with recommenda-tions for the future, Sci. Total Environ., 408, 4007–4019, https://doi.org/10.1016/j.scitotenv.2010.05.031, 2010.
Hinkel, J., Lincke, D., Vafeidis, A. T., Perrette, M., Nicholls, R. J., Tol, R. S. J., Marzeion, B., Fettweis, X., Ionescu, C., and Lev-ermann, A.: Coastal flood damage and adaptation costs under
21st century sea-level rise, P. NatL. Acad. Sci. USA, 111, 3292, https://doi.org/10.1073/pnas.1222469111, 2014.
Hübner, C., Ostrowski, M., and Haase, M.: nofdp IDSS-an open source flood control planning Decision Support System, in: 23rd International Conference on Informatics for Environmental Pro-tection, Environmental Informatics and Industrial Ecology, Envi-ronmental Informatics and Industrial EnviEnvi-ronmental Protection: Concepts, Methods and Tools, 9–11 September 2009, Berlin, Germany, edited by: Wohlgemuth, V., Page, B., and Voigt, K., Shaker Verlag, Aachen, Germany, 87–96, 2009.
Jaspers, F. G. W.: Institutional arrangements for integrated river basin management, Water Policy, 5, 77–90, 2003.
Jong, P. and Brink, M. V. D.: Between tradition and in-novation: developing Flood Risk Management Plans in the Netherlands, J. Flood Risk Manag., 10, 155–163, https://doi.org/10.1111/jfr3.12070, 2017.
Kernkamp, H. W. J., Van Dam, A., Stelling, G. S., and de Goede, E. D.: Efficient scheme for the shallow water equations on unstruc-tured grids with application to the Continental Shelf, Ocean Dy-nam., 61, 1175–1188, https://doi.org/10.1007/s10236-011-0423-6, 2011.
Kind, J. M.: Economically efficient flood protection standards for the Netherlands, J. Flood Risk Manag., 7, 103–117, https://doi.org/10.1111/jfr3.12026, 2014.
Koopman, K. R., Straatsma, M. W., Augustijn, D. C. M., Breure, A. M., Lenders, H. J. R., Stax, S. J., and Leuven, R. S. E. W.: Quantifying biomass production for assessing ecosystem ser-vices of riverine landscapes, Sci. Total Environ., 624, 1577– 1585, https://doi.org/10.1016/j.scitotenv.2017.12.044, 2018. Le Bars, D., Drijfhout, S., and De Vries, H.: A high-end
sea level rise probabilistic projection including rapid Antarc-tic ice sheet mass loss, Environ. Res. Lett., 12, 044013, https://doi.org/10.1088/1748-9326/aa6512, 2017.
Lenders, H. J. R., Leuven, R. S. E. W., Nienhuis, P. H., De Nooij, R. J. W., and Van Rooij, S. A. M.: BIO-SAFE: a method for eval-uation of biodiversity values on the basis of political and legal criteria, Landscape Urban Plan., 55, 121–137, 2001.
Makaske, B., Maas, G. J., Van den Brink, N. G., and Wolfert, H. P.: The influence of floodplain vegetation succession on hydraulic roughness: is ecosystem rehabilitation in Dutch embanked flood-plains compatible with flood safety standards?, Ambio, 40, 370– 376, 2011.
Marijnissen, R., Kok, M., Kroeze, C., and van Loon-Steensma, J.: Re-evaluating safety risks of multifunctional dikes with a prob-abilistic risk framework, Nat. Hazards Earth Syst. Sci., 19, 737– 756, https://doi.org/10.5194/nhess-19-737-2019, 2019.
Mechler, R. and Bouwer, L. M.: Understanding trends and projections of disaster losses and climate change: is vul-nerability the missing link?, Climatic Change, 133, 23–35, https://doi.org/10.1007/s10584-014-1141-0, 2015.
Middelkoop, H.: Reconstructing floodplain sedimentation rates from heavy metal profiles by inverse modelling, Hydrol. Pro-cess., 16, 47–64, 2002.
Middelkoop, H. and Van Haselen, C. O. G.: Twice a river: Rhine and Meuse in the Netherlands, RIZA, Arnhem, the Netherlands, report 99.003, 1999.