The Yu.G. Shafer Institute of Cosmophysical Research and Aeronomy, Yakutsk 677980, Russia
Abstract. This report presents a prototype Cherenkov telescope, the observation method of Cherenkov light from extensive air showers (EAS) generated by cosmic rays (CRs) above 1016eV and preliminary observations. The interest in Cherenkov light differential detectors of EAS is caused by the possibility to measure the depth of the cascade maximum, Xmax, and/or the shower age via angular and temporal distributions of the Cherenkov signal. In particular, it was shown, using EAS model simulations, that the pulse width measured at the periphery of the shower, r>300 m, at sea level is pronouncedly connected with Xmax. The Cherenkov detector is a wide-angle telescope working in coincidence with scintillation detectors, integral and differential Cherenkov detectors at the Yakutsk complex EAS.
1. Introduction
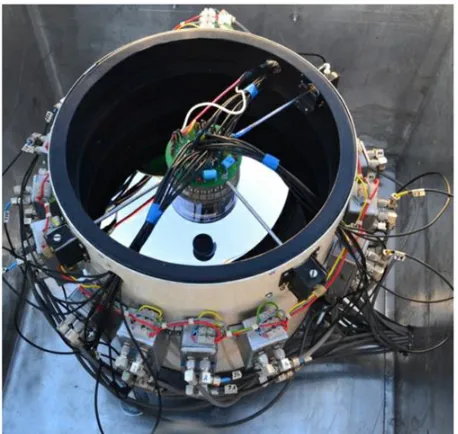
In conjunction with the Yakutsk Extensive Air Shower (EAS) modernization program we have developed a wide field of view Cherenkov telescope (Fig. 1), working in coincidence with scintillation detectors of the array. Currently, a prototype telescope with a photomultiplier (PMT) placed at the focus length of the spherical mirror is undergoing field tests. In this article the parameters and prototype telescope design are described.
The aim of the modernization program of the Yakutsk Extensive Air Shower array is to create an astrophysical instrument capable of measuring in detail the parameters of high energy galactic cosmic rays (CRs), their sources, the energy spectrum and the mass composition. The scheme of the Yakutsk EAS array can be found in Fig. 2. Another goal is to study the transition region between galactic and extragalactic CR components, in which some irregularities in the spectrum and composition can be identified [1]. A crucial role played by the Cherenkov telescope array in this program should be to observe the light emitted by the extensive air showers for measuring the angular and temporal signal structures associated with the cascade curve in showers with energies above E =1015eV [2].
Our intention to develop a Cherenkov telescope functioning as a differential detector of EAS was motivated by the possibility to measure the depth of the cascade maximum and/or the shower age via the angular and temporal distributions of the Cherenkov signal [3]. Combining Xmax and the shower age with other
characteristics measured with the surface detectors of the EAS array, e.g. the energy and muon content, one is able to estimate the average mass composition of CRs. Experimental arguments in elucidating the origin of the knee and ankle in the CR spectrum will significantly strengthen due to the measurements of the angular and temporal distributions of the Cherenkov signal in the energy range above 1015eV. Existing scenarios of CR
ae-mail:[email protected] be-mail:[email protected]
acceleration in the sources are different in the expected model composition around the knee and in the transition region between galactic and extragalactic components [4]. So an accurate estimation of the average mass of the CR nuclei in addition to improved measurements of the sharpness of the knee and ankle should allow us to discriminate some scenarios.
2. Operation algorithm
The PMT in such a prototype telescope is used as the observing camera and placed at the focal length in front of a spherical mirror, see Fig. 1. There are two types of reading out the signal from position-sensitive PMTs: multi-anode and crossed wire anode [5]. Preferences for the former are the uniformity of the output signals and unique location on the anode area. Crossed wire anode signals are less uniform, and location of the signal is not unambiguous in the case of a smeared signal. Nevertheless, we have preferred Hamamatsu R2486 PMT with crossed wire anode for our telescope due to low price and small number of output channels needed, see Fig.3. Indeed, in this case our data acquisition system (DAS) can have 32 independent channels instead of 256 in the multi-anode alternative. In order to reconstruct the signal distribution over the anode surface, one has a system of 32 equations
16
j=1
Vi j =qix,i=1, ..,16, (1)
16
i=1 Vi j =q
y
j,j =1, ..,16, (2)
where Vi j is the unknown signal in a grid knot; qix,q y j are
the output signals of wires. The equations are dependent because of qix=
qiy. If the light source induces
signals in more than one x−and y−wire, then there is an infinite number of solutions of the system. Only in the case of a symmetric signal with a single maximum is there
Figure 1. Wide field of view Cherenkov telescope prototype.
Figure 2. The Yakutsk Extensive Air Shower array scheme.
a possibility to locate the position of the maximum on the anode surface.
We composed a particular solution of the system as:
Vi j =qixq y j/(q
x iq
y
j) (3)
to locate the position of the signal maximum on the anode surface.
Since the radius of the photocathode R2486 equals 3 cm, the mirror diameter was chosen to be 26 cm with a radius of curvature of 22.5 cm. Mirror parameters have been chosen from considerations to ensure as wide a field of view as possible, but so that possible distortions do not exceed the pixel size of 3.8 mm. As a result, the width of the field of view is−14◦≤α≤14◦.
In the design chosen, the telescope provides an effective aperture De f f(00)=21.8 cm due to shadowing
of the mirror by the PMT and the support. The telescope aperture is given in Fig. 4. We calculated the angular dependence as a ratio of the light intensity on the photocathode surface to the initial intensity falling into the actual aperture of the telescope, taking into account the reflectance of aluminum, 92.4%, in the PMT sensitivity intervalλ∈(300,600) nm.
Figure 3. The photo multiplier Hamamatsu R2486 with coordinate-sensitive anode consisting of 16×16 crossed wires has been chosen for the Cherenkov telescope prototype.
Figure 4. Shadowing of the mirror by the PMT and support + cables. The ratio of effective mirror diameter to the unshielded diameter as a function of incidence angle,α.
The signals from each channel of the multi-anode PMTs are continuously input to preamplifiers and onwards to the Analogue to Digital converters and stored in the buffer memory of a 32-channel industrial computer [6]. On the arrival of a trigger generated by the EAS array, an industrial computer saves the accumulated pre-history as a separate file labeled with the time mark and the assignment of a serial number.
We carried out the photomultiplier sensitivity check from plastic scintillator in the voltage range from 900 to 1300 volts and obtained a coordinate-dependent sensitivity of the Photo Multiplier Tube from which we obtained a radial non-uniformity of sensitivity and preamplifiers transition ratio as a function of input signal voltage, see Fig. 5. We also measured the angular dependence of the telescope, the energy spectrum of telescope channels, and found that the Photo Multiplier Tube dark current is minimal at a voltage less than 1300 volts. Currently, the telescope is installed at the Yakutsk EAS array at station obscura-3 at a distance 500 meters from the center of the array, where the field test is run.
Figure 5. Preamplifiers transition ratio as a function of input signal voltage.
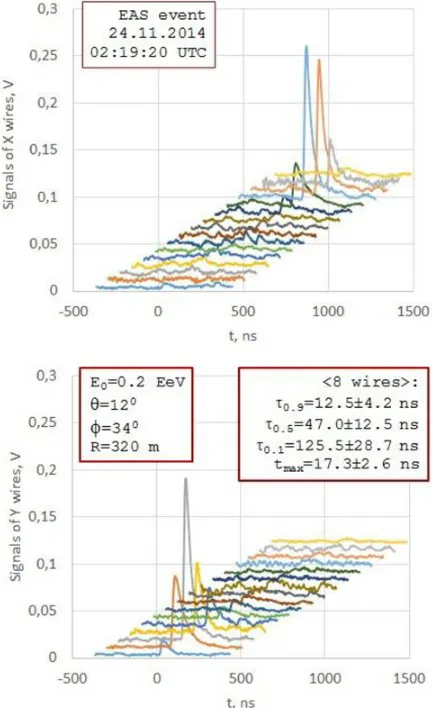
Figure 6. Signals of 32 wires from the multi-anode PMT at the focus of the telescope. The EAS parameters in a particular shower are estimated using data of the surface detectors. Pulse durations (τ) are measured at 0.1, 0.5, 0.9 levels of the pulse maximum Vmax. The time difference (tmax) between Vmax and 0.1 Vmax of the rising signal is shown in the right panel.
3. First results of EAS measurements
with the Cherenkov telescope working in
coincidence with the surface detectors
During the field testing of the telescope in the period from 19.10.2012 to 11.04.2013 we had 604 hours of clear moonless nights that yielded 11124 EAS events detected by the scintillator subset of the array, from which 424 events resulted in a non-zero simultaneous signal
Figure 7. Zenith angle distribution of the shower fraction detected with the telescope.
Figure 8. Axis distance distribution of the shower fraction detected with the telescope.
in the telescope. An additional 277 telescope signals were triggered by the Cherenkov detectors; these will be analyzed later and the results published in a forthcoming paper. From the numbers above (and the array area of 8.2 km2) we determined the effective radius of the
telescope acceptance Re f f =315 m. This radius can be
used in planning the grid of telescopes. The fraction of EAS events detected with a non-zero telescope signal is 3.8%. The dependence of the signal on the zenith angle and the shower axis distance is illustrated in Fig. 8; the primary energies were in the region E0 >1016eV.
While the telescope FOV is 308 sq. degrees (θ∈ (0◦,14◦)), EAS events were detected with zenith angles up toθ=60◦. This observation can be explained by the broad angular distribution of electrons emitted in the shower and photons scattering in the atmosphere. Another contribution is the angular uncertainty of the shower reconstruction procedure, which is considerably increased at the lower threshold energy of the array.
To avoid this uncertainty, we selected showers within
θ <14◦to define a distribution of the shower axes (Fig. 7). The effective radius of the telescope detecting area, Re f f,
is indicated by the arrow on the Riaxis as well.
Figure 9. The Cherenkov pulse shape detected using 32 channels of the telescope DAS: 16 X wires.
Figure 10. The Cherenkov pulse shape detected using 32 channels of the telescope DAS: 16 Y wires.
parameters are averaged over 15 wires for signals that are well above the noise. The parameters of EAS events are reconstructed from the data of the surface detectors of the Yakutsk array.
These data should be corrected for the response of the DAS to estimate the dispersion of the input signal. The measured average RMS deviation of signals in 15 wires in the EAS event under consideration is found to be σout =23.6 ns. The variance of the output signal is
the sum of variances of the input signal and the DAS. Consequently, the RMS deviation of the Cherenkov light signal is estimated as
σC her =
σ2
out−σD AS2 =9±5 ns.
Note that the time constant of Hamamatsu R2486 PMT,
τP M T =5.5 ns [5], is included in the DAS time constant.
When the detector input signal is aδ-function located at ti, the DAS output signal is a function g(t−ti) with
some time constant. An arbitrary input function can be represented as a sum ofδ-functions:
fi n(t)= lim N→∞
N
i=1
fi n(ti)δ(t−ti)=
∞
−∞ fi n(τ)δ(t−τ)dτ.
The detector transforms everyδ-function into g(t−ti)
fout(t)= lim N→∞
N
i=1
fi n(ti)g(t −ti)=
∞
−∞fi n(τ)g(t−τ)dτ.
Hence, mathematically, our detector is equivalent to the linear integral operator with a difference kernel function that transforms fi nto fout.
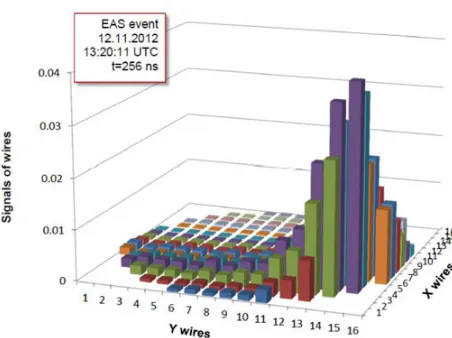
Figure 11. The particular distribution of the Cherenkov signal outputs on the surface of the photo-anode. A grid of wires has a pitch size of 3.75 mm. The distribution is taken at the time t=256 ns after the event trigger when the signal amplitudes are approximately maximum.
The main properties of the convolution operator of interest to us are that the mean values and the variances of the functions are additive:
fout = fi n+g
σ2 fout =σ
2 fi n+σ
2 g.
The angular distribution of the Cherenkov signal is converted by the telescope into the spatial distribution of the signal on the PMT anode surface. Using the position-sensitive PMT, we are able to measure the spatial distribution of the signal. The spatial resolution of the PMT, σR, is connected with the angular resolution σθ∼ σR/F . An example of the spatial distribution of the signal
on the anode surface is given in Fig.11at the moment of the maximal amplitude. We used here a particular solution (Eq. (3)) considering the distribution of the signal on the anode as symmetric, with a single maximum.
The maximum of the light intensity points to the xC her m
position in the atmosphere. Combining it with EAS axis coordinates determined by the scintillation counters of the array, we found the height of the maximum to be
hm ≤ 1300 m, corresponding to xmC her ≥850g/cm2. In
this particular shower, the lower limit to the depth is the result of the maximum of light intensity located at the edge of the telescope aperture.
In general, having a set of WFOV telescopes deployed at the EAS array, one is able to locate the shower maximum based on the angular distribution of the Cherenkov signals detected. Another method of the shower profile reconstruction is evident from the results of Cherenkov pulse shape measurements illustrated in Figs. 9 and10. In this case, the position of the maximum in the temporal spread of signals, tmax, can be connected to the time of
maximal radiation of Cherenkov photons [7].
4. Conclusions
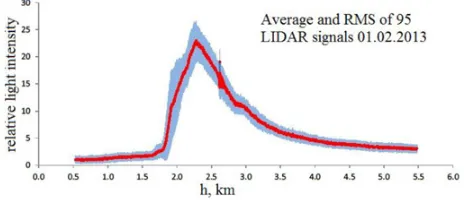
Also, we were able to detect the LIght Detection And Ranging (LIDAR) signal, located at a distance from the Cherenkov telescope. The distance between the LIDAR and the Cherenkov telescope measured by GPS is equal to 490±6 m.
The average LIDAR signal for 95 events shows that the signal amplitude dramatically increases when entering into the aperture of the telescope from 2 km height rather than reaching a maximum value and attenuation according to the square of the distance Fig. 12. The obtained data indirectly confirms the proper functioning of the Cherenkov telescope as a measuring device.
A Cherenkov telescope prototype obtained experimen-tal data for the period from 19.10.2012 to 11.04.2016, on 203 clear moonless nights with about 1500 hours of
Ministry of Education and Science (contracts 02.740.11.0248, 16.518.11.7075). Grant NOFMU academic mobility and Head of Sakha Republic Grant for young scientist 17/16.
References
[1] A.A. Ivanov et al., J. Phys.: Conf. Ser. 012084, 409 (2013) doi: 10.1088/1742-6596/409/1/012084 [2] A.A. Ivanov et al., Astrophys.Space Sci.Trans. 6, 53
(2010) doi: 10.5194/astra-6-53-2010
[3] M.N. Dyakonov et al., Nucl. Instrum. Meth. A 248, 224 (1986)
[4] E.G. Berezhko et al, Astropart. Phys. 36, 31 (2012) [5] http://www.hamamatsu.com/
[6] http://www.rudshel.ru/