Analysis of Watershed Characteristics Using
Remote Sensing and GIS Techniques
Mustaq Shaikh
1, Farjana Birajdar
2Assistant Geologist, R & D Cell, Groundwater Surveys and Development Agency, Pune, Maharashtra, India1
Research Scholar, Centre of Studies in Resources Engineering, Indian Institute of Technology Bombay, Mumbai, Maharashtra, India2
ABSTRACT: Watershed is a natural hydrological entity which allows surface run-off to a defined channel, drainage, stream or river at a particular point. It is the basic unit of water supply, which evolves over time. Morphometric analysis is a quantitative description and analysis of landforms as practiced in geomorphology that applied to a particular kind of landform or to drainage basins. Remote sensing (RS), Geographical Information System (GIS) has proved to be an efficient tool in delineation of drainage pattern and water resources management and its planning. In the present study, GIS and image processing techniques have been adopted for the identification of morphological features and analysing their properties of the Eru river Basin, sub watershed of Mahi river, Rajasthan, India. The basin morphometric parameters such as linear and aerial aspects of the river basin were determined and computed. The study
area covers 71.40 km2 comprising of 3 sub-watersheds. The drainage network of 3 sub-watersheds was delineated using
Landsat ETM remote sensing data and standard Survey of India topographical maps on 1:50,000 scale. The drainage network shows that the terrain exhibits dendritic to sub-dendritic drainage pattern. The highest stream order is fourth order. Estimated drainage density is approximately 1.82 and has very coarse to coarse drainage texture. The mean bifurcation ratio is 3.70 that indicate uniform geological structure and lithologies in watershed area. The investigation has shown that as the order of stream increases total length of stream segments is decreases. Hence, it can be concluded that there is a relationship between stream numbers and stream lengths as per the Horton‟s law of stream length. The elongation ratio shows that Eru river sub-watershed possesses elongated shape pattern. The study showed that GIS
techniques proved to be a competent tool in morphometric analysis.
KEYWORDS: Remote sensing, GIS, Image processing, watershed, morphometric analysis.
I. INTRODUCTION
A watershed is an area of land that drains into a common water body, such as a stream, river or lake. A watershed can also be known as a basin or a catchment area. Human activities have a direct influence on the quality and quantity of surface water, groundwater and other natural resources in the watershed [9]. Watershed comprises surface water, groundwater and other natural resources, which are influenced by human activities. Quality and quantity of downstream has direct connection with the upstream activity of stream. The drainage basin is used as an ideal areal unit for geomorphometric analysis because it has inherent limited, convenient and usually clearly defined and unambiguous topographic unit [7]. Moreover, available in a nested hierarchy of sizes on the basis of stream ordering and an open physical system in terms of inputs of precipitation and solar radiation of drainage basin [6].
Various morphometry parameters needs to measure in a drainage basin include stream order, stream length, stream number, and basin area. Others morphometric parameters are basin shape factor (e.g. circularity ratio, elongation ratio, form factor and compaction ratio), basin perimeter, bifurcation ratios, drainage density, stream frequency and drainage intensity. Morphometric investigation of a watershed gives a quantitative description of the drainage system which is an important aspect of the characterization of watersheds [12].
II. STUDY AREA
Eru river watershed is located at southern part of Rajasthan and covering an area of 71.40 km2 and is located between
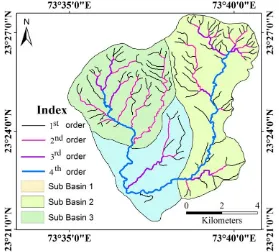
23º35' to 23º45' N latitude and 73º58' to 73º67' E longitude, forming a part of Mahi river basin (Fig. 1). The climate of the area is semi-arid and is characterized by hot summer months with low rainfall.
Fig.1 Location map of study area
III.METHODOLOGY
The study area is analysed for the quantitative morphological analysis of the watershed by using Survey of India Topographical map no. 46 E/11 on the scale 1: 50,000 surveyed during 1962 which is used as a reference, in addition with geocoded FCC of Landsat ETM satellite imagery acquired during 2011. The Topographical map and digital satellite imagery were geometrically rectified and georeferenced using digital image processing software ERDAS IMAGINE 9.3. To extract the drainage layer from the satellite imagery, edge detection and linear enhancement filters were used for enhancing visual interpretation ability of the stream order on satellite image. The ArcGIS 9.3 software is used to delineate the watershed with the digitization of morphometric features and measurement of parameters. Strahler‟s method was used for determination of the hierarchical position of a stream within a drainage basin. Digital
database is created for drainage layer of river basin by assigning the attributes. Morphometric analysis is implemented
to interpret the watershed characteristics such as linear aspects of the drainage network: stream order, bifurcation ratio, stream length and areal aspects of the drainage basin consists form factor ratio, circularity index, elongation ratio, stream frequency, drainage density and texture ratio of the basin were calculated.
IV.RESULTS AND DISCUSSIONS
assessment of regional structures and their trends. The drainage characteristics of Eru river have been analysed with particular reference to fallowing:
MORPHOMETRIC ANALYSIS
Morphometry study constitutes measurement and mathematical analysis of the configuration of the earth‟s surface and the shape and dimensions of its landforms [1]. GIS techniques are used to compute and measure the morphometric parameters (Table 2 and 3) includes bifurcation ratio, stream length, form factor, circulatory ratio and drainage density etc.
Linear aspects of the basin:
Stream order:
The order of the stream is based on the connection of tributaries. Stream order is used to represent the hierarchical link among stream segments and allows drainage basins to be classified according to size. Stream order is a fundamental property of stream networks as it relates to the relative discharge of a channel segment. A number of stream-ordering systems in the present study have been used which was formulated by Arthur N. Strahler. According to the author [13], first order streams are having no stream tributaries and that flows from the stream source. A second-order segment is created by joining two first-order segments, a third-order segment by joining two second order segments, and so on. There is no increase in order when a segment of one order is connected by some other lower order. Strahler‟s stream order has been applied by many researchers for river systems. The highest stream order observed in the present study area is fourth order out of 162 observed streams. 114 first order, 36 second order,10 third order and 2 fourth order streams were observed. Dendritic drainage pattern formed by the interlinking of streams is observed in the study area which indicates the homogeneity in texture and lack of structural control. Dendritic drainage has a spreading, tree-like pattern with an irregular branching of tributaries in many directions and with any angle. It is observed from the Table 2, that the maximum frequency is in case of first order streams. It is noticed that there is a decrease in stream frequency as the stream order increases (Table 1).
Sub-Basin Area in
Km2 1st order stream 2nd order stream 3rd order stream 4th order stream Total
No. Length
in kms No.
Length
in kms No.
Length
in kms No
Length
in kms No.
Length in kms
First 23.60 46 26.31 16 19.29 3 4.59 1 4.89 66 55.57
Second 30.52 59 38.52 18 10.66 6 6.30 1 1.10 84 56.58
Third 17.28 9 7.6 2 3.06 1 3.11 12 13.80
Total 71.40 114 72.26 36 32.82 10 13.80 2 5.91 162 125.95
BIFURCATION RATIO
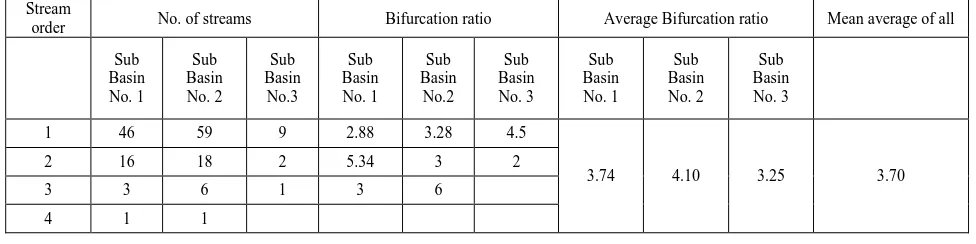
In morphometric analysis a generally used topological property is the bifurcation ratio. It is the ratio between the number of stream segments of one order and the number of the next higher order. A mean bifurcation ratio is usually used because the ratio values for different successive basins will vary slightly [5]. With relatively homogeneous lithology, the bifurcation ratio is normally not more than 5 or less than 3. The lower bifurcation ratio values are characteristics of the watersheds which have suffered less structural disturbances [13]. Bifurcation ratio, speculated to be controlled by drainage density, stream entrance angles, lithological characteristics, basin shapes, basin areas etc.
Table 2: Bifurcation ratios for 3 sub basins
Stream
order No. of streams Bifurcation ratio Average Bifurcation ratio Mean average of all
Sub Basin No. 1 Sub Basin No. 2 Sub Basin No.3 Sub Basin No. 1 Sub Basin No.2 Sub Basin No. 3 Sub Basin No. 1 Sub Basin No. 2 Sub Basin No. 3
1 46 59 9 2.88 3.28 4.5
3.74 4.10 3.25 3.70
2 16 18 2 5.34 3 2
3 3 6 1 3 6
4 1 1
STREAM LENGTH
GIS technique is used to count the number of streams of various orders in a sub-watershed and to measure their lengths from mouth to drainage divide (Table 1). The stream length has been computed based on the law proposed by Horton [5]. Generally, the total length of stream segment is maximum in first order streams and decreases as the stream order increases. Total lengths of 3 sub basins are 55.57, 56.58 and 13.80 km respectively.
AREAL ASPECTS OF THE BASIN
Geometry of Basin shape
Horton’s form factor (F) [4]
Form factor is defined as the ratio of the area of the basin to the square of the length of the basin. The value of „F‟ generally changes from 0 (highly elongated shape) to 1 (perfect circular shape). Therefore, higher the value of form factors, more the circular the shape of basin and vice-versa.
A
F = ---
L2
Horton‟s form factor for 3 sub basins is 0.008, 0.009, and 0.010 respectively. The present sub basins are having values near to 0 rather than 1. Thus, shapes of the all sub basins are more or less elongated. Elongated basins with low form factor indicate that the basin will have a flatter peak of flow for longer duration. Flood flows in elongated basins are easier to control than of the circular basins.
V.C. Millers Circularity Index (C) (1953)
Circulatory index is the ratio between the area of the basin and the area of the circle having the same perimeter as that of the basin.
Area of the basin
C = --- Area of the circle with same perimeter as the basin
The value of „C‟ generally changes from 0 (a line) to 1 (circle). The higher the value of „C‟, more the circular shape of the basin and vice versa. The value of „C‟ Circularity index of 1st, 2nd and 3rd sub basins is 0.042, 0.038, and 0.039 respectively.
S.A. Schumm’s (1956) Elongation ratio (R)
Elongation ratio (R) is the ratio between the diameter of the circle having the same area (as that of the basin) and the maximum length of the basin.
Diameter of the circle with same area as basin
R = --- Basin length
Or
II F = ---R2
4
The values of „R‟ for 1st, 2nd and 3rd sub basins are 0.098, 0.110 and 0.340 respectively.
Stream frequency (Fs)
Stream frequency is the measure of number of streams per unit area also called drainage frequency [5]. Stream frequency of basin area is 2.27 and that of 3 sub basins are 2.80, 2.75, 0.70 respectively. Stream frequencies primarily
depend on lithology of the basin and the texture of drainage network. The sub basins 1st and 2nd having poor categories
of stream frequency and that of sub basin 3rd is very poor.
Drainage Density (Dd)
Drainage density is the most important property of drainage morphometry, which is the total stream length of channel per unit area of drainage basin [5]. Drainage density is a measure of how frequently streams occur on the land surface. It reflects a balance involving erosive forces and the resistance of the ground surface, and is thus related directly to
climate, precipitation, permeability, lithology, and vegetation [2]. A drainage density varies from less than 5 km/km2
than 500 km/km2 in upland areas are possible where rocks are impermeable, slopes are steep, and high rainfall. The drainage density of overall basin is 1.70 and for sub basins 1st, 2nd, 3rd are 2.4, 1.9, 0.8 respectively.
Table 3: Areal aspects of the basin
Sub Basin Drainage
Density Form factor Circularity Index Elongation ratio Stream frequency Drainage texture
First 2.4 0.008 0.042 0.098 2.80 6.72
Second 1.9 0.009 0.038 0.110 2.75 5.23
Third 0.8 0.010 0.039 0.340 0.70 0.56
Drainage Texture
The drainage texture depends upon a number of natural factors such as climate, rainfall, vegetation, rock and soil type, infiltration capacity, relief and stage of development [11]. Drainage texture is used to indicate relative spacing of the streams in a unit area along a linear direction [9]. The soft or weak rocks unprotected by vegetation produce a fine texture, whereas massive and resistant rocks cause coarse texture [8]. The finer drainage textures observed in arid climatic condition and coarser is in a humid climate. The texture of a rock is commonly dependent upon vegetation type and climate. Drainage texture is the product of Drainage density and stream frequency. The drainage texture of the whole basin is 4.17, while those of the 3 sub-basins are 6.72, 5.23 and 0.56 respectively (Table 3). The first sub basin is showing good relationship with drainage texture than second and third sub basin.
V. CONCLUSION
In the present study, morphometric features of drainage are identified and mapped by satellite remote sensing data in conjunction with GIS software. GIS techniques used to study the Eru river basin proves to be competent tools in morphometric analysis and provide very high accuracy of mapping & measurement. The drainage density and stream frequency are the decisive factor for the morphometric classification of drainage basins. These are controllers of the runoff pattern, sediment yield and other hydrological parameters of the drainage basin. The drainage density of Eru river watershed, and sub-basins, reveal that the subsurface strata are permeable. This is a characteristic feature of coarse drainage as the density values are less than 5.0. The highest order of stream is fourth order. The numbers of lower order streams are more than the higher order streams. The low value of bifurcation ratio (3.25- 4.10) indicate that the drainage of the basin is not affected by structural disturbances. This is possibly due to small area occupancy of the sub basin. The steam length decreases with the order increases. The morphometric analysis shows that the basin is having elongated in shape. Drainage network of the basin exhibits as mainly dendritic type which indicates the homogeneity in texture and lack of structural control.
REFERENCES
[1] Clarke, J.I., "Morphometry from maps. In Essays in geomorphology", G.H. Dury (ed.), pp. 235–74. London; Heinemann.1966.
[2] Chorley, R.J.,"Models in Geomorphology, in Physical and Information Models in Geography edited by R.J. Chorley and P. Haggett, Methuen and Co. Ltd., pp 57-96.1967.
[3] Chorley, R. J. “Introduction to physical hydrology.” Methuen and Co. Ltd., Suffolk. pp.211.1969.
[4] Horton, R. E. “Drainage basin characteristics”. Am.Geophys. Union, Trans. 13, 348–352.
[5] Horton, R. E. “Erosional development of streams and their drainage basins: Hydrophysical approach to quantitative morphology”. Geol. Soc.Am. Bull.56: 275-370, 1945.
[6] Leopold, L.B.” River channel changes with time: an example”.Geol. Soc.Am.Bull. 84, 1845–60, 1973.
[7] Martínez-Casasnovas, J.A., Stuiver, H.J., Automatic delineation of drainage networks and elementary catchments from Digital Elevation Models. International Journal of Aerospace Survey and Earth Sciences (ITC Journal), 1998-3/4: 198-208. 1998.
[8] Morgan, R.P.C.” The role of climate in the denudation system: a case study from West Malaysia”. In Geomorphology and climate, E. Derbyshire (ed.), 319– 44.1976.
[9] Singh, S., Srivastava, R.,“Morphometric determinants of the stage of cycle or erosion.”The Geographic Observer, Vol. 12, pp, 31-44. 1976.
[10] Singh, S. “Geomorphology” Prayag pustak bhawan Allahabad.
[11] Smith, K.G. “Standards for grading texture of erosional topography”. Am. J. Sci. 248, 655–68.1950.