P R O C E E D I N G S
Open Access
Modeling methylation data as an additional
genetic variance component
Marcio Almeida
1*†, Juan Peralta
1,2, Jose Garcia
1, Vincent Diego
1†, Harald Goring
1, Sarah Williams-Blangero
1and John Blangero
1†FromGenetic Analysis Workshop 20 San Diego, CA, USA. 4 - 8 March 2017
Abstract
High-throughput platforms allow the characterization of thousands of previously known methylation sites. These platforms have great potential for investigating the epigenetic effects that are partially responsible for gene expression control. Methylation sites provide a bridge for the investigation of real-time environmental contributions on genomic events by the alteration of methylation status of those sites. Using the data provided by GAW20’s organization committee, we calculated the heritability estimates of each cytosine-phosphate-guanine (CpG) island before and after the use of fenofibrate, a lipid-control drug. Surprisingly, we detected substantially high heritability estimates before drug usage. This somewhat unexpected high sample correlation was corrected by the use of principal components and the distributions of heritability estimates before and after fenofibrate treatment, which made the distributions comparable. The methylation sites located near a gene were collected and a genetic relationship matrix estimated to represent the overall correlation between samples. We implemented a random-effect association test to screen genes whose methylation patterns partially explain the observable high-density lipoprotein (HDL) heritability. Our leading association was observed for theTMEM52gene that encodes a
transmembrane protein, and is largely expressed in the liver, had not been previously associated with HDL until this manuscript. Using a variance component decomposition framework with the linear mixed model allows the integration of data from different sources, such as methylation, gene expression, metabolomics, and proteomics. The decomposition of the genetic variance component decomposition provides a flexible analytical approach for the challenges of this new omics era.
Background
The identification of reliable genetic factors associated with phenotypes of interest is the major goal of large gen-etic and epidemiologic projects. The immense number of multiple hypotheses tested and the confounding effects of environmental contribution jeopardize this identification [1]. The correct modeling of the environmental contribu-tion to a trait of interest is very challenging as it is almost impossible to control modeling of the environmental
contribution in study design using human samples. The assessment of genome-wide methylation patterns provides an interesting bridge to understanding the epigenetic ef-fects and, consequently, the environmental contribution to any phenotypes being studied. Highly methylated DNA sequences have a significant repressive role in the control of the expression of nearby genes. The presence of meth-ylated terminals on those sites represses the transcription machinery assembly and, consequently, the expression of a target gene. The fine control of gene expression has a considerable impact on messenger RNA transcription and, consequently, on protein production. Genome-wide methylation platforms enable the simultaneous analysis of hundreds of thousands of suitable methylated sites that are dispersed across the human genome. This type of data has been used by various epigenetic-wide association * Correspondence:[email protected]
†Marcio Almeida, Vincent Diego and John Blangero contributed equally to
this work.
1South Texas Diabetes and Obesity Institute, University of Texas Rio Grande
Valley School of Medicine, One West University Blvd., STDOI Modular Building #100, Brownsville, TX 78520, USA
Full list of author information is available at the end of the article
studies for the identification of differentially methylated cytosine-phosphate-guanine (CpG) sites associated with diseases, clinical outcomes, environmental exposures, or other experimental conditions [2]. Despite their clear po-tential, the incorporation of methylation data in a genetic analytical framework is still debatable and open for alter-native approaches [3].
The GAW20 challenged the scientific community to propose and test different analytical methods to be ap-plied at the genetic and epigenetic data shared by the Genetics of Lipid Lowering Drugs and Diet Network (GOLDN) initiative [4, 5]. The status of methylation sites near genes were collected and for each gene we cal-culate a pairwise genetic relationship matrix (GRM) be-tween samples. These gene-specific GRMs represent the covariance between methylation sites surrounding a gene and are a simplified representation of the transcrip-tional control acting on this gene. These gene-specific GRMs were tested as additional genetic variance compo-nents to explain phenotypic variability for the real high-density lipoprotein 2 (HDL2) phenotype as shared by GAW20 organization [5]. Gene-specific GRMs re-sponsible for a considerable proportion of HDL pheno-typic heritability were selected. No GRM-based association tested reached the desired multiple hypoth-esis corrected threshold and the best candidate identified was the geneTMEM5using the methylation data before use of fenofibrate. This candidate gene encodes a trans-membrane protein and was implicated with the liver en-zymatic repertoire, but until our study, it had not been associated with hypercholesteremia. Genetic variance component decomposition offers the required flexibility to incorporate different sources of biological data [6]. The biological data integration is challenging, but, at the same time, has great potential to improve our under-standing of the different molecular layers acting in a phenotype of interest.
Methods
Heritability estimation of methylated genomic sites The additive heritability estimate was calculated for each methylated site using the polygenic routine implemented
in SOLAR [7]. The methylation sites were
inverse-normalized and before and after fenofibrate heri-tabilities were estimated on each site and their distribu-tions were compared to evaluate overall differences in genome-wide methylation patterns resulting from the fenofibrate use.
Principal component analysis of methylation data
The complete set of inversed-normalized methylation sites was randomized and a subset of 10% of them was selected. Principal components were estimated, using native R implementation, for the selected subset of
methylation sites [8]. The first 20 principal components were obtained and used to decorrelate the methylation data before and after the use of fenofibrate.
Calculation of gene-specific GRM using methylation data
Using the annotation data provided by GAW20
organization, we defined the complete set of methylation sites mapped to each gene. This information was used as input for anin-houseprogram that calculates the correl-ation between individuals based on the status of their re-spective methylation sites for each gene. The gene-specific methylation sites collected were standard-ized and a matrixZ was defined. A covariance matrixR was derived fromZ asR=Z*ZTwhereZTis the trans-pose of Z. A scaling transformation was applied toZto ensure that all diagonal elements equaled 1. The result-ing matrix, K, was our gene-specific covariance kernel [9]. The kernels represent the pairwise sample covari-ance estimates and these matrices are introduced as add-itional variance components of phenotypic variability into a linear mixed model [6].
Linear mixed model with an additional methylation component
A new variance component parameter was added into a standard pedigree-based variance component model,
Ω ¼ σ2Totalð2ϕh2
r þ2Eh2methþIe2Þ, where Ω is the
phenotypic covariance matrix; σ2
Total is the total
phenotypic variance; nd h2r, h2meth, and e2, respectively,
represent the proportion that can be attributed to the residual additive effect of polygenes, the gene-specific methylation kernel effect, and a random environmen-tal effect. Several critical structuring kernels are employed to model the covariances between individ-uals: Φ is the expected kinship matrix integrated from the pedigree;E is the empirically estimated gene specific methylation GRM; and I is the identity matrix. Such kernel-based approaches to test the combined effect of multiple genetic variants were proposed decades ago [10] and have grown in popularity recently [11,12].
Maximum likelihood estimates (assuming a multi-variate normal probability density) and likelihood ra-tio test (LRT) of the h2meth parameter was obtained using an extension of the polygenic command in SOLAR, independently for each gene-specific GRM. The significance of each GRM was obtained by LRT using a null model Ω ¼ σ2Totalð2ϕh2
rþIe2Þ as
which matches the methylation data collection. We used sex and age covariates on the linear mixed model.
Results
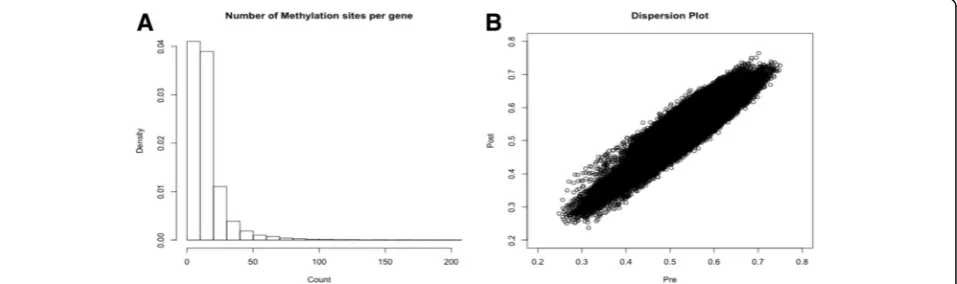
Statistical properties of the genome-wide methylated sites A set of 463,996 unique methylation sites were shared by the GAW20 organization, and using the annotation pro-vided, we defined a subset of 349,755 sites linked to at least 1 gene. The methylation data was collected in a set of 990 individuals before fenofibrate usage and 520 individuals after the lipid drug treatment. We identified 22,313 genes with at least 1 methylation site and 80% of the genes had fewer than 20 methylation sites (Fig.1a). The mean methy-lation intensities of each site were compared before and after fenofibrate treatment (Fig. 1b). The correlation be-tween methylation sites pre- and posttreatment was pro-nounced (Pearson correlation = 0.93). The majority of methylated sites is expected to show low to modest herit-ability estimates. These sites represent responsive genomic elements and provide the molecular bridge between the en-vironmental contribution and fine gene-expression control. To test this premise, we calculated the narrow sense herit-ability estimate of each methylation site on the 2 time points shared. The distributions of heritabilities estimates (Fig.2) showed a substantial difference and, specially, unex-pectedly high heritability estimates before fenofibrate treat-ment (Fig. 2a). We hypothesized that the high heritability estimates were caused by a batch effect, during experimen-tal or data processing. We calculated the first 20 principal components (PCs) of methylation data before and after use of fenofibrate. The PCs were added, as covariates, in the lin-ear model and new heritability estimates were calculated (Fig. 2c and d). The addition of PCs was successful and newh2distributions were comparable (Fig.2aandc). The corrected heritability estimates are much closer than the ones observed in similar studies using methylation data [13].
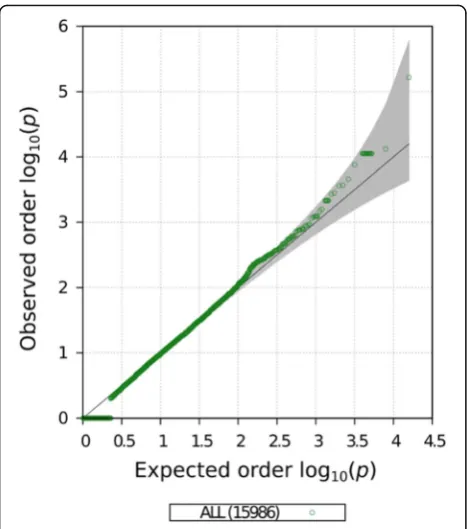
We constructed gene-specific GRM using the PC ana-lysis corrected methylation sites linked to each gene be-fore and after fenofibrate treatment. The covariance GRMs were estimated for a set of 15,596 genes that pre-sented at least 5 methylation sites annotated to it. This minimum number of methylation sites is a requirement to construct valid GRMs as genes with few methylation site measurements could generate high pairwise correl-ation scores as a result of the lack of informcorrel-ation. The contribution of each gene-specific GRM to the pheno-typic variability of HDL phenotype was tested using a LRT in the second and fourth time points matching the methylation data collections. No gene-specific–based as-sociation tested reached the required multiple hypothesis corrected significance threshold (1.35 × 10⁻⁶) in either time point analyzed. The association results for the GRMs calculated before fenofibrate use are presented in Figs.3and4. We identified an interesting association on the gene TMEM5 (p< 5.9 × 10⁻⁵). This gene encodes a highly conserved transmembrane protein almost exclu-sively expressed in the pancreatic tissue, but until our study, had not been associated with HDL blood concen-tration [14]. The status of methylation sites near
TMEM5 could explain almost 4% of the observed
phenotypic variability of HDL. The association statistic distribution was not inflated nor deflated (Fig. 4). The TMEM5is an interesting candidate gene but requires an independent replication on similar studies.
Discussion and conclusions
The correct modeling of genetic and environmental components is a pivotal step in the identification of reli-able associations between genetic markers and pheno-types of interest. In general, the environmental component is overlooked and is assumed shared be-tween individuals to simplify the analytical framework applied [4]. Genome-wide methylation arrays were de-signed to capture the methylation status of thousands of
previously detected methylation sites. These platforms measure an active layer of transcriptional control where methylated CpG islands in gene promoters interact with transcription complex machinery and allow a fine con-trol of gene expression. Highly methylated promoter se-quences tend to repress gene expression by negatively interacting with nuclear transcription machinery [15]. The gene expression control, mediated by methylation interaction, provide a promising bridge between envir-onment contribution and real-time molecular re-sponses to those insults. Large genetic projects
collected epigenetic data to try to identify differen-tially methylated sites associated with disease states, clinical outcomes, environmental exposures, or other experimental conditions [2, 15]. Despite their poten-tial, the correct modeling for the incorporation of methylation data in a genetic analytical framework is debatable and it became one of the main topics for GAW20 workshop [5].
In this article, we model methylation data using gene-specific GRMs carrying the pairwise samples co-variance between methylation sites flanking 15,596 genes Fig. 2Histogram methylation site heritability estimates.aBefore fenofibrate treatment.bAfter fenofibrate treatment.cBefore fenofibrate drug treatment corrected by PC analyses.dAfter fenofibrate treatment correct by PC analyses
dispersed throughout the human genome. The contribu-tion of each GRM for the HDL phenotypic variability was defined using a LRT association test comparing 2 models with and without this added methylation term. We didn’t detect any association that reached the mul-tiple hypothesis corrected significance threshold on ei-ther time point. Our best candidate was an interesting association between the gene TMEM5 and HDL before the use of fenofibrate. Methylation sites flanking this candidate gene were able to explain almost 4% of the trait’s phenotypic variability. These results highlight the relevance of the epigenetic layer of information flanking this gene and its impact on the overall HDL plasmatic concentration. The gene TMEM5 encodes a Type II transmembrane protein with glycosyltransferase function and is expressed almost exclusively at pancreatic tissue [14, 16]. The TMEM5 gene has been associated with cobblestone lissencephaly, but it has never been associ-ated with human hypocholesteremia previously [17]. This is a preliminary finding and requires an independ-ent validation [12].
Phenotypic variance component decomposition, the model presented in this article, offers the desired flexibil-ity to combine different sources of information contrib-uting to a phenotype under study [6]. The use of covariance kernels to combine the individual contribu-tions of single-nucleotide polymorphisms has gained a lot of attention lately with the advent of the new cost-effective whole-genome sequencing platforms [11].
These platforms allow the collection of a very dense panel of genetic variations and these alternative ap-proaches are necessary to reduce the burden imposed by the astronomical number of independent statistical tests performed. The combination of different sources of bio-logical data, such as epigenetic, transcriptomic,
prote-omic, and metabolomics, will improve our
understanding of the biological phenomenon. Different sources of biological data can be interpreted as variance components of the observable phenotypic variability of a trait of interest. Combination of this difference sources will improve our knowledge about the molecular players acting on a phenotype and will aid the development of a new generation of personalized drugs.
Acknowledgements
The authors would like to acknowledge the GAW20 organization for the workshop held in San Diego/CA/USA in 2017 and for the sharing of such rich data with the participants.
Funding
Publication of this article was supported by NIH R01 GM031575. The authors were supported by their own research funding and did not receive any financial support from pharmaceutical companies.
Availability of data and materials
The data that support the findings of this study are available from the Genetic Analysis Workshop (GAW) but restrictions apply to the availability of these data, which were used under license for the current study. Qualified researchers may request these data directly from GAW. All algorithms used in this scientific manuscript are available upon request.
About this supplement
This article has been published as part of BMC Proceedings Volume 12 Supplement 9, 2018: Genetic Analysis Workshop 20: envisioning the future of statistical genetics by exploring methods for epigenetic and
pharmacogenomic data. The full contents of the supplement are available online at https://bmcproc.biomedcentral.com/articles/supplements/volume-12-supplement-9.
Authors’contributions
MA was responsible for delineation of the study, development of analytical routines, data analysis, and manuscript draft. JP was responsible for principal component estimation from inverse-normalized methylation levels, construc-tion of the algorithm for the covariance matrix calculaconstruc-tion from methylaconstruc-tion data, and manuscript revision. JG, GH, SW-B, and JB were responsible for de-lineation of the study and manuscript revision. DV was responsible for delin-eation of the study, development of the analytical proposition, and manuscript revision. All authors read and approved the final manuscript.
Ethics approval and consent to participate Not applicable.
Consent for publication Not applicable.
Competing interests
The authors declare that they have no competing interests.
Publisher’s Note
Springer Nature remains neutral with regard to jurisdictional claims in published maps and institutional affiliations.
Author details
1South Texas Diabetes and Obesity Institute, University of Texas Rio Grande
Valley School of Medicine, One West University Blvd., STDOI Modular Fig. 4Quantile–quantile (Q-Q) plot of gene-specific GRM association
Building #100, Brownsville, TX 78520, USA.2Menzies Institute for Medical
Research, University of Tasmania, 17 Liverpool Street, Hobart, TAS, Australia.
Published: 17 September 2018
References
1. Almeida M, Blondell L, Peralta JM, Kent JW Jr, Jun G, Teslovich TM, Fuchsberger C, Wood AR, Manning AK, Frayling TM, et al. Independent test assessment using the extreme value distribution theory. BMC Proc. 2016; 10(Suppl 7):245–9.
2. Dauncey MJ. Genomic and epigenomic insights into nutrition and brain disorders. Nutrients. 2013;5(3):887–914.
3. Zhao N, Bell DA, Maity A, Staicu AM, Joubert BR, London SJ, Wu MC. Global analysis of methylation profiles from high resolution CpG data. Genet Epidemiol. 2015;39(2):53–64.
4. Day K, Waite LL, Alonso A, Irvin MR, Zhi D, Thibeault KS, Aslibekyan S, Hidalgo B, Borecki IB, Ordovas JM, et al. Heritable DNA methylation in CD4+
cells among complex families displays genetic and non-genetic effects. PLoS One. 2016;11(10):e0165488.
5. Aslibekyan S, Almasy L, Province MA, Absher DM, Arnett DK. Data for GAW20: genome-wide DNA Seq variation and epigenome-wide DNA methylation before and after fenofibrate treatment in a family study of metabolic phenotypes. BMC Proc. 2018;12(Suppl 9)https://doi.org/10.1186/ s12919-018-0114-0.
6. Almeida M, Peralta JM, Farook V, Puppala S, Kent JW Jr, Duggirala R, Blangero J. Pedigree-based random effect tests to screen gene pathways. BMC Proc. 2014;8(Suppl 1):S100.
7. Blangero J, Diego VP, Dyer TD, Almeida M, Peralta J, Kent JW Jr, Williams JT, Almasy L, Göring HH. A kernel of truth: statistical advances in polygenic variance component models for complex human pedigrees. Adv Genet. 2013;81:1–31.
8. R Core Team. R: A Language and Environment for statistical computing. Vienna: R Foundation for Statistical Computing; 2015.
9. Peralta JM, Almeida M, Abraham LJ, Moses E, Blangero J. Finding potential cis-regulatory loci using allele-specific chromatin accessibility as weights in a kernel-based variance component test. BMC Proc. 2016;10(Suppl 7):103–8. 10. Hopper JL, Mathews JD. Extensions to multivariate normal models for
pedigree analysis. Ann Hum Genet. 1982;46(Part 4):373–83.
11. Wu MC, Lee S, Cai T, Li Y, Boehnke M, Lin X. Rare-variant association testing for sequencing data with the sequence kernel association test. Am J Hum Genet. 2011;89(1):82–93.
12. Chen H, Meigs JB, Dupuis J. Sequence kernel association test for quantitative traits in family samples. Genet Epidemiol. 2013;37:196–204. 13. Kulkarni H, Kos MZ, Neary J, Dyer TD, Kent JW Jr, Göring HH, Cole SA,
Comuzzie AG, Almasy L, Mahaney MC, et al. Novel epigenetic determinants of type 2 diabetes in Mexican-American families. Hum Mol Genet. 2015; 24(18):5330–44.
14. Wang J, Huo K, Ma L, Tang L, Li D, Huang X, Yuan Y, Li C, Wang W, Guan W, et al. Toward an understanding of the protein interaction network of the human liver. Mol Syst Biol. 2011;7:536.
15. Moris MR, Latiff F. The epigenetic landscape of renal cancer. Nat Rev Nephrol. 2017;13(1):47–60.
16. Clark HF, Gurney AL, Abaya E, Baker K, Baldwin D, Brush J, Chen J, Chow B, Chui C, Crowley C, et al. The secreted protein discovery initiative (SPDI), a large-scale effort to identify novel human secreted and transmembrane proteins: a bioinformatics assessment. Genome Res. 2003;13(10):2265–70. 17. Vuillaumier-Barrot S, Bouchet-Séraphin C, Chelbi M, Devisme L, Quentin S,