CHIASMA INTERFERENCE I N TRILLIUM ERECTUM
H. B. NEWCOMBE' McGill University, Montreal, Canada
Received September 19, 1940
INTRODUCTION
T has been shown by BELLING (1929), DARLINGTON ( I ~ o ) , and others
I
that the chiasmata in certain cytological configurations must have been accompanied by genetic crossing-over. However, it is not yet fully established that all chiasmata represent crossovers. To demonstrate the complete concomitance of chiasma formation and crossing-over it is neces- sary to show them to be similar in as many different ways and under as many different conditions as possible.It has been shown that chiasma formation and crossing-over may be similarly affected by environmental factors both internal and external. For reviews see DARLINGTON (1937) and MATHER (1938). Further, HAL-
DANE (1931) has shown that interference similar in one respect to that
between crossovers occurs also between chiasmata. He found that variabil- ity in the number of chiasmata per bivalent is less than would be expected were chiasmata independent of one another in their formation. However, a detailed analysis of cytological interference can be made only by dividing the chromosomes into regions similar to those separated by genetic markers and recording accurately the positions of individual chiasmata in these regions. This was not possible with the observational data used by Haldane. Such a study has been carried out with Trillium erectum on preparations which show clearly the space relationships of the four chromatids in each bivalent (HUSKINS and NEWCOMBE 1941). Further, this material has (I) long chromosomes, ( 2 ) a relatively high chiasma frequency, (3) only five
bivalents, each of which may be identified by its length and the position of its attachment region, and (4) no indication of terminalization or other movement of chiasmata during prophase (although the possibility that minor changes in position do occur cannot be entirely ignored).
MATERIALS AND METHODS
The preparations were those used by HUSKINS and NEWCOMBE (1941). I n this material coiling is reduced, and the chromatids are clearly dif- ferentiated. This latter is particularly important, since in ordinary bulk- stained preparations it is often impossible to determine whether a region of contact between homologous chromosomes represents one or two chias- mata. I n studying interference it is, of course, of the utmost importance
1 National Research Council of Canada Scholar 1938-39.
that when two chiasmata occur close together they shall not be mistaken for a single chiasma.
I n order to obtain values of chiasma coincidence in Trillium, each chromosome of the complement was divided into a definite number of sec- tions equal to approximately one micron. The sub-terminally-attached A
chromosome, for instance, varies in length in different cells and prepara- tions from IO to 17p. Since the average length was 1 2 . 2 ~ in our material,
each individual A chromosome was divided into twelve equal regions re- gardless of its length. In a chromosome of average length each region would be 1 . 0 2 ~ long. Each arm of the four remaining chromosomes, all
of which have median or sub-median attachments, was treated in a similar manner. Thus the attachment was made to separate two regions rather than to occur within one of them.
It has thus been possible to divide the Trillium chromosomes into a large number of regions: from 1 2 in the
A
chromosome to 21 in theE
chromosome. This is a much greater number than can be marked geneti- cally in Drosophila. In a general sense then, the positions of all the chias- mata occurring in a particular bivalent have been located more accurately than can all the crossovers occurring in an individual chromosome of any genetic experiment. In other respects there are certain limitations to a cytological study of crossing-over (cf. HUSKINS and NEWCOMBE 1941).
The formula used for calculating coincidence was: coincidence = xn/ab in which x is the number of double chiasmata, n is the total number of
pairs of regions observed, and a and b are the numbers of chiasmata in the first and second regions, respectively, including those occurring simultane- ously in both. The suggestions of STEVENS (1936) regarding the use of this formula for non-adjacent regions were adopted.
The comparisons between the coincidence values obtained from different chromosomes, or different parts of the same chromosome, are not subject to errors resulting from differences in the distances separating crossovers, This is a difficulty in genetic experiments, since coincidence varies with distance, and it is not possible to space marker genes to provide a large number of regions of equal genetic or cytological length.
Twelve cells were analyzed from each of four preparations; in these 48
cells only two bivalents (two C bivalents in slides I and 2) could not be
interpreted. These are omitted from all calculations, and this omission is responsible for the slight differences which may be noted in the tables be- tween the values of n for the two sets of slides.
Slides I and 2 had a higher chiasma frequency (21.3 and 23.0 chiasmata
per cell, respectively) and slides 3 and 4 a lower chiasma frequency (14.3
H. B. NEWCOMBE OBSERVATIONS
The frequencies of chiasma formation for the various regions are given in table I . Coincidence values were first calculated for adjacent regions of
one micron. There is a high frequency of chiasma formation close to the attachment, and a considerable number of data may be obtained from the two regions adjacent to it in any one of the four bivalents having median
TABLE I
Distribution of chiasmata in the jive bivalents of Trillium.
CHROMO- NUMBER OF BEGIONS. OF THE LEFT ABM REGIONS OF THE RIGHT ARM
SOME BIVALENTS ATTACH-
SLIDES EXAMINED I O Q 8 7 6 5 4 3 2 I YEW I P 3 4 5 6 7 8 9 IO 11 1 2
4 1 2 1 6
I 2 0 7
1 5 0 6 1 5
6 2 2 2 1 4
I 7 6 2 1 2 6 IQ
3 6 3 4 5 4 1 5
E ( I + z ) 24 5 8 I 6 8 3 3 I o 19
E ( 3 l - 4 ) 24 7 6 3 1 0 7 4 4 4 0 1 9
1 3 3 2 5 4 8 6 1 0 1 2 2 8
3 3 3 4 8 2 3 7 3 3 3 6
1 8 8 7 6 9 7 9 5 8 7
1 1 5 4 4 2 7 7 3 6 3
1 6 8 6 4 4 6 8
1 2 4 1 1 1 0 1 2
2 4 6 8 ~ 1 2 1 0 8 6
1 4 3 3 3 8 4 4 4
2 3 0 1 3 9 1 4 6 9 5 5 7
1 4 4 6 4 6 3 7 5 2 3 1 1
* The divisions used were obtained by dividing the arms of each of the five bivalents into a given number of regions in such a manner that in an arm of average length these would be as close as possible to one micron.
or sub-median attachments. Within the arms, where the chiasma frequency is much lower, it is necessary to combine all the data from a comparison of each region with its neighbor in order to get an estimate of coincidence for that arm. Differences in chiasma frequency in different parts of the arm would in themselves make this estimate somewhat higher than the average of the coincidence values from each pair of regions were sufficient data available to calculate them individually. The discrepancy, however, affects the usefulness of these values in only one of the comparisons made. This will be considered in the discussion.
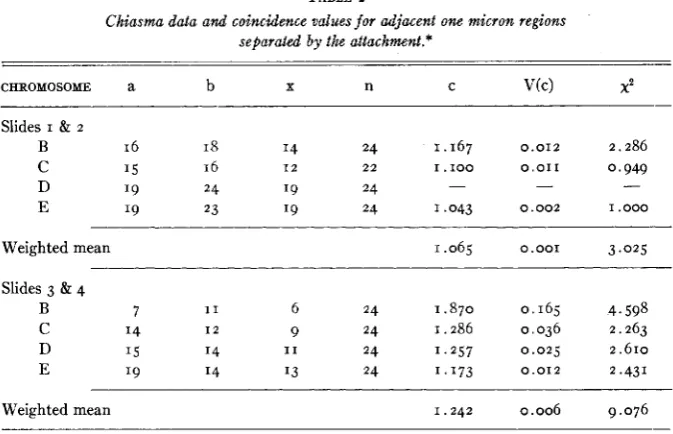
The data and coincidence values obtained from adjacent regions across the attachments are given in table 2 and the statistical analysis in table 3.
I n all bivalents coincidence across the attachment is greater than unity, and it is significantly greater in the data from slides 3 and 4 and in the combined data from all slides.
Coincidence across the attachment is greater in slides 3 and 4 (which have a lower chiasma frequency) than in slides I and 2 . This difference is just significant, however: P = .os - . 0 2 .
There is no indication of any difference between the attachments of
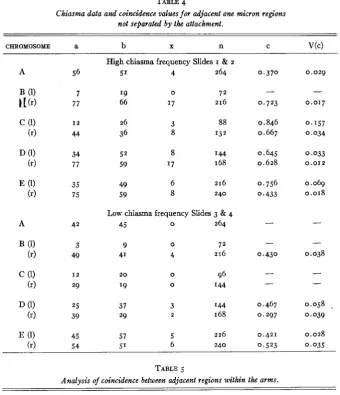
Coincidence values between adjacent one micron regions not separated by the attachment are given in table 4, and the statistical analysis in table 5 . Contrary to the behavior of coincidence across the attachment, this is greater in slides I and 2 (which have a higher chiasma frequency)
TABLE 2
Chiasma data and coincidence values for adjacent one micron regions
separated by the attachment.*
CHROMOSOME a b X n C V(C) 2
Slides I & 2
B 16 I8 I4 24 1.167 0.012 2.286
C 15 16 1 2 22 I . I O 0 0 . 0 1 1 0,949
D '9 24 '9 24
E '9 23 I9 24 1.043 0.002 1.000
- - -
Weighted mean 1.065 0.001 3.025
Slides 3 & 4
B 7 1 1 6 24 1.870 0.165 4.598
C 14 I 2 9 24 1.286 0.036 2.263
D '5 14 I 1 24 1 . 2 5 7 0 . 0 2 5 2.610
E 19 14 I3 24 1.173 0.012 2.431
Weighted mean 1.242 0.006 9.076
* a & b are the numbers of chiasmata in the two regions compared respectively, and include those occurring simultaneously in both regions; x is the number of double chiasmata in the two regions; n is the total number of observations; c is the coincidence; V(c) is the variance of the coincidence (from formula given by Stevens 1936); 2 is calculated for the deviation from unity. Deviation of c from its expectation squared, divided by the variance is distributed approxi- mately as a xz for one degree of freedom. If in the calculation of the variance c had beenplaced equal to its expected value of one, this quantity would be a perfect x2. The discrepancy involved in the above calculation, however, is not likely to cause serious misjudgment,
TABLE 3
Analysis of coincidence across attachment.
D.F. 2 P
~
Deviation from unity I 8.137 < .OI
Heterogeneity between Slides I & 2 and 3 & 4 I 3.964 .os- .02 Heterogeneity within Slides I & 2 and 3 & 4 5 4.056 .70- .so
Total 7 16.157
than in slides 3 and 4. The difference in this case is not statistically sig- nificant, however: P = .IO - .os.
132 H. B. NEWCOMBE
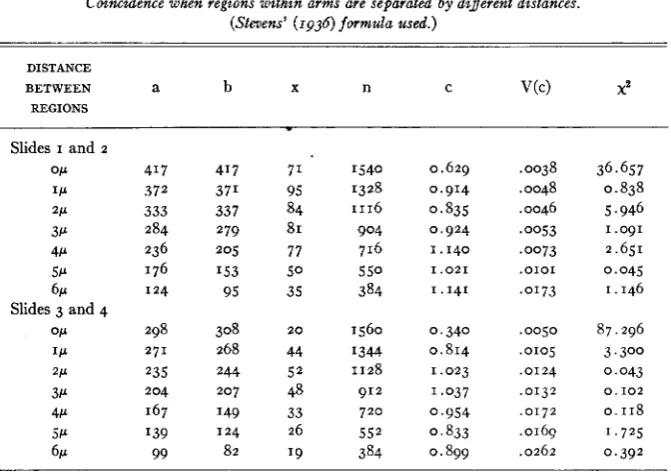
the chromosome arms were combined, and slides I and 2 and 3 and 4
were treated separately. It may be seen from table 6 that, in general, coincidence is greater when the regions are more widely separated. Statis-
TABLE 4
Chiasma data and coincidence vdues for adjacent one micron regions not separated by the attachment.
CHROMOSOME a b X n C V(C)
A 56
A 42
High chiasma frequency Slides I & 2
51 4 264
I9 0 7 2
66 17 216
26 3 88
36 8 132
52 8 I44
59 '7 168
49 6 216
59 8 240
Low chiasma frequency Slides 3 & 4
45 0 264
9 0 7 2
41 4 216
2 0 0 96
'
9 0 I 4 4
37 3 I 4 4
29 2 168
57 5 216
0,370 0.029
0.846 0 . I57
0.667 0.034
0.645 0.033
0.628 0.012
0,756 0.069
0.433 0.018
0.467 0.058
.
0.297 0.039
0.421 0.028
TABLE 5
Analysis of coincidence between adjacent regions within the arms.
DF X2 P
Heterogeneity between slides I & 2 and 3 & 4 I 2.754 .lo- .os
Heterogeneity within slides I & 2 and 3 & 4 I 1 6.076 .90- .80
Total 1 2 8.830
CHIASMA INTERFERENCE =33
DISCUSSION
Evidence that coincidence across the attachment may exceed unity is found in the genetic data from chromosome I11 of Drosophila melanogasrer
and chromosome I of Newospora crassa. KIKKAWA (1935) has calculated coincidence from the relevant Drosophila data of BRIDGES and MORGAN (1923), MULLER (1925), BRIDGES (1929), and REDFIELD (1930). The one group of these data which gives a coincidence value significantly greater than one is included in table 7 together with its
x2.
Also, coincidence values have been calculated by the author from the Neurospora data of LINDE-GREN and LINDEGREN (1937) and are given in table 7 together with the
x2’s for their deviations from one.
TABLE 6
Coincidence when regions d h i n arms are se#arated by different distances. (Stevens’ (1936) formula used.)
DISTANCE
BETWEEN a b X n C V(C) X2
REGIONS
~~
Slides I and 2
OP 41 7 41 7 71 1540 0.629 .0038 36.657
I P 372 37’ 95 1328 0.914 .0048 0.838
2P 333 337 84 1116 0.835 .0046 5.946
3P 284 279 81 904 0.924 .ow3 I .o91
4P 236 205 77 716 1.140 .0073 2.651
5P 176 I53 5 0 5 5 0 1 . 0 2 1 , 0 1 0 1 0.045
6~ 124 95 35 384 1.141 .0173 1.146
OP 298 308 20 1560 0.340 .ooso 87.296
Slides 3 and 4
I P 2 7 1 268 44 1344 0.814 .OI05 3.300
3P 204 2 0 7 48 912 1.037 ,0132 0 . I 0 2
2P 235 244 5 2 1128 1.023 ,0124 0,043
4P 167 149 33 7 2 0 0.954 ,0172 0.118 5P I39 124 26 5 5 2 0,833 ,0169 1.725
6~ 99 82 19 384 0.899 .0262 0.392
NOTE: x2 is calculated for the deviation from unity (see footnote, table 2).
I34 H. B. NEWCOMBE
nearer unity than it would otherwise be. When regions
+
g and cp
are compared, slipping of the nuclei could not affect the coincidence, since the attachment is not used as a marker. I n all of these three comparisons coincidence is greater than one, and the degree of statistical significance is extremely high. It is of interest to note that the accuracy of scoring is in- creased in Neurospora by the facts (a) that each of the four products of meiosis is represented by two identical nuclei which may be used as checks on each other, and (b) that in an ascus from a heterozygote the two al- lelemorphs must each occur twice in the four products of meiosis.TABLE 7
Crossover and chiasma coincidence across the attachment in Drosophila and Neurospora.
REGIONS a b X n C V(C) XZ P
Drosophila (chromosome 111)
D- p p - ea 88 430 29 2191 1.679 0.062 7.480 <.or
Neurospora (chromosome I)
+-g-sfa 40 30 6 422 2 . 1 1 0 0.516 2.386
g-sfa-c 30 32 I 1 422 e 4.835 1.096 13.422 <.oor
sfa-c-p 32 82 8 422 1.287 0.141 0.582
g-sfa,c-p 30 82 5 422 0.858 0.115 0.176
f - g , c-p 40 32 28 422 3.602 0 . 1 7 2 39.467 verysmall
NOTE: sfa denotes the spindle fiber attachment, which has been used as a marker. a, b, x, n, c, and V(c) are as in the other tables except that for the Drosophila data they are in terms of crossovers and chromatids, whereas for the Neurospora data they are, as for Trillium, in terms of chiasmata and bivalents. x2 is calculated for the deviation from unity (see footnote, table 2). The Drosophila data are from BRIDGES and MORGAN 1923, p. 129, table 87; the Neuro- spora data are from LINDEGREN and LINDEGREN 1937, p. 10g, table 2 .
It should be noted that Diachaete is associated with an inversion which might affect both the pairing relationships and the recoverable crossovers.
+-g, sfa-c 40 32 I 1 422 3.627 0.651 10.602 .001
We may therefore say that genetic data agree with the cytological ob- servations in Trillium that coincidence across the attachment can be greater than one. This implies a certain heterogeneity in the data, the biological cause of which is not known. KIKKAWA (1935) has suggested that it is the result of variability in pairing, and although this is a difficult hypothesis to test, it a t least provides a mechanism which explains the data and which is easy to visualize.
chiasmata are formed in these regions, the less evidence there is of hetero- geneity. In the arms no such relationship is observed, but in this case there are three possible variables indistinguishable from one another which would affect the coincidence. These are: (I) heterogeneity within the re-
gions compared, ( 2 ) heterogeneity between the regions of an arm which have been grouped to give an estimate of coincidence for that arm, and
(3) interference. The first two would, of course, tend to increase the co- incidence value and the third to decrease it.
As in Drosophila, interference disappears as the distance between the regions is increased. In Trillium statistically significant evidence of inter- ference is found when the regions are separated by as much as two microns. This is a minimum estimate of the distance over which interference can act, since it may be effective at greater distances but be obscured by hetero- geneity both within and between the regions grouped to give these esti- mates. That there is no significant deviation of coincidence from unity when the distance between the regions is great, is in agreement with
STEVENS’ (1936) interpretation of WEINSTEIN’S (1918) Drosophila data. In making this comparison of cytological with genetic coincidence, it has been assumed that chiasma movement and loss prior to the time of ob- servation is negligible. A similar assumption is involved in the analysis of HALDANE (1931), who noted that reduction of chiasma frequency through terminalization could effect a reduction in variance, from which he deter- mined the existence of cytological interference. He considered, however, that “this would hardly account for the very small variance found.” There is no indication of chiasma movement in Trillium. Evidence that there is no movement is found in the analysis of MATHER (1940) and in the observation that different types of chiasma pairs observed by HUSKINS and NEWCOMBE (1941) tend to be of different lengths, whereas were there an appreciable rearrangement due to repulsion between chiasmata, all the simpler types would tend to be of the same length.
ACKNOWLEDGMENT
The author is indebted to DR. C. L. HUSKINS for advice and criticism throughout the study and to DR. K. MATHER for suggesting the statistical methods employed.
SUMMARY
A detailed study of interference (and coincidence) between chiasmata has been made in Trillium erectum.
136 H. B. NEWCOMBE
chromosome of Neurospora. This is assumed to be the result of hetero- geneity, the biological cause of which is not clearly indicated.
An increase in total chiasma frequency appears to be accompanied by increased coincidence within the arms and decreased coincidence across the attachment, although the observed differences are not quite within the limits of statistical significance.
Coincidence within the arms increases with the distance between chi- asmata and, as reported in Drosophila, reaches a value not differing signifi- cantly from unity.
The observed similarities to genetic data on interference add further evidence favouring the assumption that all chiasmata are concomitants of crossing over.
LITERATURE CITED
BELLING, J., 1929 Nodes and internodes of trivalents of Hyacinthus. Univ. of Cali. Pub. Bot.
BRIDGES, C. B., 1929 Variation in crossing-over in relation to age of female in Drosophila melano-
BRIDGES, C. B., and MORGAN, T. H., 1923 The third chromosome group of mutant characters of DARLINGTON, C. D., 1930 A cytological demonstration of “genetic” crossing-over. Proc. Roy. Soc.
14 (18): 379-388.
gaster. Pub. Carnegie Instn. 399: 63-89.
Drosophila melanogaster. Pub. Carnegie Instn. 327: 21-2 51.
B. 107: 50-59.
1937 Recent Advances in Cytology. 2nd ed. London: Churchill and Co.
HALDANE, J. B. S., 1931 The cytological basis of genetical interference. Cytologia 3: 54-65.
HUSKINS, C. L., and NEWCOYBE, H. B. 1941 An analysis of chiasma pairs showing chromatid inter- KIKKAWA, H., 1935 Biological significance of coincidence in crossing-over. Japanese J. Genet. 11 :
LINDEGREN, CARL C., and LINDEGREN, G., 1937 Non-random crossing-over in Neurospora. J. MATHER, K., 1938 Crossing-over. Biol. Rev. 13: 252-292.
MULLER, H. J., 192 5 The regionally differential effect of x-rays on crossing-over in autosomes of REDFIELD, H., 1930 Crossing-over in the third chromosomes of triploids of Drosophila meZuno-
STEVENS, W. L., 1936 The analysis of interference. J. Genet. 32: 51-64.
WEINSTEIN, A., 1918 Coincidence of Crossing-over in Drosophila melanogaster (ampelophila). ference in Trillium erectum. Genetics 26: 101-127.
51-59>
Hered. 28: 105-113.
1940 The determination of position in crossing-over. J. Genet. 39: 205-223.
Drosophila. Genetics IO: 47-507.
gaster. Genetics 15: 205-252.