STUDY OF EFFECT OF INHOMOGENEOUS
DISTRIBUTION OF COOPERATIVE UP-CONVERSION COEFFICIENT ON THE OPTICAL AMPLIFICATION PROCESS IN SI-NC AND ER DOPED OPTICAL FIBER
A. Salmanogli and A. Rostami
Photonics and Nanocrystal Research Lab. (PNRL) Faculty of Electrical and Computer Engineering University of Tabriz
Iran
Abstract—Effects of different optical losses (auger recombination, cooperative up-conversion, excited state absorption (ESA) and Si-Nc induced loss) on amplification parameters including net gain and population inversion in Si-Nc Er doped fibber are studied. Optical loss due to up-conversion effect has critical role in the mentioned optical amplifiers. Simple modeling of this effect can be done by 2CupN22,
whereCupandN2 are up-conversion coefficient and population of level
2 respectively. In traditional considered cases Cup are assumed to
be constant, but in practical situation this is hard to be realized. In practice distribution of Er ions is inhomogeneous and especially the Gaussian. So, from our point of view the suitable model should consider position dependence up-conversion coefficient. In this paper we considered this subject and by simulation modeling tries to show effect of inhomogeneous distribution of up-conversion coefficient on optical net gain and population inversion.
It is shown that life times of first and second excited states are decreased and so the population inversion is decreased too. Thus optical net gain near to center of the Gaussian distribution is deceased strongly. The observed gain lowering is suitable description of the reported experimental results. Also, it is observed that in high level Si-Nc density the obtained optical gain is decreased against traditional description which Cup is assumed to be constant. The core diameter
1. INTRODUCTION
High-speed data communication and processing are basic industrial and scientific demand recently. Optical method is one of best alternatives for doing these tasks. Main physical medium for optical communication and processing is optical fiber. Transmission bit rate in optical communication is higher than other data transmission methods. But, this is still far from the fundamental limit to the information transfer rate, and future systems are expected to reach data transfer rates of several turbits per second in a single fiber, for transmission over large distance the optical signal needs to be amplified at regular intervals in order to maintain sufficient light intensity. There are different alternatives for optical amplification such as semiconductor optical amplifiers (SOA, [1, 2]), Erbium doped fiber amplifier (EDFA) and Si-Nc-Er doped amplifier [3–8]. These amplifiers can be used in optical integrated circuit also to compensate signal losses. Such amplifiers use stimulated emission from the first excited state to the ground state of Er(+3) at 1550 nm the intra-4f transition is parity forbidden, and as a result the emission cross section for EDFA amplifier is quite small (10−21cm2). Consequently, in this amplifier for high gain achievement, high Er concentration is required. At this high Er concentration the closely spaced Er ions can interact. This cause several effect, such as energy migration, in which an excited Er ions excite a neighboring unexcited Er ions, which may in turn be coupled to a nonradiative quenching site, and cooperative up-conversion, in which an excited Er ions promotes a neighboring excited Er ions a higher levels. Both processes are detrimental to the optical gain, as they reduce the population inversion in the first excited state. These interactions between ions affect the optical net gain in Si-Nc-Er doped fiber amplifier. Moreover, in this amplifier Si-Nc induced loss affects the net gain. So that high level Er ions are required to achieve significant gain in waveguide structure in small length (cm) scales [9– 12]. The effect of cooperative up-conversion not only depends on the average Er concentration, but also on the microscopic distribution of the Er ions in the host material [13, 14].
In [17] modeling of experimentally realized Si-Nc Er doped fiber amplifier was done. In this paper a phenomenological model was presented based on an energy level scheme taking into account the strong coupling between each Si nanocrystal and the neighboring Er ions and considering the interactions between Er ions pairs too, such as the concentration quenching effect and the cooperative up-conversion mechanism. This is an interesting paper, but some critical points such as inhomogeneous distribution [18] of Er-ions didn’t addressed. In practice inhomogeneous distribution usually occurred and complete description of experimental results should consider this subject. But, the cooperative up-conversion coefficient was considered constant for whole simulations. Also, it should mention that in all published papers the up-conversion coefficient was assumed to be constant.
Optical losses in presence of Si-Nc Er doped fiber amplifier were discussed in [19, 20]. In these papers scattering loss and optical loss due to inhomogeneity in manufacturing step of waveguide were discussed. Results of this paper can be used for modeling of optical amplifier precisely.
Energy transfer between Si-Nc and Er ions and time constant of energy coupling was discussed in [21, 22]. This paper presents experimental result of silica thin films containing Si nanocrystals and Er ions prepared by ion implementation. Results of this paper can be used for transient analysis of optical amplifier in presence of nanocrystals.
The effect of cooperative up-conversion loss not only depends on the average concentration of Er ions but also depends on the distribution profile of the Er ions in the host material. The Up-Conversion coefficient can vary by orders of magnitudes in the same host material. In this article, we assumed Er distribution in the form of Gaussian profile which this form mainly used in practice. Therefore up-conversion coefficient is a function of core radius (Cup(z)).
Thus it is shown that the radius dependency of the up-conversion coefficient affects the population of first excited state and optical net gain strongly.
The organization of this paper is as follows.
2. MATHEMATICAL BACKGROUND AND
PRINCIPLES OF OPERATION OF SI-NC OPTICAL AMPLIFIER
Si-Nc Er doped fiber amplifier is a suitable alternative for decreasing of the fiber [23, 24] length for given gain. In this amplifier Er ions excited indirectly through Si-Nc and because of high absorption cross section of Si-Nc the efficiency of pumping is increased too. Also, in this case large optical bandwidth can be supported and there isn’t any requirement to precise laser diode [25, 26] for pumping. Figure 1 typically shows the inhomogeneous distributions of Er ions. Based on this figure it is obvious that the cooperative up-conversion coefficient can’t be constant and same at whole place because of inhomogeneous distribution of Er ions. Therefore, we describe Cup(z) in this paper
for clearly investigation of the effect of interaction between ions in the first excited state.
Core
Si-Nc Er
Figure 1. Schematic of inhomogeneous Er ions doped fiber amplifier.
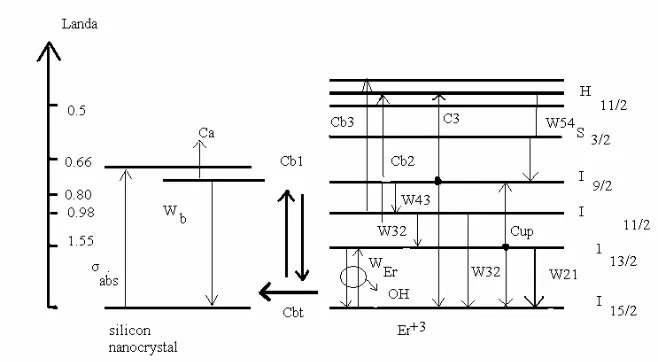
In this analysis silicon nanocrystal behavior can be described by a three level system. Since the reported experimental results show that the trapping is very fast process compared to the typical decay time in optical amplifiers, with accepting a small error two-level case is good approximation for silicon nanocrystals.
The following defined parameters are used in simulation of the optical amplifier.
N0 Total density of silicon nanocrystal
Figure 2. Energy level scheme for the system of interaction Silicon Nanocrystal and Er ions.
Ni Population in different levels (i) ofEr(+3) ions
σabs Si-Nc absorption cross section
φPhoton Flux
σdir Direction absorption cross section
Wer The concentration quenching effect (due to the energy
migration all over the sample introduced by the energy transfer between two nearby Er(+3) ions occurred between ground and first excited states)
Wb The exiton total recombination rate
Wij The total transition rate from leveli to levelj(i > j)
Cup Co-operative up-conversion coefficient
Cbt Backward transfer energy from Er to Si-Nc
Cbi(i >2) Excited state excitation (ESA) from leveli(i >2)
Cbi(i= 1) The coupling between the silicon nanocrystal and the
ground state ofEr(+3)
In the following the rate equations for the proposed system are given based on the continuity equation [17].
dNb
dt = σabsφ(N0−Nb)−(WbNb)− 3
i=1
CbiNbNi(z) (1)
dNa
dt = σabsφ(−N0+Nb) + (WbNb) + 3
i=1
dN5(z)
dt = (CdirσdirφN3(z)) +
C3N3(z)2
−(W54N5(z))
+
3
i=2
CbiNbNi(z) (3)
dN4(z)
dt = (W54N5(z)) +
Cup(z)N2(z)2
−(W43N4(z))
+(Cb1N1(z)Nb) (4)
dN3(z)
dt = (W43N4(z))−(W32+W31)N3(z)−
2C3N3(z)2
−(Cb3NbN3(z))−(CaNbN3(z)) (5) dN2(z)
dt = (W32N3(z))−(W21+Wer)N2(z)−
2Cup(z)N2(z)2
−(Cb2NbN2(z))−(CaNbN2(z)) (6) dN1(z)
dt = (W21+Wer)N2(z) +
Cup(z)N2(z)2
+ (N2(z)
+N3(z))CaNb+ (W31N3(z)) +
C3N3(z)2
−(CbtNbN1(z))−(σdirφN1(z)) (7)
In the following table all parameters used in this paper for simulation is given.
3. RESULTS AND DISCUSSION
Based on the proposed rate equations in Section 2, in this section for evaluation of the variation of cooperative up-conversion coefficient effect in the different point of core on parameters of optical amplifier are presented and discussed. For this task, we consider the following cases for simulations.
a) Transient response, b) Steady state response
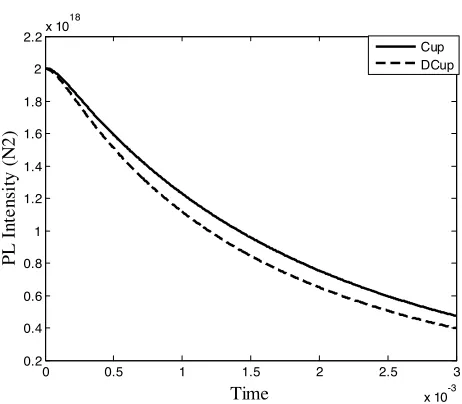
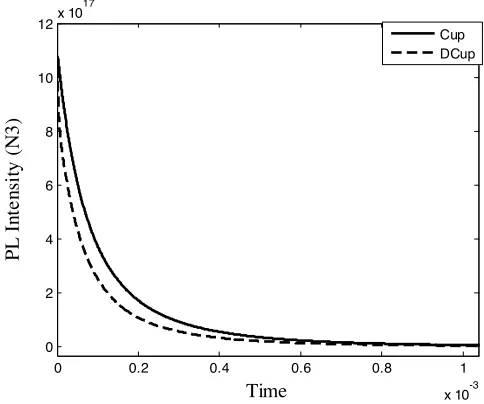
In first part (a) of simulations we considered time evaluation of normalized photoluminescence (PL) intensity at 1550 nm (Figures 3 and 4) and 980 nm (Figure 5). In theses curves we assumed steady state condition and the pump turn off int= 0. On the other hand this curve show decay time of the system. So, we expect that the PL decreases with increasing time. In these figures effects of different Er ions concentration and variation of cooperative up-conversion coefficient (DCup) on PL is considered. It is shown that with increasing the
Table 1. Physical parameter for simulation of optical amplifier [17].
Symbol Value
λexc 488 nm
σabs 2·10−16cm2
σdir 1·10−20cm2
Wb 2·104s−1
W21 4.2·102s−1
W32 4.2·105s−1 W43 1·107s−1 W54 <1·107s−1
Cb1 3·10−15cm3s−1 Cup0 7·10−17cm3s−1 Cb2 <3·10−19cm3s−1 Cb3 <3·10−19cm3s−1 Cbt <3·10−19cm3s−1
Ca <3·10−19cm3s−1
C3 7·10−17cm3s−1 Wer 8.1·10−19NT otalers−1
ions is increased and so PL is decreased. Moreover, these figures show that there is considerable reduction in magnitude of PL in the case of variable up-conversion coefficient compared constant and uniform case. It comes back to this fact that in the case of variable up-conversion coefficient near the maximum peak of this coefficient due to strong interaction between ions the life time is strongly decreased. In this section solid line refers to the constantCup.
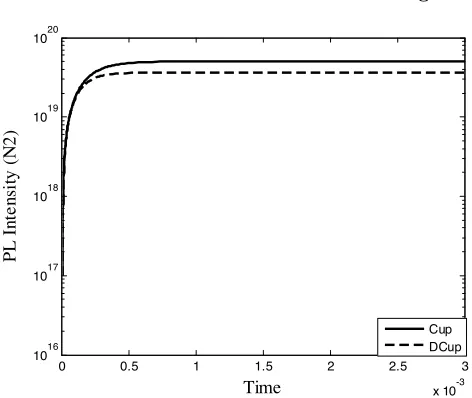
Figures 6 and 7 shows the normalized photoluminescence intensity calculated at 1550 nm as a function of time after switching on the laser beam att= 0. It is observed that the rise time of photoluminescence signal is decreased with decreasing of Er concentration. We defined the typical experimental rise timeτonas the time it takes the luminescence
0 0.5 1 1.5 2 2.5 3
x 10-3 0.2
0.4 0.6 0.8 1 1.2 1.4 1.6 1.8 2 2.2x 10
18
Time
PL
In
te
n
si
ty
(N
2
)
Cup DCup
Figure 3. PL intensity life time vs. time (sec). Mp (Maximum Er
Concentration) = 1·1018(1/cm3),Pump= 5·1022Photon.cm−2sec−1. Non-constant cooperative up-conversion coefficient (DCup).
0 0.5 1 1.5 2 2.5 3
x 10-3 0
1 2 3 4 5 6 7 8x 10
19
Time
PL
In
te
n
si
ty
(N
2
)
Cup DCup
Figure 4. PL intensity life time vs. time (sec). Mp (Maximum Er
0 0.2 0.4 0.6 0.8 1
x 10-3 0
2 4 6 8 10 12x 10
17
Time
PL
In
te
n
si
ty
(N
3
)
Cup DCup
Figure 5. PL intensity life time vs. time (sec). Mp (Maximum Er
Concentration) = 1·1021(1/cm3),Pump= 5·1022Photon.cm−2sec−1.
0 0.5 1 1.5 2 2.5 3
x 10-3 1013
1014 1015 1016 1017 1018
Time
PL
In
te
n
si
ty
(N
2
)
Cup DCup
Figure 6. PL intensity rise time vs. time (sec). Mp (Maximum Er
0 0.5 1 1.5 2 2.5 3
x 10-3 1016
1017 1018 1019 1020
Time
PL
In
te
n
si
ty
(N
2
)
Cup DCup
Figure 7. PL intensity rise time vs. time (sec). Mp (Maximum Er
Concentration) = 1·1021(1/cm3),Pump= 1·1020Photon.cm−2sec−1.
small interaction due to low Er ions concentration.
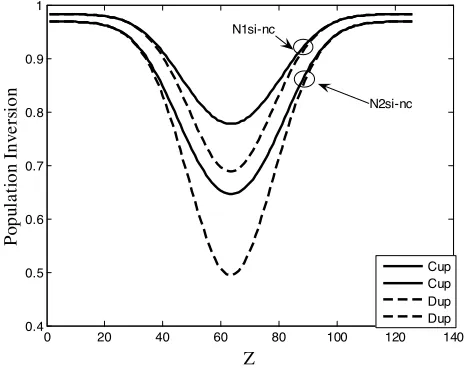
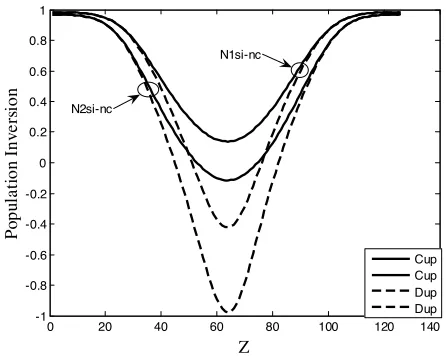
In second part (b) we consider steady state condition. In Figures 8 and 9, effects of variation of Si-Nc density and cooperative up-conversion coefficient on the exited Si-Nc and population inversion are investigated and it is considered (σEr = 3µm) at Er distribution
profile. It is shown that with increase of the Si-Nc density, excited state Si-Nc and population inversion are decreased which this event comes back to increase of the coupling between Er ions and Si-Nc. Moreover, we investigated the effect of variation of cooperative up-conversion coefficient on the excited state Si-Nc and population inversion. We observed that in the distances near to center of the Gaussian distribution of Er ions, reduction of excited Si-Nc population inversion are increased due to increase of the interaction between Er ions at the center of Gaussian distribution. In these figures
N2si−nc(Si−N c Concentration), N1si−nc(Si−N c Concentration) are maximum and minimum concentrations of theSi−N c, respectly. Other parameter that used in these figures isM pwhich illustrated the maximum number of Er concentration.
0 20 40 60 80 100 120 140 0.984
0.986 0.988 0.99 0.992 0.994 0.996 0.998 1
Z
Ex
cite
d S
i-NC
Cup Cup Dup Dup N1si-nc
N2si-nc
Figure 8. Excited Si-Nc vs. Z. Mp(Maximum Er Concentration) = 1·1020(1/cm3), σEr = 3µm, Pump = 5·1022Photon.cm−2sec−1.
N2si−nc(Si−N cConcentration) = 2·1019(1/cm3),N1si−nc(Si− N cConcentration) = 1·1019(1/cm3).
0 20 40 60 80 100 120 140
0.4 0.5 0.6 0.7 0.8 0.9 1
Z
P
o
pu
la
ti
on
In
v
e
rs
ion
Cup Cup Dup Dup N2si-nc N1si-nc
Figure 9. Population inversion vs. Z. Mp(Maximum Er
Concentration) = 1 · 1020(1/cm3), σEr = 3µm, Pump = 5 ·
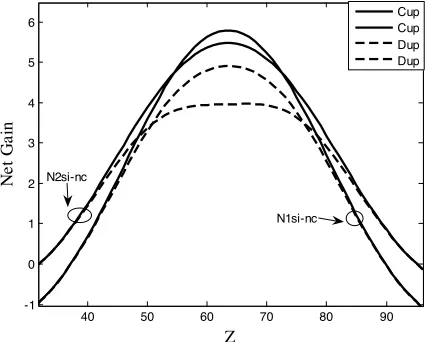
40 50 60 70 80 90 2
3 4 5 6 7
Z
Ga
in
Cup Cup Dup Dup
N1si-nc N2si-nc
Figure 10. Gain vs. Z. Pump = 1 · 1020Photon.cm−2sec−1,
Mp(Maximum Er Concentration) = 1 ·1020(1/cm3), σ
Er = 3µm,
N2si−nc(Si−N cConcentration) = 2×10¹⁹(1/cm3),N1si−nc(Si− N cConcentration) = 1×10¹⁹(1/cm3).
40 50 60 70 80 90
-1 0 1 2 3 4 5 6
Z
Ne
t
Ga
in
Cup Cup Dup Dup
N2si-nc
N1si-nc
Figure 11. Net gain vs. Z. Mp(Maximum Er Concentration) = 1·1020(1/cm3), Pump = 5·1022Photon.cm−2sec−1, σEr = 3µm.
0 20 40 60 80 100 120 140 0.65
0.7 0.75 0.8 0.85 0.9 0.95 1
Z
Ex
c
it
e
d
S
i-N
C
Cup Cup Dup Dup N1si-nc
N2si-nc
Figure 12. Excited Si-Nc vs. Z. Mp(Maximum Er Concentration)= 1·1021(1/cm3), σEr = 2.5µm, Pump = 5·1022Photon.cm−2sec−1.
N1si−nc(Si−N c Concentration) = 1×10¹⁹(1/cm3),N2si−nc(Si− N cConcentration) = 2×10¹⁹(1/cm3).
0 20 40 60 80 100 120 140
-1 -0.8 -0.6 -0.4 -0.2 0 0.2 0.4 0.6 0.8 1
Z
P
o
pu
la
ti
on
In
v
e
rs
ion
Cup Cup Dup Dup N2si-nc
N1si-nc
Figure 13. Population inversion vs. Z. Mp (Maximum Er
Concentration) = 1 ·1021(1/cm3), σEr = 2.5µm, Pump = 5 ×
30 40 50 60 70 80 90 100 -40
-30 -20 -10 0 10 20 30
Z
Ga
in
Cup Cup Dup Dup N1si-nc
N2si-nc
Figure 14. Gain vs. Z. Mp (Maximum Er Concentration) = 1 · 1021(1/cm3), Pump = 5 · 1022Photon.cm−2sec−1, σEr = 2.5µm.
N1si−nc(Si−N cConcentration) = 1·1019(1/cm3),N2si−nc(Si− N cConcentration) = 2·1019(1/cm3).
It is shown that in this case with increase of the density of Si-Nc first the up-conversion coefficient is increased and then optical gain is decreased. The proposed idea easily can be shown in optical net gain. Finally we considered effect of sharp Gaussian distribution realized by Ion Implantation method on variable up-conversion coefficient and finally on normalized Si-Nc excited state, population inversion and gain factors and it is considered (σEr = 2.5µm) at Er distribution
profile. It is observed that in this case due to sharp variation of the up-conversion coefficient Si-Nc excited state really depleted due to reflected energy. Also, due to this problem the population inversion is destroyed and finally optical gain has minus gain in central part of the core. This effect will damage the light propagation through this amplifier generally.
4. CONCLUSION
Si-Nc Er doped fiber amplifier for high quality optical links was studied from different point of views. We have shown that in the case of inhomogeneous distribution of Er ions which is traditional in practice the up-conversion coefficient is variable in core and effect of this phenomenon on characteristics of optical amplifier was modeled and simulated. Our simulations have shown that it is critical and must be considered for precise description of the experimental results. Also, inhomogeneous distribution of Er ions and Si-Nc may be random profile that is difficult to model this system. Moreover, when distribution of Si-Nc and Er ions is inhomogeneous, three factors can affect on the maximum gain and system losses, these factors are minimum distance between Si-Nc and Er ions, maximum size of Si-Nc and anaocrystal materials. These factors can be critical point in simulation and design. The effect, size of Si-Nc and distance between Si-Nc and Er ions is investigated but nanocrystal materials can be affected on constant cooperative up-conversion coefficient and other constants such as Si-Nc absorption cross section, backward transfer energy from Er to Si-Nc, Direction absorption cross section and ect which these parameters can alter population inversion and system gain.
REFERENCES
1. Kuntze, S. B., L. Pavel, and J. S. Aitchison, “Controlling a semiconductor optical amplifier using a state-space model,”IEEE Journal of Quantum Electronics, Vol. 43, No. 2, February 2007. 2. Kim, J. H., Y. I. Kim, Y. T. Byun, Y. M. Jhon, S. Lee, S. H. Kim,
and D. Ha,Journal of the Korean Physical Society, Vol. 45, No. 5, No. 5, 1158–1161, 2004.
3. Bergano, N. S., Opt. Photon., Vol. 11, 21, 2000.
4. Kik, P. G. and A. Polman, “Exiton-erbium interaction in Si nanocrystal-doped SiO2,” Journal of Applied Physics, Vol. 88,
No. 4, 1992–1998, 2000.
5. Jiang, C. and Q. Zeng, “Optimization of Er-doped waveguide amplifier,”Optics and Laser Technology, Vol. 36, 167–171, 2004. 6. Daldosso, N., D. Navarro, M. Melchirro, L. Pavesi, F. Gourbilleau,
M. Carrada, R. Rizk, C. Garcia, P, Pellegrino, B. Garrido, and L. Cognolato, “Absorption cross section and signal enhancement in Er-doped Si nanocluster rib-loaded waveguide,”Applied Physics Letter, Vol. 86, 261100, 2005.
O. A. Shaligina, S. A. Tetrukov, R. J. Zhang, M. Fujii, and S. Hayashi, “Photoluminescence properties of Er doped structure of silicon nanocrystal in silicon dioxide matrix,” Journal of Non-Crystalline Solids, Vol. 352, 2006.
8. Daldosso, N., D. Navarro, M. Melchiorri, C. Gristina, P. Pelle-grino, B.Garrido, C. Sada, G. Battaglin, F. Gourbilleau, R. Rizik, and L. Pavaesi, “Er coupled Si nanocluster waveguide,” IEEE-Journal in Quantum Confinement, Vol. 12, No. 6, 1607–1617, November 2005.
9. Kenyon, A. J., W. H. Loh, C. J. Oton, and I. Ahmad, “An analysis of erbium excited state absorption in silicon-rich silica,” Journal of Luminescence, Vol. 121, 193–198, 2006.
10. Kik, P. G. and A. Polman, “Gain limiting process in Er-doped si nanocrystal waveguide in SiO2,” Journal of Applied Physics,
Vol. 91, No. 1, 2002.
11. Chryssou, C. E., A. J. Kenyon, and C. W. Pitt, “Investigation of energy exchange between silicon nanocrystal and Er ions in silica,” Material Science and Engineering B, Vol. 81, 2001.
12. Kik, P. G. and A. Polman, “Er-doped optical amplifiers on silicon,” MRS Bulletin, Vol. 23, No. 4, 48, April 1998.
13. Snoke, E., P. G. Kik, and A. Polman, “Concentration quenching in erbium implanted alkali silicate glasses,”Optical Material, Vol. 5, 159–167, 1996.
14. Lucarz, F., Silicon Nanocrystal in Er Doped Silica for optical Amplification, MScCreated by Dell Lattitude D820 Project College, London, August 2003.
15. Lucarz, F. and A. J. Kenyon, “Silicon nanocrystal in Er doped silica for optical amplification,” London Communication Symposium, September 2003.
16. Pacifici, D., G. Franzo, F. Priolo, F. Lacona, and L. D. Negro, “Modeling and perspective of the Si nanocrystal Er interaction for optical amplifier,” Physics Review B, Vol. 67, 45301–453013, 2003.
17. Kik, P. G. and A. Polman, “Toward an Er doped Si nanocrestal sensitized waveguide laser the thin line between gain and loss,” F.O.M Institute, 2002.
18. Khalaj-Amirhosseini, M., “To analyze inhomogeneous planar lay-ers by cascading thin linear laylay-ers,”Progress In Electromagnetics Research B, Vol. 3, 95–104, 2008.
loss and absorption cross section of silicon nanocrystals,”Journal of Luminescence, Vol. 121, 344–348, 2006.
20. Chryssou, C. E., A. J. Kenyon, T. S. Lwayama, and C. W. Pitt, “Evidence of energy coupling between si nanocrystal and Er in ion-implanted silica thin films,”Appl. Phys. Lett., October 1999. 21. Kik, P. G. and A. Polman, “Exciton-erbium energy transfer in
Si nanocrystal-doped SiO2,”Material Science and Engineering B,
Vol. 81, 2001.
22. Woo,Journal of the Korean Physical Society, Vol. 45, No. 5, 1158– 1161, November 2004.
23. Prokopovich, D. V., “Analytical and numerical aspects of Bragg fiber design,” Progress In Electromagnetics Research B, Vol. 6, 361–379, 2008.
24. Rostami, A. and S. Makouei, “Temperature dependence analysis of the chromatic dispersion in WII-type zero-dispersion shifted fiber (ZDSF),” Progress In Electromagnetics Research B, Vol. 7, 209–222, 2008.
25. Yang, T., S. Song, H. Dong, and R. Ba, “Waveguide structures for generation of Terahertz Rradiation by electro-optical process in GaAS and Zugep2 using 1.55µm fiber laser pulses,” Progress
In Electromagnetics Research Letters, Vol. 2, 95–102, and 2008. 26. Shwetanshumala, J. of Electromagn. Waves and Appl., Vol. 20,

![Table 1. Physical parameter for simulation of optical amplifier [17].](https://thumb-us.123doks.com/thumbv2/123dok_us/1962965.1258811/7.612.175.346.130.386/table-physical-parameter-simulation-optical-amplier.webp)