AlphaTwirl
A Python library for summarizing event data
into multivariate categorical data
TaiSakuma1,∗ 1University of Bristol
Abstract.AlphaTwirl is a Python library that summarizes large event data into multivariate categorical data, which can be regarded as generalizations of his-tograms. The output can be imported as data frames in R and pandas. With their rich set of data wrangling tools, users can develop flexible and config-urable analysis code. The multivariate categorical data loaded as data frames are readily visualized by graphic tools available in R and Python. AlphaTwirl can process event data concurrently with multiple cores or batch systems. Users can extend and customize nearly any functionality of AlphaTwirl with reusable code. AlphaTwirl is released under the BSD license.
1 Introduction
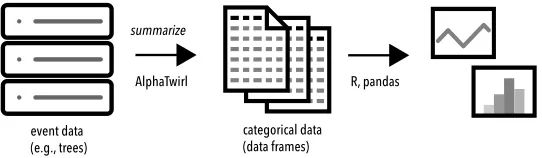
AlphaTwirl is a Python library that summarizes large event data into a set of multivari-ate cmultivari-ategorical data, which can be loaded as data framesin R [1] and pandas [2], as de-picted in Fig.1. AlphaTwirl is used in the CMS experiment [3] to analyze event data in ROOT trees [4], including Delphes trees [5], Heppy trees [6], and CMS MiniAOD [7] and NanoAOD [8]. AlphaTwirl enabled the development of new dimensionless variables for supersymmetry searches [9]. AlphaTwirl is available at Ref. [10] under the BSD license.
This paper starts by distinguishing event data and categorical data, followed by the discus-sion of how data frames with categorical data can be regarded as generalizations of histograms and their advantages. The paper, then, describes how AlphaTwirl summarizes event data as
event data
(e.g., trees) categorical data(data frames)
AlphaTwirl R, pandas
summarize
Figure 1.Large event data are summarized by AlphaTwirl into categorical data, which are imported as data frames in R and pandas.
well as how it selects events and adds variables on the fly. The paper also mentions features of the implementation, such as dependency injection, framework independent modules, and concurrency.
2 Event data and categorical data
Event data and categorical data can be distinguished as follows.
Event data.Event data are any data with one entry per event. Events can be any kind from coin tosses, to bank transactions, to proton-proton collisions at the LHC. Data in ROOT trees are typically event data. Event data can be very large because they have as many entries as the number of the events. Event data are often stored on dedicated storage systems.
Categorical data.Categorical data are any data with one entry per category, for example, histograms. Categorical data are summaries of event data. They are usually small because they only have as many entries as the number of the categories—small enough to be loaded into memory on a laptop computer.
3 Data frames as generalizations of histograms
Data framesare a common data structure in R and pandas. Data frames, in their usual form, have a two-dimensional tabular structure: differentcolumnscontain different variables,
dif-ferentrowsdifferent entries. Data frames can express both event data1and categorical data.
Histograms are a widely used data structure in high energy physics. In fact, ROOT has dedicated classes for histograms, such as TH1D and TH2D. Histograms are a special case of categorical data. Histograms are lists of the sums of weights for each category, where categories are specified, for example, by one or a combination of ordered labels, unordered labels, discrete variables, and intervals of discrete or continuous variables.
Data frames can express histograms, as in the following example:
process ht njet met n nvar
QCD 400 2 200 4.44e+05 2.83e+07
QCD 400 2 220 2.96e+05 1.68e+07
QCD 400 2 240 1.90e+05 9.83e+06
.. .
TTJets 1200 6 1180 1.43e -01 1.49e -02
TTJets 1200 6 1200 7.09e -01 9.07e -02
The example data frame is a histogram of yields of proton-proton collision events at the LHC evaluated in Monte Carlo simulation in intervals of three kinematic variables (ht,njet, met) for each generated process such as QCD. The data frame has six columns. The first
four columns (process,ht,njet,met) specify categories—four dimensional categories. The processis unordered labels; the other three dimensions,ht,njet, andmet, are intervals of
numerical variables. In this example, the intervals are represented by their lower edges.2 The
1Event data with multiple variable-length lists, e.g., a list of jets and a list of muons, can be expressed by data frames in several ways; for example, (a) by a data frame with as many rows per event as the length of the longest lists in the event, or (b) by multiple data frames—one data frame per list, as common in relational databases.
2The locations of upper edges can be stored in data frames in many different ways. One method is to use lower edges as bin labels as in the example and only include all non-empty bins and the next bins of all non-empty bins in a data frame. The next bins of all non-empty bins are included so that the upper edges of all non-empty bins can be found. Notice that upper edges of empty bins have no information about data.
data frame has as many rows as the categories, that is, the unique combinations of all possible values in the first four columns. The other two columns (n,nvar) show, respectively, the sums of the weights and the sums of the squares of the weights; namely,nandnvarin each row are summaries of the events in the category specified by the first four columns.
As can be seen from the above example, data frames can express arbitrary dimensions of histograms with categories specified by combinations of different types of variables such
as strings, integers, and floats. In addition, data frames can have an arbitrary number of summary columns. For example, data frames can include columns formeans,minima, and maximaof numerical variables.3 In short, histograms are summaries of event data and can be
generalized to multivariate categorical data, which can be expressed as data frames.
4 Advantages of data frames—data wrangling, visualization
Once event data are summarized into multivariate categorical data, they can be imported as data frames in R and pandas, both of which offer a rich set of data wrangling tools: sort by
values, concatenate, merge by keys, reshape between long and wide formats, and so on. In particular, the split-apply-combinestrategy [11] has many applications. These tools make it easy to write flexible and configurable analysis code, which, for example, can help users quickly try many different analysis methods to exploit the event data.
Furthermore, multivariate categorical data in data frames in R are readily visualized by lattice[12],ggplot2[13], and other R visualization packages; data frames in pandas can be similarly visualized byseaborn[14] and other Python packages. These visualization tools can, for example, let users quickly investigate how events are distributed in a multidimen-sional kinematic phase space.
5 Why does AlphaTwirl summarize event data?
Why does AlphaTwirl summarize event data? In other words, why not simply convert the data type of event data to data frames?
It is usually possible to convert the data type to data frames. For example, there are tools to convert ROOT trees to data frames of R and pandas, such asRootTreeToR[15] and root_pandas[16]. However, event data are often too large for R and pandas because they both usually load all data into memory. In fact, a set of event data analyzed for a single publication in CMS is not nearly small enough to fit in memory on a typical desktop or laptop computer even in the smallest format of NanoAOD. Consequently, it is not straightforward to fully benefit from the data wrangling and visualization tools mentioned in the previous section on a whole set of event data even if their data types are somehow converted to data frames.
On the other hand, the next step after the conversion in many analyses in high energy physics, in particular binned analyses, would be to make histograms, or, in more general terms, summarize the event data into categorical data. For these reasons, AlphaTwirl summa-rizes event data as it loads them4rather than converting the data type.
6 Summarizing event data by split-apply-combine strategy
Event data can be summarized into multivariate categorical data as a data frame by the split-apply-combine strategy [11]:
3A summary can also be a variable-length array, in which case, a data frame will have as many rows per category as the length of the array for the category.
split:split event data into groups determined as categories. apply:apply a function to summarize the data in each group. combine:combine the results as a data frame.
In fact, histograms can be created by this strategy—split data into bins, sum the weights in each bin, and combine the results. Withdplyr[17] in R or the functiongroupby()of pandas,
this strategy can be easily used for small event data. An aim of AlphaTwirl is to summarize large event data as they stream by the split-apply-combine strategy.5
Code example.Users can specify how to summarize event data by a Python dictionary. The following code is a simple example of creating a two-dimensional histogram:
dict( key_name =(’ht’, ’jet_pt ’), key_index =(None , 0), key_binning =( Binning ( boundaries =(400 , 800, 1200)) ,
RoundLog (0.1 , 100)))
This simple example only specifies groups into which tosplitdata. The example does not specify a summarizing function toapplyor a method tocombine, letting the default determine them; the default summarizing function counts the number of the entries in each group and the results are by default combined into a data frame, that is, making a data frame with an unweighted histogram. The above example dictionary has three entries. Their values are tuples with the same length:
key_name: Names of categorical variables or variables whose intervals are categorical variables,htandjet_ptin the example. They can
be branch names if the input data is a ROOT tree. They can also be names of variables created on the fly byscribblers,
described in Section8.
key_index: Indices to be used for each variable in thekey_nameif the
variable is an array. In the example, the first index isNone
because the first variablehtis not an array.6The second
variablejet_ptis an array. The second index,0, will be its
index, i.e.,jet_pt[0]. Indices of arrays can be flexibly
specified as described below.
key_binning: Functions to place values into intervals for each variable in the key_name. They can be any functions that take a value and return a bin name. TheBinningandRoundLogare functors included in AlphaTwirl. TheBinningfunctor uses the specified bin boundaries. TheRoundLogfunctor uses bins with an equal width in the log scale. The first argument0.1is the width in the
log scale and the second argument100is a boundary; therefore,
the bin boundaries are· · ·,101.9,102,102.1,102.2,· · ·.7
If summary methods require variables to be summarized, for example, taking the mean of a variable, the variable names and indices can be specified with, respectively,val_nameand val_indexin similar ways tokey_nameandkey_index.
5The new ROOT classRDataFrame[18], which first appeared in ROOT v6.14/00 in 2018, can summarize large ROOT trees by a similar strategy; that is, it can aggregate data in trees by a user-defined accumulation operation.
6Internally, scalar variables are implemented as Python lists with single elements. The index0can be, therefore, used as well instead ofNone.
7Unless optionally specified, the smallest and largest boundaries are determined by the system, for example,
split:split event data into groups determined as categories. apply:apply a function to summarize the data in each group. combine:combine the results as a data frame.
In fact, histograms can be created by this strategy—split data into bins, sum the weights in each bin, and combine the results. Withdplyr[17] in R or the functiongroupby()of pandas,
this strategy can be easily used for small event data. An aim of AlphaTwirl is to summarize large event data as they stream by the split-apply-combine strategy.5
Code example.Users can specify how to summarize event data by a Python dictionary. The following code is a simple example of creating a two-dimensional histogram:
dict( key_name =(’ht’, ’jet_pt ’), key_index =(None , 0), key_binning =( Binning ( boundaries =(400 , 800, 1200)) ,
RoundLog (0.1 , 100)))
This simple example only specifies groups into which tosplitdata. The example does not specify a summarizing function toapplyor a method tocombine, letting the default determine them; the default summarizing function counts the number of the entries in each group and the results are by default combined into a data frame, that is, making a data frame with an unweighted histogram. The above example dictionary has three entries. Their values are tuples with the same length:
key_name: Names of categorical variables or variables whose intervals are categorical variables,htandjet_ptin the example. They can
be branch names if the input data is a ROOT tree. They can also be names of variables created on the fly byscribblers,
described in Section8.
key_index: Indices to be used for each variable in thekey_nameif the
variable is an array. In the example, the first index isNone
because the first variablehtis not an array.6 The second
variablejet_ptis an array. The second index,0, will be its
index, i.e.,jet_pt[0]. Indices of arrays can be flexibly
specified as described below.
key_binning: Functions to place values into intervals for each variable in the key_name. They can be any functions that take a value and return a bin name. TheBinningandRoundLogare functors included in AlphaTwirl. TheBinningfunctor uses the specified bin boundaries. TheRoundLogfunctor uses bins with an equal width in the log scale. The first argument0.1is the width in the
log scale and the second argument100is a boundary; therefore,
the bin boundaries are· · ·,101.9,102,102.1,102.2,· · ·.7
If summary methods require variables to be summarized, for example, taking the mean of a variable, the variable names and indices can be specified with, respectively,val_nameand val_indexin similar ways tokey_nameandkey_index.
5The new ROOT classRDataFrame[18], which first appeared in ROOT v6.14/00 in 2018, can summarize large ROOT trees by a similar strategy; that is, it can aggregate data in trees by a user-defined accumulation operation.
6Internally, scalar variables are implemented as Python lists with single elements. The index0can be, therefore, used as well instead ofNone.
7Unless optionally specified, the smallest and largest boundaries are determined by the system, for example,
sys.float_info.minandsys.float_info.max.
Indices of arrays—wildcards, back references.Indices of arrays can be flexibly specified withwildcardsandback references. For example, a four-dimensional categorical variable of pTandηof all possible pairs of a jet and a muon can be specified as follows.
dict( key_name =(’jet_pt ’, ’jet_eta ’, ’muon_pt ’, ’muon_eta ’), key_index =(’(*) ’, ’\\1 ’, ’(*) ’, ’\\2 ’), ...)
The syntax is inspired by the regular expression. The wildcard’*’indicates all elements of
the array. Ifkey_indexcontains multiple wildcards, all possible combinations of the elements
from each array are used. The back reference’\\n’ indicates the same index as the n-th
wildcard within parentheses.
7 Event selections and graph theory
Some events may not be needed. Conditions of event selections can be flexibly specified as nested conditions combined with the logical conditions,All,Any, andNot. An example code
is as follows.
dict(All=(’ev: ev.ht [0] >= 400 ’,
dict(Any=(’ev: ev.njet [0] == 1’,
dict(All=(’ev: ev.njet [0] >= 2’, ’ev: ev: ev.mht [0] >= 200 ’)) ))))
A condition can be specified by a string or dictionary. A string such as’ev: ev.ht[0] >= 400’ will be parsed and executed as a Python lambda, where the argumentev will be the
event object, which will be described in Section10. Each dictionary has one entry with the key’All’,’Any’, or’Not’. If the key is’All’or’Any’, the value is a tuple of conditions.
If the key is’Not’, the value is a condition. If the key is’All’, events need to satisfy all
conditions in the tuple. If the key is’Any’, events need to satisfy at least one condition in the
tuple. If the key is’Not’, events should not satisfy the condition.
Event selections are implemented asdirected treeswith each condition as a vertex. For example, the above example code corresponds to the following graph.
All
ev.ht[0] >= 400 Any
ev.njet[0] == 1 All
ev.njet[0] >= 2 ev.mht[0] >= 200
Each vertex has one incoming edge except the one at the top. The logical conditionsAlland Anycan have any number of ordered outgoing edges. The logical conditionNot(not used in the example) has one outgoing edge. The conditions specified by strings have no outgoing edges (leaves). Event data can be summarized at leaves. Scribblers, described in the next section, can be placed at leaves as well.
The graph implementation makes it easier to add functionalities in vertices and edges. In fact, AlphaTwirl includes two sets of implementations of the logical conditionsAll,Any,
andNot. While one only evaluates the conditions themselves, the other counts the number
of events satisfying each condition connected to outgoing edges, which, for example, can be used to generate selection efficiency (cutflow) tables. Furthermore, users can provide their
8 Scribblers—adding variables
If input event data do not contain variables used for selecting or summarizing events, they can be created on the fly byscribblers. AlphaTwirl does not include a scribbler. Scribblers are usually provided by users.
A collection of scribblers can be found in Ref. [19]. It includes scribblers that apply NumPy[20] functions to arrays, form objects from arrays with the same length, flatten objects to arrays, select objects by the graph implementation described in the previous section, correct objects by a given function, and match objects based on a distance calculated by a given function. These scribblers can, for example, be used to form a list of jet objects from arrays such asjet_pt,jet_eta, apply jet energy corrections, and flatten back to multiple arrays.
CMS EDM trees [21] contain persistent objects of classes. In such a case, scribblers need to be developed to unpack persistent objects into primitive types and their arrays.
9 Implementation features
Dependency injection.Classes in AlphaTwirl generally operate on arguments of their meth-ods (duck typing)—a code example in the next section. Therefore, the actual implementa-tions of nearly all functionality are determined at runtime and can be provided by the user. Examples from the previous sections include binning functors, logical conditions of event selections, and scribblers.
Framework independent modules. Conversely, each particular implementation does not normally depend on AlphaTwirl either. Therefore, they can be reused in a different framework
with simple adapters. For example, the graph implementation of event selections can be reused in Heppy. Users can extend, customize, and replace almost any functionality with reusable code at runtime.
Concurrency. Large event data can be split into chunks and processed concurrently with multiple cores or batch systems. AlphaTwirl includes code to use Python multiprocess-ing[22] and HTCondor [23]. Users can provide code to use other systems at runtime; for example, the SGE system can be used with the code in Ref. [24]. Input data can be split in terms of the numbers of files and events. While jobs are running in background processes or a batch system, the main process is running in the foreground, monitoring the progress of the jobs, and collecting the results as jobs finish. Failed jobs are automatically resubmitted.
10 Event readers, event objects, and event loops
This section describes how operations and features discussed in the previous four sections work together with a code excerpt. Schematically, the classEventLoopis implemented as
follows.
class EventLoop :
def __init__ (self, build_events , reader ):
self. build_events = build_events
self. reader = reader
def __call__ (self):
events = self. build_events ()
self. reader .begin( events )
for ev in events :
self. reader .event(ev)
self. reader .end ()
8 Scribblers—adding variables
If input event data do not contain variables used for selecting or summarizing events, they can be created on the fly byscribblers. AlphaTwirl does not include a scribbler. Scribblers are usually provided by users.
A collection of scribblers can be found in Ref. [19]. It includes scribblers that apply NumPy[20] functions to arrays, form objects from arrays with the same length, flatten objects to arrays, select objects by the graph implementation described in the previous section, correct objects by a given function, and match objects based on a distance calculated by a given function. These scribblers can, for example, be used to form a list of jet objects from arrays such asjet_pt,jet_eta, apply jet energy corrections, and flatten back to multiple arrays.
CMS EDM trees [21] contain persistent objects of classes. In such a case, scribblers need to be developed to unpack persistent objects into primitive types and their arrays.
9 Implementation features
Dependency injection.Classes in AlphaTwirl generally operate on arguments of their meth-ods (duck typing)—a code example in the next section. Therefore, the actual implementa-tions of nearly all functionality are determined at runtime and can be provided by the user. Examples from the previous sections include binning functors, logical conditions of event selections, and scribblers.
Framework independent modules. Conversely, each particular implementation does not normally depend on AlphaTwirl either. Therefore, they can be reused in a different framework
with simple adapters. For example, the graph implementation of event selections can be reused in Heppy. Users can extend, customize, and replace almost any functionality with reusable code at runtime.
Concurrency. Large event data can be split into chunks and processed concurrently with multiple cores or batch systems. AlphaTwirl includes code to use Python multiprocess-ing[22] and HTCondor [23]. Users can provide code to use other systems at runtime; for example, the SGE system can be used with the code in Ref. [24]. Input data can be split in terms of the numbers of files and events. While jobs are running in background processes or a batch system, the main process is running in the foreground, monitoring the progress of the jobs, and collecting the results as jobs finish. Failed jobs are automatically resubmitted.
10 Event readers, event objects, and event loops
This section describes how operations and features discussed in the previous four sections work together with a code excerpt. Schematically, the class EventLoopis implemented as
follows.
class EventLoop :
def __init__ (self, build_events , reader ):
self. build_events = build_events
self. reader = reader
def __call__ (self):
events = self. build_events ()
self. reader .begin( events )
for ev in events :
self. reader .event(ev)
self. reader .end ()
return self. reader
Instances of this class are the event loops that are dispatched to background processes or to worker nodes of batch systems8and executed concurrently.Event loopsloop over events and
haveevent readersread each event. Event readers can be scribblers, objects that select events, objects that summarize event data, orcompositesof these in thecomposite pattern[25]. Event readers in AlphaTwirl do not need inherit from any particular base class, which makes event readers portable as discussed in the previous section. The objectreaderin the code above
can be a single event reader, a composite of event readers, or the object at the top of the directed tree described in Section7. EachEventLoopinstance loops over a different set of
events. Typically, the iterable objecteventsor its iterator is connected to input data files and,
at each iteration, loads data for one event into theevent objectev.
The classEventLoopsimply operates on the objects it initially receives—just as a feature
described in the previous section—and does not depend on the natures of events or the reader. They can be determined at runtime. AlphaTwirl includes the iterable events that load event data from ROOT trees with only primitive types such as integers and floats and arrays of those.9 Iterable events that load from Delphes trees and CMS EDM trees can be found,
respectively, in Ref [26] and Ref [27]. The packageatuproot[28] includes iterable events that load many events to the event object at each iteration from ROOT trees by using columnar access ofuproot[29], which can be used together with event readers that can read multiple events at a time. It is also possible to develop iterable events that load data from sources other than ROOT files.
11 Summary
AlphaTwirl summarizes large event data into multivariate categorical data by the split-apply-combine strategy. The indices of input variables can be flexibly specified with wildcards and back references. Event selections are implemented as directed trees with each condition as a vertex, at which functionalities can be implemented. New variables can be added on the fly by scribblers. Nearly any functionality can be extended or customized with reusable code. AlphaTwirl can concurrently process event data with multiple cores or batch systems.
Multivariate categorical data can be regarded as generalizations of histograms and im-ported as data frames in R and pandas, which makes it easier to develop flexible and con-figurable analysis code with data wrangling tools in R and pandas. Multivariate categori-cal data imported as data frames are readily visualized by graphic tools available in R and Python, which for example help users visually inspect event distributions in a multidimen-sional phase space.
References
[1] R Core Team,R: A Language and Environment for Statistical Computing, R Foundation for Statistical Computing, Vienna, Austria (2017),
https://www.R-project.org/
[2] W. McKinney,Data Structures for Statistical Computing in Python, inProceedings of the 9th Python in Science Conference, edited by S. van der Walt, J. Millman (2010) [3] CMS collaboration,The CMS Experiment at the CERN LHC, JINST3, S08004 (2008) [4] R. Brun, F. Rademakers,ROOT: An object oriented data analysis framework, Nucl.
Instrum. Meth.A389, 81 (1997)
8Because of the dispatch,build_eventsandreaderneed to be serializable (picklable). The objecteventsdoes not need to be serializable. Thereaderdoes not need to stay serializable after itbegins until itends.
[5] J. de Favereau et al.,DELPHES 3, A modular framework for fast simulation of a generic collider experiment, JHEP02, 057 (2014),1307.6346
[6] C. Bernet,Heppy: a python framework for high-energy physics data analysis,
https://github.com/cbernet/heppy
[7] G. Petrucciani, A. Rizzi, C. Vuosalo,Mini-AOD: A New Analysis Data Format for CMS, J. Phys. Conf. Ser.664, 072052 (2015),1702.04685
[8] A. Rizzi, G. Petrucciani,A further reduction in CMS event data for analysis: the NanoAOD format, CHEP 2018
[9] T. Sakuma, H. Flaecher, D. Smith,Alternative angular variables for suppression of QCD multijet events in new physics searches with missing transverse momentum at the LHC,1803.07942(2018)
[10] T. Sakuma,GitHub repository of AlphaTwirl,
https://github.com/alphatwirl/alphatwirl
[11] H. Wickham,The Split-Apply-Combine Strategy for Data Analysis, Journal of Statistical Software40, 1 (2011)
[12] D. Sarkar,Lattice: Multivariate Data Visualization with R(Springer-Verlag, 2008), ISBN 978-0-387-75968-5
[13] H. Wickham,ggplot2: Elegant Graphics for Data Analysis(Springer-Verlag, 2009) [14] M. Waskom,Seaborn,doi:10.5281/zenodo.592845
[15] A. Lyon,Analysis of Experimental Particle Physics Data in R with the RootTreeToR Package,useR! 2007
[16] C. Burr et al.,root_pandas,doi:10.5281/zenodo.593933
[17] H. Wickham, R. François, L. Henry, K. Müller,dplyr: A grammar of data manipulation,https://CRAN.R-project.org/package=dplyr
[18] E. Guiraud, A. Naumann, D. Piparo,RDataFrame,doi:10.5281/zenodo.260230 [19] T. Sakuma,scribblers: a collection of framework independent producers of event
attributes,doi:10.5281/zenodo.1797429
[20] T.E. Oliphant,A Guide to NumPy(Trelgol Publishing, 2006)
[21] C.D. Jones, M. Paterno, J. Kowalkowski, L. Sexton-Kennedy, W. Tanenbaum,The new CMS Event Data Model and Framework, Proceedings, CHEP 2006
[22] multiprocessing — Process-based parallelism,
https://docs.python.org/3/library/multiprocessing.html
[23] D. Thain et al.,Distributed computing in practice: the condor experience., Concurrency - Practice and Experience17, 323 (2005)
[24] S. Breeze,atsge: Alphatwirl tools to submit jobs to an SGE batch,
https://pypi.org/project/atsge/0.1.8/
[25] E. Gamma et al.,Design patterns : elements of reusable object-oriented software (Addison-Wesley, 1994), ISBN 0-201-63361-2
[26] T. Sakuma,atdelphes: AlphaTwirl framework for Delphes trees, doi:10.5281/zenodo.1843918
[27] T. Sakuma,atcmsedm: AlphaTwirl framework for CMS EDM trees, doi:10.5281/zenodo.1843954
[28] S. Breeze,atuproot: alphatwirl interface to process and read ROOT TTrees with uproot,https://pypi.org/project/atuproot/0.1.5/
[29] J. Pivarski et al.,uproot: ROOT I/O in pure Python and Numpy,