1
Fabric Phase Sorptive Extraction Explained
Abuzar Kabir *, Rodolfo Mesa, Jessica Jurmain, Kenneth G. Furton
International Forensic Research Institute, Department of Chemistry and Biochemistry, Florida International University, 11200 SW 8th Street, Miami, FL 33199, USA
*Corresponding author: E-mail: [email protected]. Tel.: +1 305 348 2396; Fax: +1 304 348 4172;
ABSTRACT
2
Keywords: fabric phase sorptive extraction (FPSE); sol-gel; phenols; environmental pollution; sample preparation; microextraction
1. Introduction
Sample preparation is an important but often neglected step in chemical analysis[1]. The importance of an efficient sample preparation technique becomes more inevitable when dealing with trace and ultra-trace levels of target analyte(s) dispersed in complex sample matrices e.g., environmental, pharmaceutical, food, and biological samples. These samples are not generally suitable for direct injection into the analytical instrument. Three main factors may be attributed to this unsuitability of direct instrumental injection. First, the matrix ingredients may exert detrimental effect on the performance of the analytical instrument, or they may interfere with the analysis of target analytes; second, the concentration of the target analyte(s) in the sample matrix may be below the detection limit of the analytical instrument. Third, the sample matrix may be incompatible with the analytical instrument. As such, the primary objective of sample preparation is to isolate and concentrate the target analyte(s) from various sample matrices to a new solvent/solvent system and to minimize matrix interference so that the cleaner analyte(s) solution can be introduced into the analytical instrument for separation, identification, and quantification.
3
Pawliszyn and co-workers in 1987[5] as a solvent-free/solvent-minimized microextraction technique [1]. Due to the substantial advantages over conventional sample preparation techniques, SPME has gained enormous popularity within a very short period of time. The broad spectrum applications of SPME have been extensively reviewed in a number of recent articles [6,7,8].
However, some major shortcomings of SPME are yet to be addressed. Among others, one major shortcoming of SPME (fiber format) is the miniscule amount (typically ~0.5 µL) of sorbent loading which often results in poor extraction sensitivity[9]. The low extraction sensitivity of fiber-SPME prompted the invention of a number of microextraction techniques with higher sorbent loading including in-tube SPME[10], SBSE[11], MEPS[12], rotating-disk sorptive extraction (RDSE)[13], and thin film microextraction (TFME)[14].
SPME and its different formats, modifications and implementations are generally governed by two principle criteria: (1) thermodynamics; and (2) kinetics[15]. Thermodynamic properties determine the maximum amount of analytes that can be extracted by a given mass of sorbent under a specific set of extraction conditions. Since higher sorbent loading allows accumulation of larger amount of target analytes by the sorbent when adequate time is allowed to reach the extraction equilibrium, sorbent loading is directly related to extraction efficiency. On the other hand, kinetics controls the rate of extraction and hence the time required to reach the extraction equilibrium. The faster the extraction equilibrium, the higher is the throughput in the analytical lab. As a result, there is a pressing demand for developing new microextraction techniques that can simultaneously satisfy the required sensitivity (by increasing sorbent loading) and reduce the sample preparation time to its lowest level (by minimizing the extraction equilibrium time).
4
immobilizing the sorbent on the substrate surface[16] and, (2) the physical format of the extraction system14 that determines the primary contact surface area (PCSA) of the device and consequently the extraction kinetics . PCSA is defined as the surface area of the extraction medium that can be accessed directly by the sample matrix containing the analytes during the extraction process. Therefore, if a sample preparation technique is to be highly sensitive as well as fast, both the coating technology and the PCSA have to be augmented.
5
porosity, a thin film of sol-gel coating can extend equivalent or higher sensitivity than commercially available, thick SPME coatings. The high porosity of the sol-gel coating also makes it possible to reach extraction equilibrium in a fraction of the time that is often required by commercial SPME fibers.
Although tremendous efforts have been made to increase the sensitivity of the microextraction systems by merely increasing the sorbent loading on the same substrate (fused silica fiber/glass tube), little work has been done to increase the primary contact surface area (PCSA) of the extraction device. The increase in PCSA of the extraction device not only allows higher sorbent loading without increasing the coating thickness, but may also considerably reduce the extraction equilibrium time. TFME, SBSE, RDSE etc. were developed to increase the PCSA, but the use of conventional sorbent immobilization approach did not offer much benefit in boosting the sensitivity of these systems.
6
extraction so that solvent evaporation and sample reconstitution may be avoided; and (6) ability to reach extraction equilibrium fast enough so that field sampling and sample preparation do not become an inconvenient task.
Taking all of these challenges into consideration, a new green sample preparation approach, fabric phase sorptive extraction (FPSE) has been developed[24, 25], which creatively addresses majority of the problems often encountered in contemporary sample preparation practices. In addition to the advanced material properties of sol-gel derived hybrid organic-inorganic sorbents, FPSE has successfully utilized flexibility, permeability, and the rich surface chemistry of natural/synthetic fabric substrates, resulting in a microextraction sorbent chemically bonded to the substrate with a very high, readily accessible active extraction surface for fast and high efficiency analyte(s) extraction. FPSE has introduced major advantages in solvent-less/solvent-minimized sample preparation techniques including an extraordinarily high primary contact surface area (PCSA), and the ability to directly preconcentrate the target analyte(s) even from excessively complicated sample matrices containing debris, cells, proteins, particulates etc.
7
processing and pharmaceutical industries, organic synthesis, and oil refineries[46]. Substituted phenols have severe health implications for human kidneys, heart, lungs and the central nervous system[47,48]. As a result, a rapid and efficient sample preparation strategy is warranted to monitor these pollutants.
2. Materials and methods
2.1 Chemicals and materials
All chemicals used in the study were of analytical grade or superior. 4-chlorophenol, 3,5-dimethylphenol, 2,6-dichlorophenol, 2,4,6-trichlorophenol, 2,4-diisopropyl phenol, acetone, dichloromethane, methyltrimethoxysilane (MTMS), and trifluoroacetic acid (TFA) were purchased from Sigma-Aldrich (St. Louis, MO). Sodium hydroxide and hydrochloric acid were purchased from Thermo Fisher Scientific (Milwaukee, WI). Polyethylene glycol was purchased from Alfa Aesar (Ward Hill, MA). Fabric phase sorptive extraction vials (20 mL) and HPLC sample vials (2 mL) were purchased from Supelco (St. Lois, MO). HPLC grade methanol and water were purchased from Fisher Scientific (Pittsburg, PA). Unbleached Muslin 100% cotton cellulose fabrics were purchased from Jo-Ann Fabric (Miami, FL).
2.2 Instrumentation
8
particle free solutions was carried out in an Eppendorf Centrifuge Model 5415 R (Eppendorf North America Inc. USA). A Fisher Scientific Digital Vortex Mixer (Fisher Scientific, USA) was employed to thoroughly mixing different solutions. On-line data collection and processing of chromatographic data was done using ChemStation software (Revision A.08.03) for Windows (Agilent Technologies, USA). A Philips XL30 scanning electron microscope equipped with an EDAX detector was used to obtain SEM images presented in the article. A Parkin Elmer Spectrum 100 FT-IR Spectrometer equipped with Universal ATR Sampling Accessory (Santa Clara, CA) was used to perform FT-IR characterization of the substrates and FPSE media coated with sol-gel sorbents. A Barnstead NANOPure Diamond (model D11911) deionized water system (Dubuque, IA) was employed to obtain high purity deionized water (18.2 MΩ) used in sol-gel synthesis and aqueous sample preparation for fabric phase sorptive extraction.
2.3 Surface cleaning and activation of fabric substrates
A 100 cm2 segment of the cellulose fabric was cleaned with a copious amount of deionized water, followed by soaking in 1 M NaOH solution for 1 h under continuous sonication. The base-treated fabrics were then washed several times with deionized water, followed by treating with 0.1 M HCl solution for 1 h under sonication. The treated fabric was then washed with copious amount of deionized water and finally dried in an inert atmosphere overnight. The dried fabric was stored in clean airtight glass container until they are coated with sorbents.
9
sol-gel precursor (MTMS), 20 mL methylene chloride as the organic solvent, 4 mL trifluoroacetic acid (5% water) as the sol-gel catalyst. The mixture was then vortexed for 3 min, centrifuged for 5 min and finally the clear supernatant of the sol solution was transferred to a clean 3 oz. amber colored glass reaction bottle.
2.5 Creation of sol-gel PEG coatings on the substrate surface
For both sol-gel PEG coatings, cellulose fabric was used as the substrate. The clean and treated fabrics were gently inserted into the reaction bottle containing the sol solution so that a three-dimensional network of sol-gel PEG could be formed on the surface of the substrate as well as throughout the porous matrix. The fabrics were kept inside the sol solution for a pre-determined period. Upon completion of the coating period, the sol solution was expelled from the reaction bottle and the coated fabrics were dried and aged in a home-made conditioning device built inside a gas chromatography oven with continuous helium gas flow at 50 °C for 24 h. Before using for extraction, the sol-gel PEG coated fabrics were rinsed sequentially with methylene chloride and methanol followed by drying at 50 °C under an inert atmosphere for 1 h. The fabric phase sorptive extraction media coated with sol-gel PEG were then cut into 2.5 cm x 2.0 cm pieces (area of each side, 5 cm2) and stored in a closed glass container to prevent contamination.
2.6 Preparation of standard solutions for fabric phase sorptive extraction
10 2.7 Fabric phase sorptive extraction procedure
A 5 cm2 piece (2.5 cm x 2.0 cm) of sol-gel PEG coated FPSE device was immersed in 1 mL methanol: acetonitrile (50:50, v/v) for 5 min to ensure cleanliness. The device was air dried to remove the residual organic solvent. The clean FPSE device was then immersed into the sampling vial (10 mL) containing the sample impregnated with the analytes of interest. A small Teflon coated magnet was placed into the vial. Finally, the vial was placed on top of a magnetic stirrer to promote diffusion of the analytes throughout sample for a predetermined period of time. After that, the FPSE device was removed from the sampling vial and was shaken off or dried with a Kim wipe. This is particularly important if the prepared sample is to be analyzed in gas chromatography.
2.8 Back-extraction/Solvent desorption
The analytes extracted on the FPSE device were back-extracted into a suitable solvent system. 500 µL of the solvent system was transferred into a 10 mL glass vial. The dry FPSE device containing the extracted analytes was immersed into the solvent mixture. The back-extraction was carried out by simply keeping the FPSE device immersed into solvent system for a predetermined period and no external diffusion mechanism (stirring/sonication) was imposed. The back-extraction solution containing the extracted analytes was then transferred into an Eppendorf tube for centrifugation to compel any remaining particulates to precipitate. Finally, the particle free preconcentrated solution of analytes was transferred into a HPLC sample vial for chromatographic analysis. In order to reuse the FPSE medium in future, it was cleaned with 1 mL methanol: acetonitrile (50:50, v/v) for 5 min, dried on a watch-glass for 5 min and then stored in a clean glass container.
11 3.1 Theoretical considerations
The principle of fabric phase sorptive extraction, similar to SPME and related equilibrium-driven sorptive microextraction techniques[50,14,51] is based on the interactions between the analyte(s) and the extraction sorbent. Under equilibrium extraction conditions, the amount of analyte extracted by FPSE medium is proportional to the partition coefficient between the extraction phase and the sample matrix (Kes), volume of the extracting phase (Ve), and the original concentration of the analyte (C0) as expressed in Equation 1:
=
Equation 1When the sample volume is large compared to the volume of the extraction sorbent, KesVe<<Vs, Equation 1 can be simplified to:
=
Equation 2As Equation 2 suggests, the amount of the extracted analyte is directly proportional to the volume of the extraction sorbent and hence can be increased by expanding the volume of the extraction sorbent if the analyte concentration is kept constant.
However, according to the kinetic theory of extraction, expanding the volume of extraction sorbent by increasing the coating thickness of sorbent may result in long extraction equilibrium time as expressed in Equation 3. When the extraction sorbent is dispersed as a thin film on the substrate, the diffusion of analytes through the boundary layer controls the extraction kinetic (rate of extraction). As such, the time required to extract 95% of the equilibrium extraction amount of the analytes, te,95% can be calculated as:
12
Where b is the extraction sorbent thickness, δ is the boundary layer thickness, Kes is the distribution constant of analyte between the extraction sorbent and the sample matrix, Ds is the diffusion coefficient of the analyte in the sample matrix, and B is a geometric factor referring to the geometry on which the extraction sorbent is coated.
As is evident from Equation 3, the equilibrium extraction time can be reduced by reducing the coating thickness (b), by increasing primary contact surface area of the extraction medium (smaller B value), or by increasing the analyte diffusion in the sample matrix by applying external stimuli e.g., stirring, sonication, shaking etc.
Also, the rate of extraction in sorptive microextraction is not linear. The extraction rate is very fast in the beginning of the extraction process and slows down as the extraction progresses towards the equilibrium. The initial rate of extraction is proportional to the surface area of the extraction phase as shown in Equation 4:
= Equation 4
Therefore, it is obvious that in order to increase the sensitivity of the microextraction system, the loading of the sorbent has to be increased. On the other hand, to reduce the extraction equilibrium time, surface area of the extraction device has to be increased.
3.2 Significance of porous substrates for microextraction sorbent
13
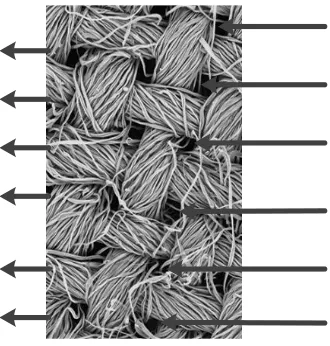
Under the influence of external stimuli (stirring, sonication, etc.), a continuous flow of the sample moves toward the substrate holding the microextraction sorbent for interaction. When an impermeable substrate such as fused silica fiber is used, the flow bounces back and collides with the incoming flow, redirecting some of the incoming flow away from the substrate surface. As a consequence, only a fraction of target analytes interact with the sorbent. On the contrary, when the substrate is permeable, a majority of the incoming flow of the sample penetrates the surface without being redirected. As a result, the mass transfer between the sorbent and sample occurs rapidly, within a fraction of the time required for similar interactions with impermeable substrates. This is consistent with the experimental result obtained by Alcudia-León[52]. She compared the extraction behavior of stir bars coated with impermeable PTFE of varying surface areas to a porous PTFE membrane unit. The highest extraction sensitivity was obtained by the porous stir-membrane among all the test devices even though it had a low surface area relative to the impermeable units. This observation was a clear manifestation of the potential role of porous substrates as hosts for microextraction sorbents.
3.3 Surface Chemistry of Cellulose Substrate
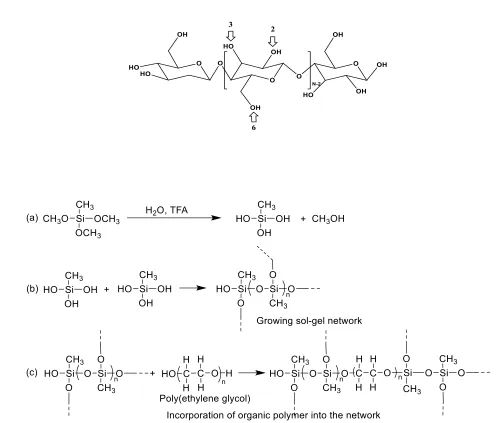
Cellulose is a hydrophilic linear polymer of β-D-glucopyranose, whose structure is shown in Figure 2. Each dimer of cellulose contains three hydroxyl functional groups in positions 2, 3, and 6 which can participate in polycondensation during the sol-gel coating process at a varying degree of reactivity[53]. As such, cellulose seems to be an excellent candidate as a potential substrate for sol-gel sorbent coating.
14
important treatment that improves its chemical reactivity and significantly increases the availability of all the hydroxyl groups for chemical reactions[54].
3.4 Sol-gel coating process on fabric phase sorptive extraction media
Sol-gel process in creating the sorbent coatings on cellulose substrate involves the following reactions:
(i) Catalytic hydrolysis of sol-gel precursor
(ii) Polycondensation of hydrolyzed precursors, leading to a growing sol-gel network
(iii) Random incorporation of sol-gel active organic polymer into the growing sol-gel network (iv) Immobilization of the growing sol-gel network on the substrate surface via
polycondensation
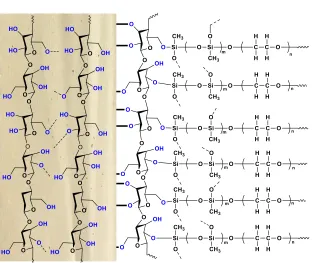
Under the appropriate experimental conditions, sol-gel precursor MTMS undergoes hydrolysis in the presence of sol-gel catalyst, trifluoroacetic acid (TFA). The hydrolyzed MTMS molecules then participate in polycondensation to create a sol-gel network. Sol-gel active organic polymer, poly(ethylene glycol) present in the respective sol solution enters randomly into the growing sol-gel network during this step. Polycondensation of the sol-sol-gel network with the available hydroxyl functional groups of cellulose results in a thin, chemically bonded layer of sorbent wrapped on cellulose microfibrils.
A tentative reaction scheme of the sol-gel process is given in Fig. 3. Fig. 4 demonstrates the schematic representation of sol-gel PEG coated FPSE media.
15 3.5 FTIR Characterization of FPSE media
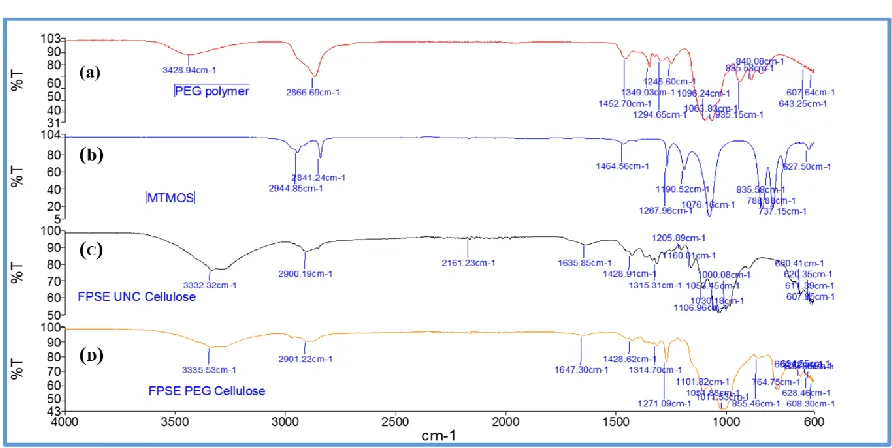
Fig. 5 shows FT-IR spectra of uncoated cellulose, MTMS, poly(tetrahydrofuran furan), poly(ethylene glycol), and sol-gel PEG coated FPSE media. As can be seen from the FT-IR spectra, MTMS[55] demonstrates characteristic Si-O-C-H band at 2944 cm-1. Uncoated cellulose demonstrated characteristics peaks at 3332 cm-1 and 2900 cm-1, 1315 cm-1, and at 1030 cm-1 corresponding to O-H, C-H and C-O stretching and C-H bending vibration, respectively. In the fingerprint region between 1428 cm-1 and 850 cm-1, the characteristic peaks were recorded at 1105 cm-1 (C-O-C) bridges, glycoside bonds; 1029 cm-1 C-OH primary alcohols, 1052 cm-1 C-OH secondary alcohols, 1000 cm-1, 983 cm-1 –CH- bonds[56]. The characteristic peak of poly(ethylene glycol) include 2866 cm-1, 1349 cm-1 which represent different vibration modes of C-H bonds. The peak at 1294 cm-1 and 1248 cm-1 belong to C-C double bond[57]. For sol-gel PEG coated FPSE devices, no additional signals of deposited sol-gel network were clearly visible due to the overlapping with characteristic absorption bands of uncoated fabrics. However, the sol-gel coated FPSE media demonstrated a decrease in the absorption bands, which is considered to be clear manifestation of the presence of the coating on the substrate[58].
3.6 Sorbent loading and coating reproducibility
16
mass of sol-gel sorbent. Average mass of sol-gel PEG sorbent on FPSE media were calculated as 8.63 mg/cm2 (~43.2 mg/ 5 cm2 FPSE unit).
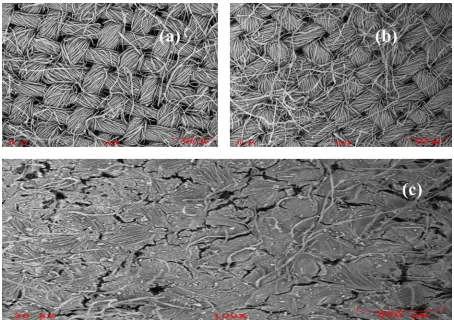
3.7 Scanning electron microscopy of FPSE media
Figure 6 represents scanning electron micrographs (SEM) of uncoated, surface activated, and sol-gel coated FPSE media. As is evident from these micrographs, cellulose substrate is made up of microfibrils within the individual thread that are weaved to form the fabric. In addition to the inherent pores, capillaries, voids, and interstices, cellulose fibers are woven to contain well defined pores which are dependent upon their end usage. Low viscosity sol solution can easily permeate through the microfibrils and pores to create a uniform ultra-thin layer of sorbent coating on the surface. As such, sol-gel coating on FPSE media is not limited to only its outer surface. Instead, the coating is bonded throughout the three dimensional matrix of the substrate, resulting in a comparatively larger extraction surface with enhanced sorption capacity for the target analytes.
3.8 Analyte Sorption Capacity Study
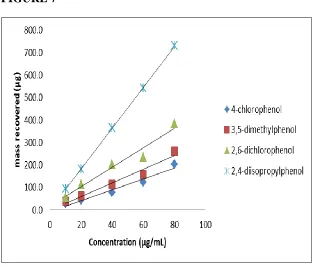
As seen in Section 3.6, FPSE media contained high volume of sorbents. This high sorbent loading should be translated into high sample capacity. In order to establish the maximum amount of analytes FPSE media can retain, the FPSE media were exposed to a series of increasingly higher concentration of analytes. An aliquot of each solution was injected before and after the extraction. Extraction of phenols up to 80 ppm without competing against each other. As such, a 5 cm2 unit of sol-gel PEG coated FPSE media was able to retain approximately 2000 µg of phenols (combined), which is about 10% of the sorbent loading. This high sample capacity may open up a new application of FPSE media as a scavenger of environmental pollutants.
17
Exposing FPSE media to different organic solvents for solvent mediated desorption is an integral part of the FPSE process if analytes are to be transferred to a suitable organic solvent for subsequent analysis. Unlike commercially available SPME fibers, due to the strong chemical bonding between the sorbent and the substrate of FPSE media, they can be exposed to any organic solvent. To verify that, a set of 3 FPSE media were used to extract phenols before and after exposing to acetone, methylene chloride, and acetone: methylene chloride (50:50 v/v) (for 8 hrs. at room temperature). No significant changes were observed between the extraction sensitivity before and after the treatments. Adjusting the pH of the sample matrix to maximize the ionizable analytes is a common practice routinely used by analytical chemists. The chemical stability of FPSE media were evaluated for both acidic (pH 1) and basic (pH 12) environment. Extractions were performed in triplicate before and after an 8 h exposure to an acidic or basic environment. Extraction sensitivity was similar for all fabrics before and after the acid/base treatment. Although both silica based sorbent and cellulose substrate are vulnerable to highly acidic/basic environments, our experiment suggests that short exposure of FPSE media to highly acidic and basic environment does not have an impact on their performances. Thus, FPSE media coated with sol-gel PEG sorbents have demonstrated remarkable operational stability.
3.10 Optimization of fabric phase sorptive extraction (FPSE) conditions
In order to maximize the extraction efficiency of FPSE as a novel, new generation microextraction technique, a number of factors that can impact extraction performance were evaluated including sample volume, extraction time, stirring speed, back-extraction solvent type and volume, and ionic strength.
18
Although FPSE follows the general principle of sorption-based microextraction techniques, the high sorbent loading and extended primary contact surface area (10 cm2 for a typical 5 cm2 FPSE unit) have made this system different from other microextraction techniques. Therefore, it is important to study the impact of sample volume on the extraction behavior. The amount of analyte extracted in any microextraction system is expected to increase with the increase in the sample volume up to a certain point, at which no further increase is expected. This optimum sample volume was determined by extracting substituted phenols at 5 ng/mL concentration from 10 mL, 15 mL, and 20 mL aqueous solutions for 40 min. The extraction results revealed that there is no statistically significant difference (p ≥ 0.05) in the extraction of 3,5-dimethyl phenol, 2,4,6-trichlorophenol, and 2,4-diisopropyl phenol between 10 mL, 15 mL, and 20 mL. However, a slight change (statistically significant, but practically insignificant) was observed for 4-chlorophenol and 2,6-dichlorophenol with different volumes. Higher volumes were seen to provide better extraction reproducibility. Based on these results, a 10 mL sample volume was used in all the subsequent experiments, although a 20 mL sample volume may be more optimal for ultra-trace analyses.
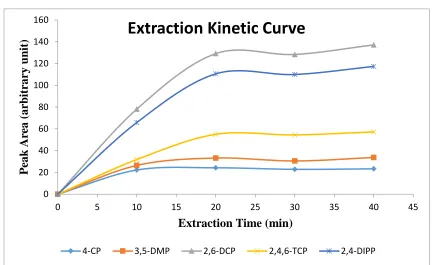
3.10.2 Extraction time
Extraction time is one of the most important factors that influence extraction efficiency. In this work, the effect of extraction time on substituted phenols were investigated in over the span of 10-40 min. Experimental data (Fig. 8) demonstrate that the extraction equilibrium for all five phenols was reached in 40 min.
3.10.3 Stirring speed
19
including sonication, heating the sample matrix, and stirring[61,62]. In the current study, different stirring speeds (0-1100 rpm) were studied to determine the impact of stirring on extraction sensitivity. Extraction sensitivity of all 5 analytes was increased with higher stirring speed. Based on the results obtained, a stirring speed of 1100 rpm was selected as optimum.
3.10.4 Effect of salt content
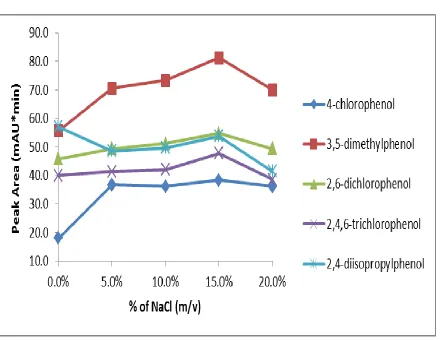
Adding salt to the sample matrix generally decreases the solubility of organic analytes in water and thus results in higher extraction efficiency. On the other hand, the presence of salt in the sample matrix increases the viscosity of the solution and consequently reduces the rate of diffusion of the analytes. Since both factors counter-balance each other, experimental determination of the impact of salt addition is recommended[62]. The influence of salt was studied by adding different amounts of sodium chloride ranging from 0-20% (w/v) to the sample. Addition of salt in substituted phenols solution generally increased sensitivity up to 15% NaCl (w/v) (Fig. 9). Therefore, NaCl concentration at 15% (w/v) is considered optimum for extracting substituted phenols from aqueous solutions.
3.10.5 Optimization of elution solvent, volume of solvent and elution time
20
relative to the back-extraction solvents. The back-extraction of high polarity compound 4-chlorophenol (logKow 2.4) was favored by highest polarity solvent MeOH. 2,6-di4-chlorophenol (logKow 2.7), being relatively less polar, was better extracted by MeOH: ACN. However, other substituted phenols did not show preference for any specific solvents. Because the MeOH:ACN mixture provided better reproducibility in solvent back-extraction, it was considered optimum and was used as the back-extraction solvent in all subsequent experiments.
Due to the ultra-thin coating of sol-gel sorbent as well as well-preserved pores in the fabric substrate, it was expected that low viscosity organic solvent would easily penetrate the sorbent to quantitatively desorb the extracted analytes back very fast. Two desorption times, 5 min and 10 min were investigated with the MeOH: ACN (50:50 v/v) mixture. No discernible difference in extraction sensitivity was observed between 5 min and 10 min desorption, therefore a 5 min back extraction was accepted as the optimum desorption time.
Our experiments showed that 500 µL of the ACN:MeOH mixture is the minimum volume needed for complete immersion of the 5 cm2 FPSE unit and quantitative desorption of analytes without any carry over problem. The ultra-thin coating of highly porous sol-gel sorbent is easily accessible to organic solvent without any external stimuli (e.g., stirring, sonication), resulting in complete desorption within a very short period of time. A low volume of back-extraction solvent maintains the preconcentration achieved from the extraction, and therefore, reduces the time required for typically laborious and time consuming solvent elution and sample reconstitution steps.
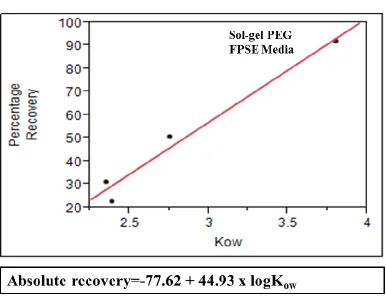
3.11 Model correlating octanol-water coefficient and absolute recovery
21
FPSE media using its octanol-water coefficient value. In order to develop this model, a series of substituted phenol solutions (10 ppm, 20 ppm, 40 ppm, 60 ppm, and 80 ppm) were prepared in DI water. For each compound, a calibration curve was developed using concentration and corresponding chromatographic peak area. All samples were analyzed in HPLC-UV before and after the fabric phase sorptive extraction in triplicate. The single and average absolute recovery of individual compounds across the concentration range was calculated. The average for an individual compound was plotted against its logKow value. Fig. 10 shows that substituted phenols demonstrates excellent linear relationship between average absolute recovery and logarithm of octanol-water coefficient. This graphs can be used as a predictive tool to estimate absolute recovery of a compound using its logKow value and may assist in selecting the appropriate FPSE media suitable for a particular analytical problem.
(1) Model for sol-gel PEG: Absolute percentage recovery= -77.61822 + 44.931167*logKow
3.12 Analytical performance
The analytical parameters including linear range, correlation coefficient (r2), intra-day and inter-day repeatability, and limit of detection of substituted phenols were investigated under the optimized extraction conditions and are presented in Table 1[sample volume 10 mL, stirring speed 1100 rpm, salt content 15%, extraction time 40 min, desorption time 5 min, and desorption solvent MeOH: ACN (50/50)].
22
3.13 Analysis of prepared sample using multiple analytical systems
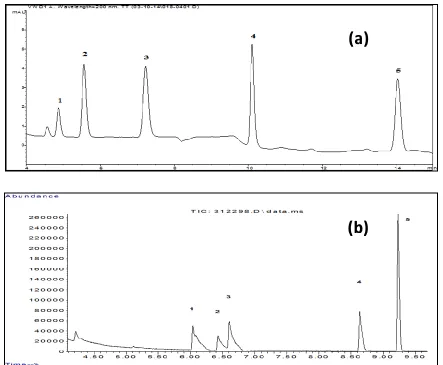
As different chromatographic systems have different advantages, e.g., GC favors the analysis of low molecular weight compounds, whereas the HPLC is suitable for medium to high molecular weight compounds. In some cases, the whole ranges of analytes are of interest. Samples are prepared differently for both the system which inflicts additional burden to the analyst. FPSE has ingeniously solved this problem. Selection of a solvent equally compatible to both the GC and HPLC as the FPSE back-extraction solution and injection of the eluent simultaneously into the GC and HPLC may offer complimentary information that cannot be obtained from either of the systems alone.
Fig.11. presents GC and HPLC chromatograms obtained from analyzing the same sample prepared by FPSE.
3.14 Method comparison
A literature review of selected methods used for the determination of substituted phenols is presented in Table 2. As evident from the Table, the new FPSE method has unequivocally demonstrated superior extraction sensitivity, higher pre-concentration factor, precision and simplicity. Considering only a fraction of the eluent was injected for analysis, the sensitivity of FPSE method can be easily increased even further by evaporating 500 µL sample solution to dryness and reconstituting the sample in a smaller volume of organic solvent or by increasing injection volume.
3.15 Applications of the FPSE-HPLC-UV methods for environmental sample analysis
23
high content of suspended soil particles and biomass. However, no filtration or other clean-up procedure was applied to these samples prior to FPSE procedure. Extraction recoveries of sol-gel PEG coated FPSE media were calculated by comparing the extraction efficiency obtained by extracting spiked environmental blank samples with 50 µg/L of substituted phenols compounds to that of the deionized water at the same concentration. The relative percentage recovery data of substituted phenols are shown in Table 3.
The percentage recovery of substituted phenols in tap water, pond water, and reclaimed water were in the range of 19.7-91.0, 21.9-109.5, and 40.7-106.8, respectively. The probable cause of the low recovery of substituted phenols in environmental water may be attributed to the formation of complexes with numerous treatment chemicals and/or particulates. A holistic investigation is needed to understand the real cause behind the low recovery of substituted phenols from environmental water samples.
4. Conclusions
24
solvent equally compatible with both gas chromatography and liquid chromatography opens up the possibility of analyzing the same preconcentrated sample simultaneously in GC and LC to obtain complimentary information, if necessary. High chemical stability of FPSE media extends the ability of matrix pH adjustment between pH 1 to pH 12 which is often important to efficiently extract ionizable compounds (organic acids/bases) from aqueous solution. High sorbent loading in FPSE media provided very high sample capacity. The inherently porous structure of the sol-gel sorbent and the permeability of fabric have significantly reduced the equilibrium extraction time from hours to minutes, making FPSE an excellent field-deployable sample preparation technique. Parts per trillion level detection sensitivities were achieved for substituted phenols. Eliminating the necessity of sample clean-up prior to the extraction, FPSE presents a new possibility in analyzing complex samples such as environmental water, biological fluids, foods, and pharmaceuticals with high matrix interference, leading to high quality analytical data that truly represents the sample of interest.
Acknowledgements
The authors would like to thank Dr. Tatiana Trejos, Trace Evidence Analysis Facility and Mr. Thomas Beasley, Florida Center for Analytical Electron Microscopy at Florida International University for their help in obtaining SEM images. Linda Maiben’s help as an undergraduate research assistant is also highly appreciated.
References
1. Kabir, A.; Furton, K. G.; Malik, A., Innovations in sol-gel microextraction phases for solvent-free sample preparation in analytical chemistry. TrAC Trends in Analytical Chemistry 2013, 45 (0), 197-218.
2. Wang, H.; Yan, H.; Qiu, M.; Qiao, J.; Yang, G., Determination of dicofol in aquatic products using molecularly imprinted solid-phase extraction coupled with GC-ECD detection. Talanta 2011, 85 (4), 2100-2105.
25
4. Ribeiro, C.; Tiritan, M. E.; Rocha, E.; Rocha, M. J., Development and Validation of a HPLC-DAD Method for Determination of Several Endocrine Disrupting Compounds in Estuarine Water. Journal of Liquid Chromatography & Related Technologies 2007, 30 (18), 2729-2746.
5. Pawliszyn, J.; Liu, S., Sample introduction for capillary gas chromatography with laser desorption and optical fibers. Analytical Chemistry 1987, 59 (10), 1475-1478.
6. Ribeiro, C.; Ribeiro, A. R.; Maia, A. S.; Goncalves, V. M. F.; Tiritan, M. E., New Trends in Sample Preparation Techniques for Environmental Analysis. Critical Reviews in Analytical Chemistry 2014,
44 (2), 142-185.
7. Spietelun, A.; Marcinkowski, L.; de la Guardia, M.; Namiesnik, J., Recent developments and future trends in solid phase microextraction techniques towards green analytical chemistry. Journal of Chromatography A 2013, 1321, 1-13.
8. Risticevic, S.; Niri, V. H.; Vuckovic, D.; Pawliszyn, J., Recent developments in solid-phase microextraction. Analytical and Bioanalytical Chemistry 2009, 393 (3), 781-795.
9. Bigham, S.; Medlar, J.; Kabir, A.; Shende, C.; Alli, A.; Malik, A., Sol-gel capillary microextraction. Analytical Chemistry 2002, 74 (4), 752-761.
10. Eisert, R.; Pawliszyn, J., Automated in-tube solid-phase microextraction coupled to high-performance liquid chromatography. Analytical Chemistry 1997, 69 (16), 3140-3147.
11. Baltussen, E.; Sandra, P.; David, F.; Cramers, C., Stir bar sorptive extraction (SBSE), a novel extraction technique for aqueous samples: Theory and principles. Journal of Microcolumn Separations 1999, 11 (10), 737-747.
12. Abdel-Rehim, M., New trend in sample preparation: on-line microextraction in packed syringe for liquid and gas chromatography applications - I. Determination of local anaesthetics in human plasma samples using gas chromatography-mass spectrometry. Journal of Chromatography B-Analytical Technologies in the Biomedical and Life Sciences 2004, 801 (2), 317-321.
13. Richter, P.; Leiva, C.; Choque, C.; Giordano, A.; Sepulveda, B., Rotating-disk sorptive extraction of nonylphenol from water samples. Journal of Chromatography A 2009, 1216 (49), 8598-8602. 14. Bruheim, I.; Liu, X. C.; Pawliszyn, J., Thin-film microextraction. Analytical Chemistry 2003, 75 (4),
1002-1010.
15. Lucena, R., Extraction and stirring integrated techniques: examples and recent advances. Analytical and Bioanalytical Chemistry 2012, 403 (8), 2213-2223.
16. Chong, S. L.; Wang, D. X.; Hayes, J. D.; Wilhite, B. W.; Malik, A., Sol-gel coating technology for the preparation of solid-phase microextraction fibers of enhanced thermal stability. Analytical Chemistry 1997, 69 (19), 3889-3898.
17. Wright, B. W.; Peaden, P. A.; Lee, M. L.; Stark, T. J., FREE-RADICAL CROSS-LINKING IN THE PREPARATION OF NON-EXTRACTABLE STATIONARY PHASES FOR CAPILLARY GAS-CHROMATOGRAPHY. Journal of Chromatography 1982, 248 (1), 17-34.
18. Blomberg, L. G., Current aspects of stationary phase immobilization in open tubular column chromatography. Journal of Microcolumn Separations 1990, 2 (2), 62-68.
19. Graham, C. M.; Meng, Y. J.; Ho, T.; Anderson, J. L., Sorbent coatings for solid-phase microextraction based on mixtures of polymeric ionic liquids. Journal of Separation Science 2011,
34 (3), 340-346.
20. Musteata, F. M.; Walles, M.; Pawliszyn, J., Fast assay of angiotensin 1 from whole blood by cation-exchange restricted-access solid-phase microextraction. Analytica Chimica Acta 2005, 537 (1–2), 231-237.
26
22. Bagheri, H.; Mir, A.; Babanezhad, E., An electropolymerized aniline-based fiber coating for solid phase microextraction of phenols from water. Analytica Chimica Acta 2005, 532 (1), 89-95. 23. Liu, Y.; Shen, Y. F.; Lee, M. L., Porous layer solid phase microextraction using silica banded phases.
Analytical Chemistry 1997, 69 (2), 190-195.
24. Kabir, A.; Furton, K. G., Fabric phase sorptive extractors United States Patents and Trademark Office: 2016.
25. Kumar, R.; Gaurav; Heena; Malik, A. K.; Kabir, A.; Furton, K. G., Efficient Analysis of Selected Estrogens Using Fabric Phase Sorptive Extraction and High Performance Liquid Chromatography-Fluorescence Detection. Journal of Chromatography A (0).
26. Anthemidis, A.; Kazantzi, V.; Samanidou, V.; Kabir, A.; Furton, K. G., An automated flow injection system for metal determination by flame atomic absorption spectrometry involving on-line fabric disk sorptive extraction technique. Talanta 2016, 156–157, 64-70.
27. Aznar, M.; Alfaro, P.; Nerin, C.; Kabir, A.; Furton, K. G., Fabric phase sorptive extraction: An innovative sample preparation approach applied to the analysis of specific migration from food packaging. Analytica Chimica Acta 2016, 936, 97-107.
28. García-Guerra, R. B.; Montesdeoca-Esponda, S.; Sosa-Ferrera, Z.; Kabir, A.; Furton, K. G.; Santana-Rodríguez, J. J., Rapid monitoring of residual UV-stabilizers in seawater samples from beaches using fabric phase sorptive extraction and UHPLC-MS/MS. Chemosphere 2016, 164, 201-207. 29. Guedes-Alonso, R.; Ciofi, L.; Sosa-Ferrera, Z.; Juan Santana-Rodriguez, J.; del Bubba, M.; Kabir, A.;
Furton, K. G., Determination of androgens and progestogens in environmental and biological samples using fabric phase sorptive extraction coupled to ultra-high performance liquid chromatography tandem mass spectrometry. Journal of Chromatography A 2016, 1437, 116-126. 30. Heena; Kaur, R.; Rani, S.; Malik, A. K.; Kabir, A.; Furton, K. G., Determination of cobalt(II), nickel(II) and palladium(II) Ions via fabric phase sorptive extraction in combination with high-performance liquid chromatography-UV detection. Separation Science and Technology 2017, 52 (1), 81-90. 31. Huang, G.; Dong, S.; Zhang, M.; Zhang, H.; Huang, T., Fabric phase sorptive extraction: Two
practical sample pretreatment techniques for brominated flame retardants in water. Water Research 2016, 101, 547-554.
32. Kabir, V. F. S. A., Fabric Phase Sorptive Extraction in Pharmaceutical Analysis. Pharmaceutica Analytica Acta 2015, 6 (7), 1-3.
33. Karageorgou, E.; Manousi, N.; Samanidou, V.; Kabir, A.; Furton, K. G., Fabric phase sorptive extraction for the fast isolation of sulfonamides residues from raw milk followed by high performance liquid chromatography with ultraviolet detection. Food Chemistry 2016, 196, 428-436.
34. Kumar, R.; Dhingra, G.; Kabir, A.; Furton, K. G.; Malik, A. K., Development of a fabric-phase sorptive extraction with high-performance liquid chromatography and ultraviolet detection method for the analysis of alkyl phenols in environmental samples. Journal of Separation Science 2015, n/a-n/a.
35. Kumar, R.; Gaurav; Heena; Malik, A. K.; Kabir, A.; Furton, K. G., Efficient analysis of selected estrogens using fabric phase sorptive extraction and high performance liquid chromatography-fluorescence detection. Journal of Chromatography A 2014, 1359 (0), 16-25.
36. Lakade, S. S.; Borrull, F.; Furton, K. G.; Kabir, A.; Fontanals, N.; Maria Marcé, R., Comparative Study of Different Fabric Phase Sorptive Extraction Sorbents to Determine Emerging Contaminants from Environmental Water Using Liquid Chromatography-Tandem Mass Spectrometry. Talanta 2015, TALD1501278.
27
38. Locatelli, M.; Kabir, A.; Innosa, D.; Lopatriello, T.; Furton, K. G., A fabric phase sorptive extraction-High performance liquid chromatography-Photo diode array detection method for the determination of twelve azole antimicrobial drug residues in human plasma and urine. Journal of Chromatography B 2017, 1040, 192-198.
39. M. Roldan-Pijuan, R. L., S. Cardenas, M. Valcarcel, Abuzar Kabir, Kenneth G. Furton Stir fabric phase sorptive extraction for the determination of triazine herbicides in environmental water by using ultra-high performance liquid chromatography-UV detection. Joural of Chromatography A
2014, (under review).
40. Montesdeoca-Esponda, S.; Sosa-Ferrera, Z.; Kabir, A.; Furton, K. G.; Santana-Rodriguez, J. J., Fabric phase sorptive extraction followed by UHPLC-MS/MS for the analysis of benzotriazole UV stabilizers in sewage samples. Analytical and Bioanalytical Chemistry 2015, 407 (26), 8137-8150. 41. Racamonde, I.; Rodil, R.; Quintana, J. B.; Sieira, B. J.; Kabir, A.; Furton, K. G.; Cela, R., Fabric phase
sorptive extraction: a new sorptive microextraction technique for the determination of non-steroidal anti-inflammatory drugs from environmental water samples. Anal Chim Acta 2015, 865 (0), 22-30.
42. Samanidou, V.; Galanopoulos, L.-D.; Kabir, A.; Furton, K. G., Fast extraction of amphenicols residues from raw milk using novel fabric phase sorptive extraction followed by high-performance liquid chromatography-diode array detection. Analytica Chimica Acta 2015, 855 (0), 41-50. 43. Samanidou, V.; Kaltzi, I.; Kabir, A.; Furton, K. G., Simplifying sample preparation using fabric phase
sorptive extraction technique for the determination of benzodiazepines in blood serum by high-performance liquid chromatography. Biomedical Chromatography 2016, 30 (6), 829-836.
44. Samanidou, V.; Kehagia, M.; Kabir, A.; Furton, K. G., Matrix molecularly imprinted mesoporous sol-gel sorbent for efficient solid-phase extraction of chloramphenicol from milk. Analytica Chimica Acta 2016, 914, 62-74.
45. Samanidou, V.; Michaelidou, K.; Kabir, A.; Furton, K. G., Fabric phase sorptive extraction of selected penicillin antibiotic residues from intact milk followed by high performance liquid chromatography with diode array detection. Food Chemistry 2017, 224, 131-138.
46. Gruzdev, I. V.; Kuzivanov, I. M.; Zenkevich, I. G.; Kondratenok, B. M., Determination of methyl-substituted phenols in water by gas chromatography with preliminary iodination. Journal of Analytical Chemistry 2013, 68 (2), 161-169.
47. Sarafraz-Yazdi, A.; Amiri, A.; Rounaghi, G.; Hosseini, H. E., A novel solid-phase microextraction using coated fiber based sol-gel technique using poly(ethylene glycol) grafted multi-walled carbon nanotubes for determination of benzene, toluene, ethylbenzene and o-xylene in water samples with gas chromatography-flam ionization detector. Journal of Chromatography A 2011, 1218 (34), 5757-5764.
48. Zhang, W.-H.; Zhang, D.; Zhang, R.-J.; Xia, F.; Liu, Y.-F., Flow injection analysis of volatile phenols in environmental water samples using CdTe/ZnSe nanocrystals as a fluorescent probe. Analytical and Bioanalytical Chemistry 2012, 402 (2), 895-901.
49. Kabir, A.; Hamlet, C.; Malik, A., Parts per quadrillion level ultra-trace determination of polar and nonpolar compounds via solvent-free capillary microextraction on surface-bonded sol-gel polytetrahydrofuran coating and gas chromatography-flame ionization detection. Journal of Chromatography A 2004, 1047 (1), 1-13.
50. Jiang, R. F.; Pawliszyn, J., Thin-film microextraction offers another geometry for solid-phase microextraction. Trac-Trends in Analytical Chemistry 2012, 39, 245-253.
51. Cudjoe, E.; Vuckovic, D.; Hein, D.; Pawliszyn, J., Investigation of the Effect of the Extraction Phase Geometry on the Performance of Automated Solid-Phase Microextraction. Analytical Chemistry
28
52. Alcudia-Leon, M. C.; Lucena, R.; Cardenas, S.; Valcarcel, M., Stir Membrane Extraction: A Useful Approach for Liquid Sample Pretreatment. Analytical Chemistry 2009, 81 (21), 8957-8961. 53. Klemm, D., Comprehensive Cellulose Chemistry: Fundamentals and analytical methods.
Wiley-VCH: 1998.
54. Wakelyn, P. J.; Bertoniere, N. R.; French, A. D.; Thibodeaux, D. P.; Triplett, B. A.; Rousselle, M. A.; Goynes, W. R.; Edwards, J. V.; Hunter, L.; McAlister, D. D., Cotton Fiber Chemistry and Technology. Taylor & Francis: 2010.
55. Aegerter, M. A.; Koebel, M. M.; Leventis, N.; SpringerLink, Aerogels handbook. Springer: New York, 2011.
56. Tarbuk, A.; Grancaric, A. M.; Leskovac, M., Novel cotton cellulose by cationisation during the mercerisation process-part 1: chemical and morphological changes. Cellulose 2014, 21 (3), 2167-2179.
57. Kuche Loghmani, S.; Farrokhi-Rad, M.; Shahrabi, T., Effect of polyethylene glycol on the electrophoretic deposition of hydroxyapatite nanoparticles in isopropanol. Ceramics International
2013, 39 (6), 7043-7051.
58. Montarsolo, A.; Periolatto, M.; Zerbola, M.; Mossotti, R.; Ferrero, F., Hydrophobic sol-gel finishing for textiles: Improvement by plasma pre-treatment. Textile Research Journal 2013, 83 (11), 1190-1200.
59. Pedersen-Bjergaard, S.; Rasmussen, K. E.; Grønhaug Halvorsen, T., Liquid–liquid extraction procedures for sample enrichment in capillary zone electrophoresis. Journal of Chromatography A 2000, 902 (1), 91-105.
60. Esrafili, A.; Yamini, Y.; Shariati, S., Hollow fiber-based liquid phase microextraction combined with high-performance liquid chromatography for extraction and determination of some antidepressant drugs in biological fluids. Analytica Chimica Acta 2007, 604 (2), 127-133.
61. Pawliszyn, J.; Lord, H. L., Handbook of Sample Preparation. Wiley: 2012.
62. Risticevic, S.; Lord, H.; Gorecki, T.; Arthur, C. L.; Pawliszyn, J., Protocol for solid-phase microextraction method development. Nature Protocols 2010, 5 (1), 122-139.
Figure Captions:
Figure 1 Comparison of liquid flow behavior through a permeable and impermeable substrate
Figure 2. Chemical structure of cellulose substrate demonstrating available hydroxyl functional groups for anchoring sol-gel inorganic-organic network
Figure 3. Chemical reactions involved in the synthesis of surface-bonded sol-gel PEG coatings on fabric substrate.
Figure 4. Schematic representation of surface bonded sol-gel PEG coating on cellulose fabric surface.
Figure 5. FT-IR spectra of different components in (a) poy(ethylene glycol) polymer; (b) MTMS; (c) uncoated cellulose substrate; (d) sol-gel PEG coated FPSE media.
29
Figure 7. Analyte sorption capacity study for sol-gel PEG coated FPSE device.
Figure 8. Extraction profiles of substituted phenols for the sol-gel PEG coated FPSE device. Figure 9. Graphs demonstrating the impact of salt addition to the FPSE efficiency for extracting substituted phenols.
Figure 10. Graphs showing relationship between absolute percentage recovery and log Kow for sol-gel PEG coated FPSE media.
Impermeable microextraction substrate Permeable microextraction substrate
Due to the easy permeation of the incoming flow through the pores of the extraction surface, no stream bounces back to the reverse direction.
Consequently, favors high rate of mass transfer from the sample matrix to the extraction sorbent and results in a very short extraction equilibrium time.
0 20 40 60 80 100 120 140 160
0 5 10 15 20 25 30 35 40 45
P
eak
Ar
ea
(ar
b
itr
ar
y
u
n
it)
Extraction Time (min)
Extraction Kinetic Curve
Compound
class Analyte
Linear Range (µgL-1)
Determination Co-efficient
(R2 )
Repeatability (RSD%)a
LODc (µgL-1)
Intra-dayb Inter-dayb
Substituted Phenols
4-chlorophenol (4-CP) 1-5000 0.9970 1.8 25.5 0.03 3,5-dimethylphenol (3,5-DMP) 1-5000 0.9997 1.6 9.8 0.01 2,6-dichlorophenol (2,6-DCP) 1-5000 0.9983 1.3 0.5 0.04 2,4,6-trichlorophenol
(2,4,6-TCP) 1-5000 0.9952 1.6 6.0 0.02
2,4-diisopropylphenol
(2,4-DIPP) 1-5000 0.9981 5.1 4.9 0.02
a Expressed as relative standard deviation
b Intra- and inter-day repeatability was calculated by analyzing water samples spiked with substituted phenols at 50 µgL-1 within one day (n=5) and over a period of three days (n=3)
Analytesa Sample Preparation Method Sorbent Chemistry Analytical Instrument Limit of
Detection (µgL
-1)
Reference
2,4-DCP; 2,4,6-TCP SPME
Vinyl-SBA-15 mesoporous organosilica
GC-MS 0.002-0.004 [1]
4-CP; 2,6-DCP; 2,4,6-TCP
HS-SPME (after
derivatization) PDMS/DVB GC-ECD 0.0001-0.122 [2] 4-CP;2,4,6-TCP HS-SPME polyaniline GC-FID 1.3-58 [3] 2,6-DCP; 2,4,6-TCP HS-SPME Polyacrylate GC-MS 0.0500 [4]
2,4,6-TCP SPME Polyacrylate
UV; HPLC-ED
2.0 (UV); 0.017
(ED) [5] 4CP; 3,5DMP; 2,6-DCP;
2,4,6-TCP; 2,4-DIPP FPSE sol-gel PEG HPLC-UV 0.01-0.03
Current study
aAbbreviations: 4-Chlorophenol (4-CP); 2,6-Dichlorophenol (2,6-DCP); 2,4,6-Trichlorophenol (2,4,6-TCP); 3,5-Dimethylphenol
(3,5-DMP); 2,4-Diisopropylphenol (2,4-DIPP)
[1] F. Zhu et al. J. Chromatogr. A 1247 (2012) 42-48
Analyte Sample Matrix Amount Added, ng
Amount Recovered, ng
Relative Recovery(%)
%RSD (n=3)
4-chlorophenol
Tap water 100
91.0 91.0 3.6
3,5-dimethylphenol 73.2 73.2 1.3
2,6-dichlorophenol 19.7 19.7 11.4
2,4,6-trichlorophenol 26.9 26.9 2.0
2,4-diisopropylphenol 35.8 35.8 15.9
4-chlorophenol
Pond water 100
109.5 109.5 0.9
3,5-dimethylphenol 88.0 88.0 3.3
2,6-dichlorophenol 21.9 21.9 7.8
2,4,6-trichlorophenol 34.5 34.5 5.7
2,4-diisopropylphenol 77.2 77.2 6.3
4-chlorophenol
Reclaimed water 100
106.8 106.8 4.4
3,5-dimethylphenol 90.7 90.7 1.2
2,6-dichlorophenol 40.7 40.7 7.2
2,4,6-trichlorophenol 57.0 57.0 7.3
2,4-diisopropylphenol 90.8 90.8 9.9