Available online:
https://edupediapublications.org/journals/index.php/IJR/
P a g e | 408Voltage SAG analysis in loop power distribution system
with SFCL
VALLALA BABU RAO M-Tech Student Scholar
Department of Electrical & Electronics Engineering, Laqshya Institute of Technology & Sciences,
Telangana, India. EM ail: [email protected]
M r. K NAVEEN Assistant Professor
Department of Electrical & Electronics Engineering, Laqshya Institute of Technology & Sciences,
Telangana, India. EMail:[email protected]
Abstract- Interruptions to supply and sags of distribution syst em voltage are the main aspects causing customer complaints. There is a need for analysis of supply reliabilit y and volt age sag t o relate sy st em p erformance wit h net work st ruct ure and equipment design paramet ers. T his analy sis can also give p rediction of volt age dip s, as well as relat ing t radit ional reliability and momentary outage measures to the propert ies of p rotection syst ems and t o net work imp edances. Exist ing reliability analysis software often requires substantial t raining, lacks automated facilities, and suffers from dat a availabilit y . T hus it requires time-consuming manual int ervent ion for t he st udy of large networks. Distribution system reliabilit y can be divided into two aspects: system adequacy and system security . Adequacy describes the normal state capability of the system t o supply customer demands. Security describes the ability of t he system to continue to supply the customer in spite of fault s in t he network. In this paper, the improvement of the voltage sag is analyzed according to the fault locat ion, resist ance value of SFCL, and the length of the loop power dist ribut ion sy st em. First , a resist or-t y p e SFCL model is used using t he M ATLAB/SIMULINK. Next, t he loop p ower dist ribut io n system is modeled. Finally, when the SFCL is inst alled in t he radial or loop power distribution system with various lengt hs, voltage sags are evaluated according to various fault locat ions. T he results of voltage sag analy sis in t he loop sy st em are compared with the voltage sags in radial p ower dist ribut ion system. In extension to the work discussed in paper the sy st em can be tested under different Loading conditions and a study on p ositioning of super conducting fault current limit er can be analy z ed.
Index Terms—Loop power distribution system, superconducting fault current limit er (SFCL), volt age sag
I. INTRODUCTION
Superconducting Fault Current Limiter (SFCL) has been developed in the world and applied to substation of power distribution system in Korea. SFCL can limit the fault current in power system using the increased resistance caused by quenching characteristics of superconducting elements. In addition, SFCL can improve voltage quality not only in faulted phase but in non-faulted phase when a 1 phase to ground fault is occurred. The assessment method of voltage sag using the Information of Technology Industry Council curve is presented in Reference [1] when SFCL is applied to power distribution system. The parallel connection of radial systems via the
SFCL which can make voltage dips less severe is presented in Reference [2]. The improvement of voltage sags caused by decreased fault current is presented in References [3] and [4]. These studies dealt with the voltage sags in the power distribution system with SFCL. However, voltage quality such as voltage sag and overvoltage in faulted and non-faulted phase has been not dealt with. The magnitude of sag, whereas it may worsen the duration of sag because of the delayed trip time of a protective device by the decreased fault current. These effects of SFCL on voltage sags should be evaluated. Also, power distribution system will be changed to loop system such as micro grid or smart grid. Thus, effects of SFCLs should be evaluated and analyzed when SFCLs are installed in radial and loop power distribution system according to the location and impedance of SFCL, the length of feeder, and location of fault. However, the overall effects on voltage sag were not dealt with in the above mentioned studies.
In this paper, we assess the impact of SFCL on voltage sags in radial and loop power distribution system. In Section II, we model a resistor-type SFCL. In Section III, the voltage sag occurred by fault current is explained. In Section IV, we evaluate the voltage sag magnitude according to the fault location and resistance of SFCL in radial and loop power distribution system.
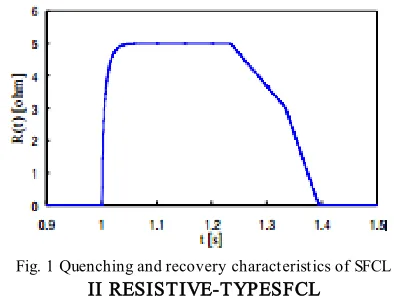
Fig. 1 Quenching and recovery characteristics of SFCL II RESISTIVE-TYPESFCL
Available online:
https://edupediapublications.org/journals/index.php/IJR/
P a g e | 409 elements of SFCL being applied to Korean powerdistribution systems. The impedance of SFCL according to time t is given at (1), where Rn and TF represent the impedance being saturated at normal temperature and time constant, respectively. In addition, t0, t1, and t2 represent quench-starting time, the first recovery-starting time, and the secondary recovery-starting time, respectively.
(1)
Fig. 1 represents quenching and recovery characteristics of the SFCL shown. When a reclosing scheme is 2 Fast 1 Delay (2F1D). When a fault is occurs in a power distribution system, the resistance of SFCL increases.
T ABLE I
PARAMET ERS OFMODELEDSFCL
If a reclose is tripped, SFCL is recovered. The scheme is repeated two times more. The used values for parameters are shown in Table I. The recovery time of SFCL is set to the value less than 0.5 s based on [9], because the reclosing time of power distribution system in Korea is 0.5 s.
III.VOLTA GE SA GS IN POW ER DISTRIBUTION SYSTEM
When faults occur in power distribution system, the automatic recloser or circuit breaker with over-current relay (OCR) and reclosing relay will open to clear the fault and automatically reclose after a time delay. This reclosing behavior can take place several times in an effort to establish a continuous service when a temporary fault occurs [11].
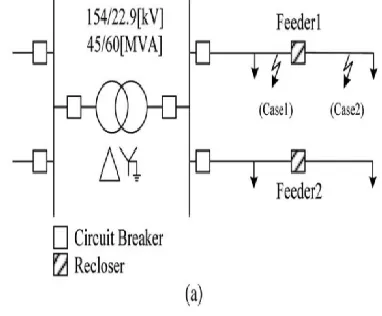
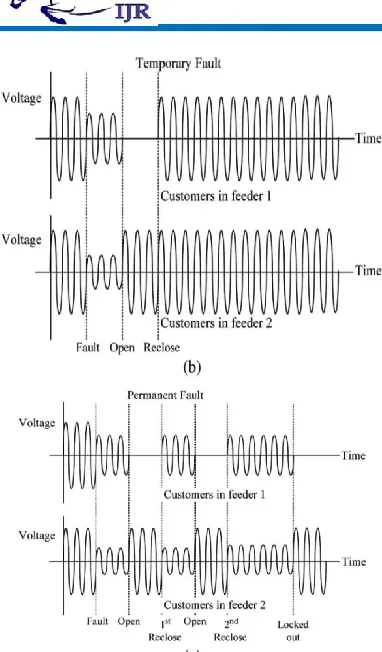
The voltage sag generally happens from fault. In case 1 in Fig. 2(a), if a temporary fault occurs between CB and recloser, the reclosing operation of the OCR of breaker will be successful and the momentary interruption will occur. In this case, the customers at feeder 1 (faulted feeder) will experience voltage sag and a momentary interruption. The customers at feeder 2 (neighbor feeder) will experience the voltage sag during the fast-trip time of the OCR and this is shown in Fig. 2(b).
However, if a permanent fault is occurs, the reclosing operations will be failed and the reclosing operation will be finally locked out. In this case, the customers in feeder 1 will experience three voltage sags, two momentary interruptions and a sustained interruption. The customers in feeder 2 will experience two voltage sags during the
fast-trip time of OCR and one voltage sag during the delay-trip time of OCR when reclosing scheme of OCR is 1F1D; this is shown in Fig. 2(c).during a fault.
In case 2 in Fig. 2(a), all sequences and phenomena is equal to that of case 1 such as the number of voltage sags, momentary interruptions, and sustained interruption except the fault clearing time of recloser instead of OCR. In other words, if a temporary fault is occurs, the customers at feeder 2 will experience the voltage sag during the fast-trip time of recloser instead of OCR, so on. As presented above, the automatic reclosing scheme in power distribution systems can produce various voltage sags to the customers on the neighbor feeder. Moreover, the number of neighbor feeder is about 6 to 10 while the number of faulted feeder is only one. Generally, a voltage magnitude at bus of secondary-side of main transformer (MTr.) during fault can be represented as equation (2) if fault impedance is ignored, a type of fault is 3-phase fault, and source voltage is 1.0 p.u.
Available online:
https://edupediapublications.org/journals/index.php/IJR/
P a g e | 410 Fig. 2 Voltage sag in power distribution system d. (a) Power systemconfiguration, (b) voltage sags of customers (temporary fault), and (c) voltage sags of customers (permanent fault).
IV A SSESSM ENT OF IM PA CT OF SFCL ON VOLTA GE SA GS
If SFCL is installed at the starting point of feeder, (2) is changed to equation (3) during fault.
(3) The voltage sag is improved more than the case without SFCL. To evaluate the improvement of voltage sag, the radial and loop power distribution system is modeled and the various cases are studied.
Fig. 3. Power distribution system model
T ABLE II
POWER DIST RIBUT ION SYST EM DAT A
T ABLE III
CASES FOR VOLT AGE SAG SIMULAT ION
A . Power Dis tribution Sys tem Model
Fig.3 represents the power distribution system model with SFCL and interconnecting switch to simulate voltage sags. Table II shows the data of Fig. 3.
B. Cas e Studies
Total 10 cases of contingency analysis are studied as shown in Table III. Case 1-x is for radial distribution system and Case 2-x is for loop distribution system. The resistance of SFCL ranges from 0 to 2Ω and the fault location is 1 to 6 km. The length of feeder 2 varies 1 to 6 km at loop distribution system.
V. M A TLA B/SIM ULINK RESULTS
Here the simulation is carried out by different cases they are 1) Radial distribution system Fault location without and with SFCL 2) loop distribution system Fault location without and with SFCL 3) radial distribution system Fault location without and with SFCL of R and RLC loading conditions 4) loop distribution system Fault location without and with SFCL of R and RLC loading conditions
Available online:
https://edupediapublications.org/journals/index.php/IJR/
P a g e | 411 Fig.4 Matlab/simulink model of radial distribution system Fault at 3 kmlocation without SFCL
Fig.5 Voltage and current wave in radial distribution system Fault at 3 km location without SFCL
Fig.6 Matlab/simulink model of radial distribution system Fault at 3 km location with SFCL
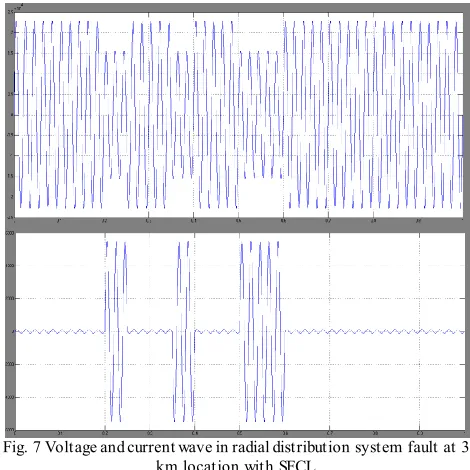
Fig. 7 Voltage and current wave in radial distribution system fault at 3 km location with SFCL
Cas e-2 loop distribution system Fault location without and with SFCL
Available online:
https://edupediapublications.org/journals/index.php/IJR/
P a g e | 412 Fig.9 Voltage and current wave in loop distribution system Fault at 3 kmlocation without SFCL
Fig.10 Matlab/simulink model of loop distribution system Fault location with SFCL
Fig. 11 Voltage and current wave in loop distribution system fault at 3 km location with SFCL
Cas e-3 radial distribution system Fault location without and with SFCL of R load
Fig.12 Matlab/simulink model of radial distribution system fault location without SFCLof R load
Fig.13 Matlab/simulink model of radial distribution system fault location with SFCLof R load
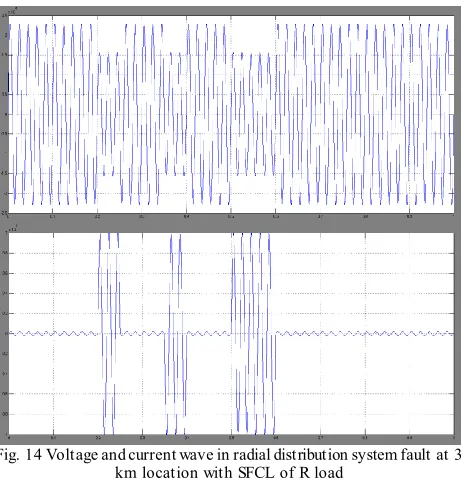
Fig. 14 Voltage and current wave in radial distribution system fault at 3 km location with SFCL of R load
Available online:
https://edupediapublications.org/journals/index.php/IJR/
P a g e | 413 Fig.15 Matlab/simulink model of loop distribution system Fault locationwithout SFCL of R load
Fig.16 Matlab/simulink model of loop distribution system Fault location without SFCL of RLC load
Fig.17 Voltage and current wave in loop distribution system Fault at 3 km location without SFCL of R and RLC loading conditions
VI. CONCLUSION
The main concept of this proposed converter is simulated at different loading conditions like R and RLC to check the performance of with and without SFCL conditions. Interruptions to supply and sags of distribution system voltage are the main aspects causing customer complaints. There is a need for analysis of supply reliability and voltage sag to relate system performance with network structure and equipment design parameters . The effect of SFCL on voltage sag is analyzed when a SFCL is installed to a radial and loop power distribution system.
Firstly, resistor-type SFCL and radial/loop power distribution system are modeled. The simulation results found that the voltage sags at loop distribution system is more severe than radial distribution system by the increased fault current. The resistance of SFCL ranges from 0 to 2Ω and the fault location is 1 to 6 km. The length of feeder 2 varies 1 to 6 km at loop distribution system. Moreover, the results of simulation represent the SFCL with bigger resistance is needed to improve the voltage sags in loop system. These all results verified through Matlab/simulink software.
REFERENCES
[1] J.-F. Moon, S.-H. Lim, J.-C. Kim and S.-Y. Yun, “Assessment of the impact of SFCL on voltage sags in power distribution system,” IEEE Trans. Appl. Supercond., vol. 21, no. 3, pp. 2161–2164, Jun. 2011. [2] L. Ye, L. Z. Lin, and K.-P. Juengst, “Application studies of superconducting fault current limiters in electric power systems,” IEEE Trans. Appl. Supercond., vol. 12, no. 1, pp. 900–903, Mar. 2002.
[3] J. C. Das, “Limitations of fault-current limiters for expansion of electrical distribution systems,”IEEE Trans. Ind. Appl., vol. 33, no. 4, pp. 1073– 1082, Jul./Aug. 1997. [4] F. Tosato and S. Quaia, “Reducing voltage sags through fault current limitation,” IEEE Trans. Power Del., vol. 16, no. 1, pp. 12–17, Jan. 2001.
[5] H.-R. Kim, H.-S. Choi, H.-R. Lim, I.-S. Kim and O.-B. Hyun, “Resistance of superconducting fault current limiters based on YBa2Cu3O7 thin films after quench completion,” Phys. C, Supercond. Vol. 372–376, pp. 1606–1609, Aug. 2002.
[6] S. H. Lim, S. R. Lee, H. S. Choi, and B. S. Han, “Analysis of operational characteristics of flux-lock type SFCL combined with power compensator,”IEEE Trans. Appl. Supercond., vol. 15, no. 2, pp. 131–134, Jun. 2005. [7] H. R. Kim, S. W. Yim, S. Y. Oh, and O. B. Hyun, “Recovery in superconducting fault current limiters at low applied voltages,”IEEE Trans. Appl. Supercond., vol. 18, no. 2, pp. 656–659, Jun. 2008.
Available online:
https://edupediapublications.org/journals/index.php/IJR/
P a g e | 414 [11] J. Arrillaga, N. R. Watson, and S. Chen, PowerSystem Quality Assessment. Chichester, U.K.: Wiley, 2000.
A u th o r’s Pro file:
VALLALA BABU RAO M .TECH (ELECTRICA L POW ER SYSTEM S) PURSUING In Laq s h y a In s titu te o f Technology Sciences ,TA NIKELLA (V)
,KHAMMAM(D), TELANGANA,
INDIA. EM ail id : [email protected]
M r. K NAVEEN was born in India in the y ear of 1991.He received B.Tech degree in Electrical and Electronics Engineering in t he y ear of 2012 & M .T ech PG in Electrical power syst ems in t he y ear of 2015 from JNT UH, Hy derabad. He is exp ert in Cont rol Sy st ems, Elect rical circuits, Power system and electrical machines Subject s. He is currently working as An Assistant Professor in EEE Department in Laqshya Institute of Technology and Sciences, Khammam,