IJPSR (2013), Vol. 4, Issue 1 (Research Article)
Received on 15 April, 2012; received in revised form, 08 November, 2012; accepted, 29 December, 2012
RP-HPLC METHOD DEVELOPMENT AND VALIDATION FOR NITAZOXANIDE IN POWDER FOR SUSPENSION DOSAGE FORM
Sharifa Sultana*1, Tanbir Ahammad 1, Md. Ashraful Islam 2 and A.S.S. Rouf 3
Department of Pharmacy, Daffodil International University 1, Dhaka, Bangladesh Incepta Pharmaceuticals Ltd. 2, Savar, Bangladesh
Department of Pharmaceutical Technology, University of Dhaka 3, Dhaka, Bangladesh
ABSTRACT
A simple, precise, accurate, rapid and reproducible RP-HPLC method has been developed for the determination of Nitazoxanide in powder for suspension dosage form. Chromatography was carried out on an ODS C18 column (250 x 4.6 mm x 5 µm length), using a mixture of acetonitrile and 0.005 mol L-1 tetra n- butyl ammonium hydrogen sulphate (54:46 v/v) as the mobile phase at a flow rate of 1 mL/min and the detection was done at 240 nm. The method produced linear responses in the concentration range from 50 to 150 µg/mL of Nitazoxanide with correlation coefficients of 0.999, accuracy of 98.90% and precision of 0.811%. The method was found to be reproducible for analysis of the drug in suspension dosage form. The results of the analysis were tested and validated statistically for various parameters according to ICH guidelines and recovery studies confirmed the accuracy of the proposed method.
INTRODUCTION: Nitazoxanide, N‐(5‐nitro‐2‐thiozoly) salicylamide acetate is an antiamoebic and anhtelmintic agent. It is indicated for amoebiasis, helminthiasis, giardiasis, fasciasis, trichomoniasis and cryptosporidiosis, including those with AIDS or HIV infections 1.
Nitazoxanide is used in many areas of the world, especially in Central and South America, as a broad-spectrum parasiticidal agent in adults and children 2.
Nitazoxanide is not official in any of the pharmacopoeia. It found mentioned in Martindale, The Complete Drug Reference 3. Very few analytical methods like RP-HPLC and spectrophotometric methods are reported in literature for the quantitative estimation of Nitazoxanide in bulk drug and pharmaceutical dosage forms 4-7.
Therefore, it was thought worthwhile to develop simple, precise, accurate RP-HPLC method for determination of Nitazoxanide in powder for suspension dosage form.
MATERIALS AND METHODS:
Drugs and Chemicals: HPLC grade acetonitrile (Merck, German) and tetra n- butyl ammonium hydrogen sulphate( A.R grade, Scharlau, Spain ) water for HPLC (PALL life sciences, India) were used for preparing the mobile phase. All other reagents used were HPLC grade.
Correspondence to Author:
Sharifa Sultana
Lecturer, Department of Pharmacy, Daffodil International University, 102 Shukrabad, Mirpur Road, Dhaka-1207, Bangladesh
E-mail: [email protected]
Keywords:
Nitazoxanide, RP-HPLC, Development, Validation, Powder for Suspension
QUICK RESPONSE CODE
IJPSR:
ICV- 5.07
Website:
Pure Nitazoxanide (Glenmark Pharmaceuticals Pvt. Ltd., India) used as working standard without further purification. A commercial Nitazoxanide suspension (Nitazox, Incepta Pharmaceuticals Ltd; Batch No. 11003; Mfg Date 07/2011, Exp Date 06/2013) was purchased from local market.
Instruments: A SHIMADZU SPD-20Av UV-Visible detector model, an ODS reverse phase column (250 x 4.6 mm x 5 μm length), SIL 20 AC HT auto sampler, CTO-10 AS vp column oven, LC-20 AT isocratic single pump with software LC solution of version 1.2 high pressure liquid chromatographic instrument was employed in the study.
Preparation of Mobile phase: A freshly prepared 54:46 v/v mixture of acetonitrile and 0.005 mol L-1 tetra n- butyl ammonium hydrogen sulphate ( By taking 1.7 g of tetra n- butyl ammonium hydrogen sulphate in 1000-mL of water) was used as the mobile phase. Mixed them and filtered through a filter having a nominal pore size not greater than 0.45 µm.
Preparation of Standard Stock Solution: About 100 mg of Nitazoxanide working standard was dissolved in mobile phase and diluted up to 100 mL. Filter and collect filtrate.
Preparation of Analytical Standard Solution: Dilute 5 mL of this solution to 50 mL with mobile phase to make the concentration 100 μg/mL. Filter through a filter having a nominal pore size not greater than 0.45 µm.
Preparation of sample solution: Take about 5 g of reconstitute sample in a 100-mL volumetric flask and add 60 mL of mobile phase. Mix for 15 minutes in an ultrasonic bath. Cool the sample to room temperature. Finally add mobile phase q.s. to 100 mL. Filter and collect the filtrate. Dilute 5 mL of this solution to 50 mL with mobile phase. Filter through a filter having a nominal pore size not greater than 0.45 µm. The stock solution was further diluted with mobile phase to get required concentration in linearity range. All solutions were stored at room temperature; these solutions were shown to be stable during the period of study.
Validation of the Developed method: The developed method for the determination of Nitazoxanide was validated as per ICH guidelines (ICH 2005).
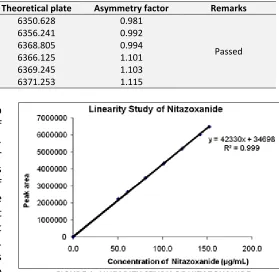
System Suitability Test: Before starting validation parameters, System Suitability must be established by injecting 20 µL each for six replicate injections of system suitability solution prepared as analytical standard solution. Using six peak areas, calculate the Relative Standard Deviation (RSD %), mean tailing factor, theoretical plate and asymmetry factors (Table 1).
Linearity and Range: Appropriate dilutions of standard stock solution (50‐150μg/ml) were assayed as per the developed method for Nitazoxanide. To establish linearity of the proposed method, seven separate series of solutions of Nitazoxanide were prepared from the stock solutions and analyzed (Table 2).
Precision: Precision was done by (i) repeatability or intra-assay precision and (ii) intermediate precision.
i) Repeatability (intra-assay precision):
Repeatability was determine from six test samples by Injecting 20 µL of each sample. Duplicate injection was made for each concentration level (Table 3).
ii) Intermediate precision: A second analyst performed the same experiment as repeatability experiment. For determination of method precision, analyst 1 repeatability (n=6) was combined with analyst 2 precision (n=6) and expressed as method precision (n=12) (Table 4).
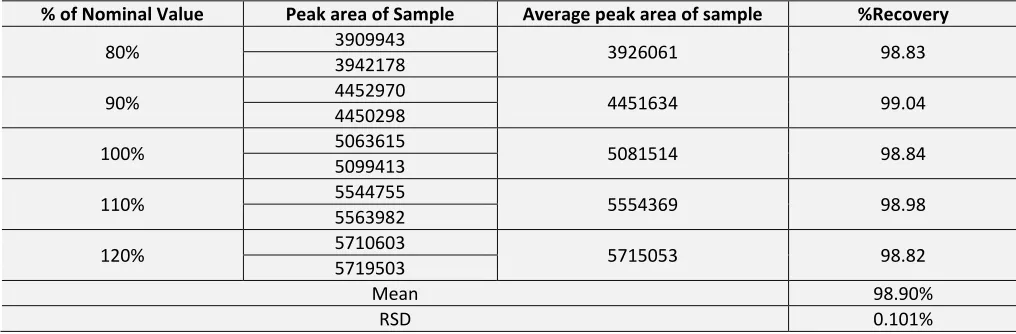
Accuracy: To check the accuracy of developed method and to study the interference of formulation additives analytical recovery experiments were carried out by standard addition 80%, 90%, 100%, 110% and 120% of the label claim. Accuracy was conducted by adding known amounts of Nitazoxanide to the sample matrix and five different concentrations of test sample were prepared. Duplicate injections were made for each concentration level (Table 5).
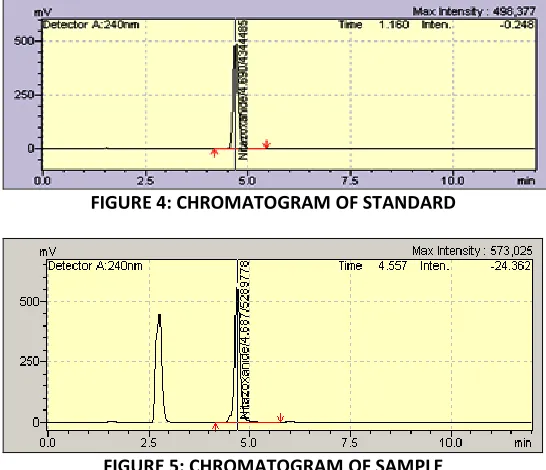
Specificity: Specificity will be determined by injecting separately blank, placebo, standard and sample solution of Nitazoxanide in duplicate (Fig. 2, 3, 4, 5).
RESULTS AND DISCUSSION: The present study
demonstrates a sensitive, precise and accurate HPLC method for the analysis of Nitazoxanide in powder for suspension dosage form.
System Suitability: Chromatograms were automatically integrated and visually inspected for an acceptable integration. The relative standard deviation of the peak areas (RSD 0.196%), the mean tailing factor (1.315), theoretical plates and asymmetry factors for six system suitability injections were calculated. The system suitability parameters were within the limits.
TABLE 1: RESULT OF SYSTEM SUITABILITY TEST
Replicate 1 Peak area Tailing Factor Theoretical plate Asymmetry factor Remarks
4328869 1.315 6350.628 0.981
Passed
2 4347516 1.316 6356.241 0.992
3 4350277 1.316 6368.805 0.994
4 4344485 1.316 6366.125 1.101
5 4353161 1.312 6369.245 1.103
6 4344548 1.314 6371.253 1.115
Linearity and Range: A good linear relationship (r=0.999) was observed between the concentration of Nitazoxanide and the respective ratio of peak areas. The regression curve was constructed by linear regression fitting and its mathematical expression was y=42330x+34698 (where y is the ratio of peak areas of the drug to that of reference standard and x is the concentration of Nitazoxanide) (Fig. 1). The lower limit of quantitation (LLOQ) was defined as the lowest concentration within the linear range (50.75µg/mL). The upper limit of quantitation (ULOQ) was defined as the highest concentration within the linear range
[image:3.612.296.575.174.446.2](152.25µg/mL) (Table 2). FIGURE 1: LINEARITY STUDY OF NITAZOXANIDE
TABLE 2: RESULT OF LINEARITY AND RANGE
% of Nominal value Conc. of Std (µg/mL) Peak areas Statistical Analyses Pass/ Remark
50% 50.75 2222181
Regression correlation coefficient, (R2)= 0.999
y-intercept = 34698 Slope of regression line = 42330
Passed
60% 60.90 2630322
80% 81.20 3476512
100% 101.50 4325304
120% 121.80 5183614
140% 142.10 6036729
150% 152.25 6478552
Lower limit of quantitation (LLOQ) 50.75 µg/mL
Upper limit of quantitation (ULOQ) 152.25 µg/mL
PRECISION: The repeatability and intermediate precision study of the developed method demonstrate RSD 0.528% for analyst-1 and RSD 0.497% for analyst-2 where RSD value for 12 samples was 0.811% which was not more than 2.0 % that indicating the developed
[image:3.612.37.580.484.630.2]TABLE 3: RESULT OF REPEATABILITY
Sample Peak area of Sample Average peak areas of Sample Assay, mg/5mL %RSD
1 5190584 5211245 111.68
0.528 5231905
2 5055425 5053679 111.91
5051932
3 5251532 5293769 110.76
5336006
4 5309778 5249334 110.71
5188890
5 5093833 5076747 110.58
5059660
6 5227066 5263169 110.65
5299272
[image:4.612.48.571.48.486.2]Average of Assay 111.05
TABLE 4: RESULT OF INTERMEDIATED PRECISION
Analyst-1 Analyst-2
Sample Peak area of Sample
Average peak areas of Sample
Assay, mg/ 5mL
Peak area of Sample
Average peak areas of Sample
Assay, mg/ 5mL
1 5190584 5211245 111.68 5287463 5240301 110.03
5231905 5193138
2 5055425 5053679 111.91 5223708 5236540 110.48
5051932 5249372
3 5251532
5293769 110.76 5096563 5088698 109.11
5336006 5080833
4 5309778 5249334 110.71 5215001 5208637 109.89
5188890 5202273
5 5093833 5076747 110.58 5210861 5214528 109.14
5059660 5218194
6 5227066 5263169 110.65 5097818 5103739 109.43
5299272 5109659
RSD for analyst-1 0.528 % RSD for analyst-2 0.497 %
RSD for 12 sample 0.811 %
Accuracy: The validity and reliability of proposed method was assessed by recovery studies by standard addition method. The mean of % recovery (98.90%) and % RSD (0.1%) were found to be within limit (NMT
[image:4.612.51.559.574.741.2]2%) for the developed method. This result revealed that any small change in the drug concentration in the solution could be accurately determined by the developed analytical method.
TABLE 5: RESULT OF ACCURACY
% of Nominal Value Peak area of Sample Average peak area of sample %Recovery
80% 3909943 3926061 98.83
3942178
90% 4452970 4451634 99.04
4450298
100% 5063615 5081514 98.84
5099413
110% 5544755 5554369 98.98
5563982
120% 5710603 5715053 98.82
5719503
Mean 98.90%
Robustness: Robustness of the method was found out by testing the effect of deliberate changes in the chromatographic conditions and the corresponding peak areas. The factors selected for this purpose were temperature and flow rate. The method was found to be robust enough that the RSD of peak area, tailing factor were not apparently affected by variation in the chromatographic conditions.
TABLE 6: RESULT OF ROBUSTNESS Temp.
(◦C)
Flow rate (mL/min)
% RSD of Peak Area
Tailing Factor
Theoretical plate
30 1 1.001 1.156 6350.628
30 1.2 1.131 1.161 6368.805
40 1 1.210 1.212 6299.372
40 1.2 1.225 1.219 6301.520
[image:5.612.313.586.44.279.2]Specificity: Specificity of the analyte peak was determined from that of the vehicle and blank injection. The chromatograms of Blank injection, Placebo injection, Standard injection and Test sample injection used to justify the specificity of target analytes. Necessary chromatograms are presented below:
FIGURE 2: CHROMATOGRAM OF BLANK
FIGURE 3: CHROMATOGRAM OF PLACEBO
FIGURE 4: CHROMATOGRAM OF STANDARD
FIGURE 5: CHROMATOGRAM OF SAMPLE
CONCLUSIONS: The isocratic RP-HPLC method
developed for quantitative determination of Nitazoxanide is precise, accurate, and selective. The method was completely validated and satisfactory results were obtained for all the method validation data tested. Percent of recovery shows that the method is free from interference of the excipients used in the formulation. Therefore, the proposed method can be used for routine analysis of Nitazoxanide in powder for suspension dosage form.
ACKNOWLEDGEMENTS: The authors are thankful to Department of Pharmacy, University of Dhaka for providing the necessary facilities for the study.
REFERENCES:
1. Sonal Bhale, R.D. Patankar: RPHPLC Development and validation of nitazoxanide in tablet dosage form.Int J Pharm Pharm Sci 2011; Vol. 3, Issue 3: 71-73.
2. Vijay Y. Jadhav, Santosh V. Gandhi, Nilesh D. Dhavale, Shweta S. Sabnis: RP-HPLC determination of nitazoxanide in bulk and different tablet formulations, Eurasian J. Anal. Chem. 2008, Vol. 3, No. 3: 318-323. 3. Sweetman S.C, Martindale: The Complete Drug Reference. The
Pharmaceutical Press. 2002: 598.
4. Prabhakar G, Kapse GK, Appala R.S.: Spectrophotometric Determination of Nitazoxanide in Pharmaceutical Dosage Form, The Indian Pharmacist 2006: 83‐84.
5. Scott, P.W, Liquid Chromatography for the Analyst, Marcel Dekker. 1994: 1‐4.
6. United States Pharmacopoeia, Vol., Supplement 1, Rockville, MD: The United States Pharmacopoeial Convention, Inc. 2000; 24: 1215. 7. British Pharmacopoeia, London: The British Pharmacopoeia
Commission. 2002: 1247.
How to cite this article:
[image:5.612.34.592.387.708.2]