Enhancement of voltage profile and loss minimization in distribution
system using genetic algorithm
Keerthi Malloju & Yogi Limmala
Assistant Professor Department of Electrical & Electronics Engineering, GIET Engineering College,East godavari (Dt); A.P, India.
Assistant Professor Department of Electrical & Electronics Engineering, GIET Engineering College,East godavari (Dt); A.P, India
Abstract: Distribution system holds a very significant position in the power system since it is the main point of the link between the bulk power and the consumers .A planned and effective distribution is the key to cope with the ever increasing demand for domestic industrial and commercial load. The load flow study of the radial distribution network is of prime importance for effective planning of load transfers. Power companies are interested in finding the most effective configuration for minimization of real power losses and load balancing among the distribution feeders to save energy and enhance the overall performance of the distribution system. Distribution generation integration in distribution system is one of the options which give benefits like loss minimization, peak saving, over load relieving and improved reliability. Optimization and size of the DGs considering system loss minimization and voltage profile improvement as objective functions. The optimization technique based on genetic algorithm for optimum location and size backward sweep and forward sweep load flow method used for base load flow and this work is tested on standard IEEE 33 bus system. The simulation results are tested using matlab Simulink soft ware.
Index Terms— Distributed Generation, Optimization Algorithms Genetic Algorithm, DG Modeling I.
I.INTRODUCTION
Demand for clean and sustainable energy sources has dra- matically increased during the past few years with growing population and industrial development. For a long time, fossil fuels have been used as the major source of generating electrical energy. Environmental consequences of these resources have made it necessary to benefit from clean energy sources such as wind and solar. Therefore, distributed generation (DG) systems based on renewable energy sources have attracted the researchers’ attention. The DG systems include photovoltaic (PV) cells, fuel cells and wind power .Distributed generation (or DG) generally refers to small-scale (typically 1 kW – 50 MW) electric power generators that produce electricity at a site close to customers or that are tied to an electric distribution system. Distributed generators include, but are not limited to synchronous
generators, induction generators, reciprocating engines, micro turbines (combustion turbines that run on high-energy fossil fuels such as oil, propane, natural gas, gasoline or diesel), combustion gas turbines, fuel cells, solar photovoltaic’s, and wind turbines.
There are many reasons a customer may choose to install a distributed generator. DG can be used to generate a customer’s entire electricity supply; for peak shaving (generating a portion of a customer’s electricity onsite to reduce the amount of electricity purchased during peak price periods); for standby or emergency generation (as a backup to Wires Owner's power supply); as a green power source (using renewable technology); or for increased reliability. In some remote locations, DG can be less costly as it eliminates the need for expensive construction of distribution and/or transmission lines. a) Benefits of Distributed Generating Systems Distributed Generation:
1) Has a lower capital cost because of the small size of the DG (although the investment cost per kVA of a DG can be much higher than that of a large power plant).
2) May reduce the need for large infrastructure construction or upgrades because the DG can be constructed at the load location.
3)If the DG provides power for local use, it may reduce pressure on distribution and transmission lines.
4) With some technologies, produces zero or near-zero pollutant emissions over its useful life (not taking into consideration pollutant emissions over the entire product lifecycle i.e. pollution produced during the manufacturing or after decommissioning of the DG system).
5) With some technologies such as solar or wind, it is a form of renewable energy. Can increase power reliability as back-up or stand-by power to customers.
6) Offers customers a choice in meeting their energy needs.
approaches are also available. In all these papers DGs are modeled as constant power injection source and multiple DGs are not considered. The paper has discussed the size and location of the DG for ‘different load models’, but offered no details about the multiple DG placement and size. Further, the DG is modeled as unity Power factor source with fixed rating at 0.63p.u for all studies. In the present work, the renewable DGs Wind and Solar are modeled as constant p.f model and variable reactive power model in current injection based load flow. Further, the combination of the different DGs is also studied. The GA technique is used for optimization. The main objective is to optimize DG location and size, while minimizing system real, reactive losses and to improve voltage profile.
II. PROBLEM FORMULATION
The main focus is to find the optimal place and size of the DG by minimizing Objective function (OF) [9].
OF
0.4ILP 0.2ILQ 0.25IC 0.15IVD
Here, the first priority is given to renewable DGs because of the low maintenance and cost. After including one or more DGs the aim is to minimize OF.
(2)
(3)
(4)
(5)
With Equality constraints (6)
Equality constraints (7)
III. MODELLING OF DGS IN LOAD FLOW STUDIES
In system with DGs, the generation of Photo voltaic systems, Fuel cells, Microturbines and some Wind turbine units are injected into the power grid via power electronic interfaces. In such cases, the model of a DG unit in load flows depends on the control method which is used in the converter control circuit. The DGs which have control over the voltage by regulating excitation voltage (Synchronous generator DGs) or the control circuit of the converter used to control ‘P’ and ‘V’ independently, then the DG unit may be model as PV type. Other DGs like Induction generator based units or converter used to control P and Q independently, then the DG shall be modeled as PQ type. Using these models for DGs, Current injection based load flow method is employed for Distribution system studies.
A) Current injection based load flow (CILF)
The traditional load flow methods like Gauss-Siedel, Newton-Raphson and Fast Decoupled techniques are inefficient to solve Distribution networks due to the radial structure and wide range of resistance with low X/R ratios. Several methodologies have been proposed to solve the power flow problem in Distribution Systems like Vector based Distribution load flow, Primitive Impedance Distribution load flow and Forward & Backward Sweep Distribution load flow. But all the methods have limitations like, not applicable for meshed distribution systems and implementation become complex when control devices are present in the system. The CILF [18] can used for both radial and mesh systems and easy to implementation of control devices.
B) DG modeled as PQ node
A DG unit can be modeled as three different ways in PQ node mode as illustrated below:
i) DG as a ‘negative PQ load’ model of PQ mode
(8)
(9)
ii) DG as a ‘constant power factor’ model of PQ mode
The DG is commonly modeled as constant power factor model . Controllable DGs such as synchronous generator based DGs and power electronic based units are preferably modeled as constant power factor model. For example, the output power can be adjusted by controlling the exciting current and trigger angles for synchronous generator based DGs and power electronic based DGs, respectively [19]. For this model, the specified values are the real power and power factor of the DG. The reactive power of the DG can be calculated by (10) and then the equivalent current injection can be obtained by (11).
(10)
(11)
iii) DG as ‘Variable Reactive Power’ model of PQ mode
DGs employing Induction Generators as the power conversion devices will act mostly like variable Reactive Power generators. By using the Induction Generator based Wind Turbine as an example, the real power output can be calculated by Wind Turbine power curve. Then, its reactive power output can be formulated as a function comprising the real power output, bus voltage, generator impedance and so on. However, the reactive power calculation using this approach is cumbersome and difficult to calculate efficiently. From a steady-state view point, reactive power consumed by a Wind Turbine can be represented as a function of its Real Power [7], that is
(12)
Where Q’iDG is the Reactive Power function consumed by the Wind Turbine. The Q0, Q1 and Q2 are usually obtained experimentally. The reactive power consumed by the load cannot be fully provided by the distribution system, and therefore capacitor banks are installed for power factor correction where induction generator based DGs are employed.
C) Dg modeled as PV type
The DG as a PV node is commonly Constant voltage model. The specified values of this DG model are the real power output and bus voltage magnitude. For maintain constant voltage the, change in voltage ΔVi should maintain zero by injecting required reactive power.
The energy sources of DGs can be categorized into stable and unstable energy sources, Fuel cell and Micro-gas turbine are some of the stable energy sources, Wind and Solar are most commonly used unstable energy sources. Different energy sources show special output characteristics when combining with different energy converters . For example, the Induction Generator will act like a constant real power and variable reactive power generator, when it is used to convert wind energy to power grids. So it is modeled as a variable reactive power model in load flow analysis. However, if the static electronic converter is used to convert Solar to power grids, it will mostly act like a generator with a constant power factor in normal operating condition. Therefore it is modeled as constant power factor model. In this study, the maximum capacity of DG is taken as 0.63 p.u and the average maximum power generated by the Solar is 1.191p.u and Wind turbine is 0.471p.u.are considered.
IV. GA IMPLEMENTATION FOR OPTIMAL PLACEMENT AND SIZE OF DG
Figure 1: Chromosome formation of DGS
Figure 2: Flow chart of optimal place and size of DGs
(V) Backward Sweep and Forward Sweep Load Flow:
Backward and Forward (BW/FW) Sweep algorithm for load flow analysis of radial distribution network. In
backward sweep, Kirchhoff’s Current Law and
Kirchhoff’s Voltage Law are used to compute the bus voltage from farthest node. In forward sweep, downstream bus voltage is updated starting from source node. The procedure stops after the mismatch of the calculated and the specified voltages at the substation is less than a convergence tolerance. Line losses are calculated afterwards using updated bus voltage. Using this method, load flow solution for a distribution network can be obtained without solving any set of simultaneous equations. The proposed algorithm is tested with 15 bus and IEEE 33 bus radial distribution system. Test results are obtained by programming using MATLAB.
B6
B1 B2
B4
B5
B3Z34
Z35
Z12 Z23
Z46 6
4
5
Fig .3. Six Bus Radial Distribution System
Assuming a flat voltage profile as initial voltages,During Backward sweep
I36= I6
I45=I5
I34=I45-I4
I23=I34+I36-I3
I12=I23-I2
By above equations we can write in general as follows
Where
J (k) =Branch current in line K
I(q) = Current injection at bus-q.
During forward sweep the voltages are calculated from the above equation..
Features:
(1) It is simple to understand and implement.
(2)Iteration time is very less.
(A). Algorithm of BSFS method:
1. Read the system, line data and bus data.
(a)System data: number of buses, number of lines, reference bus or slack bus.
(b)Line data: from bus, to bus, line resistance, line reactance.
(d)Read intermix, epsilon, base kiva, base voltage & initial voltages at all buses.
2. Form itagf, itagto, adjq and adjl vectors.
3. Initialize
the bus voltages to 1+j0 p.u.4. Calculate
power injections and current injections I[i] at all the buses.5. Initialize
the iteration count k=16. Assign
I[i]old=I[i] for all the buses.7. During
backward sweep calculate branch currents by using current injections in the buses.8. During forward sweep calculate bus voltages from second bus to last bus.
9. Compare
the calculated magnitude of the rated voltage at reference node with specified source voltage. Stop if the voltage difference is less than specified criteria problem is converged.Calculate the line losses and display the converged voltage magnitudes.
VI.MATLAB SIMULATION AND RESULTS
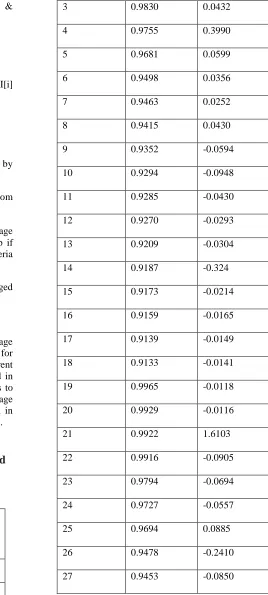
From Backward and Forward sweep obtained voltage magnitudes and their corresponding Phase Angles for IEEE33 bus system. In Backward sweep current injections at that bus calculated using given load and in forward sweep bus voltages are updated from 2nd bus to
last bus by using current injections. The Voltage magnitude and corresponding phase angles are listed in table .here to get the results MATLAB software is used.
TABLE 1
Backward forward sweep load flow obtained
voltages at different buses for IEEE33 bus
system
Bus. No Voltage
Magnitude (in p.u.)
Phase angles(radians)
1 1.0000 0.0001
2 0.9970 0.00039
3 0.9830 0.0432
4 0.9755 0.3990
5 0.9681 0.0599
6 0.9498 0.0356
7 0.9463 0.0252
8 0.9415 0.0430
9 0.9352 -0.0594
10 0.9294 -0.0948
11 0.9285 -0.0430
12 0.9270 -0.0293
13 0.9209 -0.0304
14 0.9187 -0.324
15 0.9173 -0.0214
16 0.9159 -0.0165
17 0.9139 -0.0149
18 0.9133 -0.0141
19 0.9965 -0.0118
20 0.9929 -0.0116
21 0.9922 1.6103
22 0.9916 -0.0905
23 0.9794 -0.0694
24 0.9727 -0.0557
25 0.9694 0.0885
26 0.9478 -0.2410
28 0.9339 0.0332
29 0.9257 0.0250
30 0.9221 0.0184
31 0.9180 0.0147
32 0.9171 0.0116
33 0.9168 0.0140
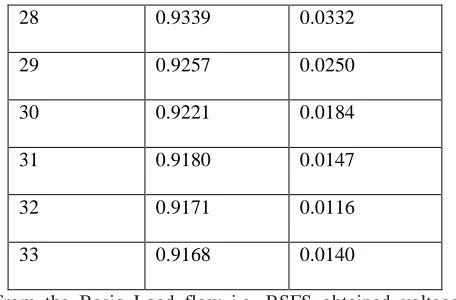
From the Basic Load flow i.e. BSFS obtained voltage magnitude and their phase angles are listed above and also bus voltage vs. bus no plotted in MATLAB and line losses are calculated. Here we performed load flow for IEEE 33 bus system and the losses are i.e,
Active power Losses=202kW and
Reactive power losses= 134.8 kVAR.
COMPARISION BETWEEN GA AND BWFS
TABLE .2
Bus. No
Voltage Magnitude(p.u)
(GA)
Voltage Magnitude(p.u)
(without DG)
Increase in Voltage(in percentage)
1 1.0000 10000 0
2 0.9985 0.996520 0.1982
3 0.9925 0.978318 1.4289
4 0.9910 0.9691112 2.2086
5 0.9898 0.95992 3.0187
6 0.9849 0.938587 4.7023
7 0.9842 0.932160 5.2857
8 0.95478 0.919959 3.6470
9 0.94758 0.902424 4.7654
10 0.91023 0.885269 2.7139
11 0.91875 0.882393 4.4634
12 0.910023 0.878132 3.5044
13 0.9910063 0.860284 13.1909
14 0.524531 0.853349 -62.6880
15 0.9754821 0.847251 1.35735
16 0.9754522 0.843075 13.8358
17 0.957842 0.835274 12.7962
18 0.924631 0.831933 10.0938
19 0.923452 0.831300 9.9790
20 0.934212 0.827013 11.4748
21 0.978432 0.826168 15.5620
22 0.984254 0.825660 16.1131
23 0.998754 0.972994 2.5792
24 0.985468 0.962730 2.3073
25 0.987524 0.937884 5.0267
26 0.999989 1.000000 -0.0011
27 0.99986 0.997378 0.2482
29 0.979944 0.978841 0.1125
30 0.977023 0.975487 0.1572
31 0.975022 0.971564 0.3539
32 0.97571 0.970702 0.5132
33 0.97568 0.970434 0.5376
MATLAB OUT PUT
LOCATION OF DG ACTIVE POWER OF DG REACTIVE POWER OF DG
13 1.8600 MW 0.6467 MVAR
LOSSES: WITHOUT DG WITH DG ACTIVE POWER LOSS
0.202 MW 0.1182MW
REACTIVE POWER LOSS
0.1348 MVAR 0.0878MVAR
VII. CONCLUSIONS
In this dissertation work, probabilistic uncertainty modeling is proposed for evaluation of active losses in the distribution network. Its use would be to enable DNOs (Distributed Network operators) to evaluate the effect of different DG technologies on the technical performance of the distribution network. The model considers probabilistic presentation of wind speed using a Weibull Probability Density Function. The contents of this dissertation can be summarized as follows:
(1)To penetrate DG’s into the Distributed Network for optimal location and sizing here proposed Genetic Algorithm(GA).
(2) Non controllable DG’s like wind power plants, wind power highly dependent on wind speeds, wind speeds highly uncertain, To model wind speed Weibull probability density function is used and for Load modeling Load Shape multiplier curve is used.
(3) Compared Genetic Algorithm(GA) results without DG and i.e. Bus voltages fluctuations and power losses.
The generation pattern of DG(Distributed Generation) units changes the flow of lines and this will cause change of active losses which DNO is responsible for compensating these losses this is useful for Distributed Network Operators. By using GA optimization Algorithm power losses reduced significantly compared with without DG.
REFERENCES
[1]Sulaiman, M.H., Mustafa, M.W., Azmi, A., Aliman, O Abdul Rahim, S.R..Optimal allocation and sizing of distributed generation in distribution system via firefly algorithm, 2012 IEEE International Power Engineering and Optimization Conference, PEOCO 2012 – Conference Proceedings, Vol.5, 2012, pp. 84-89.
[2 Rajendra Prasad Payasi, Asheesh K. Singh, Devender Singh, Review of distributed generation planning: objectives, constraints, and algorithms. International Journal of Engineering, Science and Technology .Vol. 3, 2011, pp. 133-153.
[3]Alireza soroudi,Mehdi Eshsan . A possibilistic-probabilistic tool for evaluating the impact of stochastic renewable and controllable power generation on energy losses in distribution networks, Journal of Renewable and Sustainable Energy Reviews.Vol.15,2011,pp.794–800. [4]Sookananta, B., Utaton, P., Khongsila, R.. Determination of the Optimal Location and Sizing of Distributed Generation using Ant Colony Search, The 2010 ECTI International Conference on Electrical Engineering/Electronics, Computer, Telecommunications and Information Technlogy,Vol. 12,2010,pp. 814-817.
[5]Lee, T.-L. Cheng, P.-T. Design of a new cooperative harmonic filtering strategy for distributed generation interface converters in an islanding network, IEEE Transactions on Industry Applications ,Vol.44, 2007 , pp. 612-623 .
[6]Kirubakaran, A., Jain, S., Nema, R.K. (2011). DSP-controlled power electronic interface for fuel-cell-based distributed generation, IEEE Transactions on Power Electronics,Vol.12,2011, pp. 3853-3864. [7]M. T. Arab yar Mohammadi and M.Faramarzi, (2000). PSO Algorithm for Sitting and Sizing of Distributed Generation to Improve Voltage Profile and Decreasing Power Losses, IEEE PICA Conference, Vol. 10,2000, pp. 81-86.
[8]M. R. AlRashidi and M. E. El-Hawary, (2006). A survey of Particle Swarm Optimization Application in Electric Power Systems, IEEE Transaction on Evolutionary Computation.Vol.2,2006,pp.913-918. [9]Hirotaka Yoshida, Kenichi Kawata,Yoshikaza Fukuyama, Sinichi Takayama,and Yosuke Nakanishi, (2000). A particle Swarm Optimization for Reactive Power and Voltage Control Considering Voltage Security Assessment, IEEE Transaction on Power System, Vol.2,2001,pp.497-502.
[11]Xin-She Yang, Bat algorithm: Literature review and applications, Int. J. Bio-Inspired Computation, , IEEE Transaction on Power System .Vol.5,2013, pp. 141–149.
[12]Soroudi,A.; Caire,R.; Hadjsaid,N. Ehsan,M.,Probabilistic dynamic multiobjective model for renewable a nd non-renewable distributed generation planning,Vol.5,2011,pp.1173-118.
KEERTHI MALLOJU received M.Tech in the stream of High voltage engineering from JNTUK and B.Tech degree from GODAVARI INSTITUTE OF ENGG AND TECHNOLOGY in the year 2010. Currently working as a Assistant Professor in GIET ENGINEERING COLLEGE since 3 years.