CMS: Physics overview
VadimAlexakhin1,∗on behalf of the CMS Collaboration
1Joint Institute for Nuclear Research, Dubna, Russia
Abstract.An overview of physics results from the CMS experiment at the LHC
is given. The present analysis is based on data obtained for colliding proton
beams at the c.m. energies of √s=8 and 13 TeV over the period of LHC
Run-1 and Run-2.
New unique data on interactions of Standard Model particles at record energies were obtained in the course of the first run of LHC operation. The Higgs boson was discovered, and investigation of its properties was initiated. Measurements were performed for Standard Model processes, including rare and one previ-ously unobserved. This allowed one to refine some parameters of the Standard Model and set limits on the parameters of some theoretical models beyond the Standard Model, for example, on the masses of new particles, the fundamental energy scales, the coupling constants, and the cross sections for the new parti-cles production.
1 Introduction
This report covers recent physics results from CMS [1] including precision measurements of the Higgs boson, first observed by the ATLAS and CMS collaborations in 2012 [2],[3] and top quark properties, b-physics, and Standard Model (SM) phenomena; searches for new particles. It will conclude with a summary and outlook.
In 2015, the Large Hadron Collider operated successfully for the first time at 13 TeV and with 25 ns bunch spacing. In 2106–2018, the LHC concentrated on providing the experiments with very high integrated luminosity. This was achieved by the LHC’s reaching a peak initial luminosity of 2×1034cm−2s−1and providing very high availability for physics.
The peak luminosity, corresponding to a number of simultaneous interactions per beam crossing (pileup) of about 40, exceeded the design goal for the LHC and CMS itself. In anticipation of a high peak and integrated luminosity in 2016 and beyond, CMS made various improvements and upgrades to the detector. These included the improved Level 1 Muon Trigger and Calorimeter Triggers. With these improvements, CMS was able to fully exploit the high integrated luminosity provided by the LHC.
In order to record the data efficiently with the high luminosities of 2016 and subsequent years, CMS implemented several innovative analysis techniques. Two of them are Particle Flow (PF) [4] and Pile UP per Proton Interaction (PUPPI) [5].
2 Recent Physics Results
CMS has continued its prolific production of physics results. During the XXIVth Interna-tional Baldin Seminar on High Energy Physics Problems 2018, 776 papers were submitted to peer reviewed journals. More than 25 new results were presented at the 2018 end-of-summer conferences. Here, we present a few highlights of recent results, many of which were shown during summer 2018.
2.1 Higgs Boson Properties
With more total luminosity and higher energy, larger samples of Higgs bosons are recon-structed, making more precise measurements and new studies possible.
Higgs decay toτ+τ−:The decay of the Higgs intoτ+τ−is reconstructed in four separate
decay modes,eµ,eτh,µτh, and τhτh and in three production channels, 0-jet, Vector Boson
Fusion (VBF), and “boosted" one [6]. Here τh refers to specific targeted hadronic decay
modes. The data set corresponds to the integrated luminosity of 35.9 fb−1. TheH → τ+τ−
signal is established with a significance of 4.9 standard deviations, to be compared to the expected significance of 4.7 standard deviations. The best fit of the product of the observed H → τ+τ− signal production cross section and branching fraction is 1.09−+00..2726 multiplied by the Standard Model expectation (Fig.1, right). The combination with the corresponding measurement performed with the data collected by the CMS experiment at center-of-mass energies of 7 and 8 TeV leads to the observed significance of 5.9 standard deviations, equal to the expected significance. This will constitute the first observation in a single experiment of coupling the Higgs to a fermion, a lepton, and the third generation family member. It also provides a validation of the Higgs Yukawa interaction.
(S/(S+B)) 10 log 3
− −2.5 −2 −1.5 −1 −0.5 0
Events 1 − 10 1 10 2 10 3 10 4 10 5 10 6 10 7 10
Observed τhτh h
τ
µ eτh
µ e H→ττ (µ=1.09) Bkg. unc. (13 TeV) -1 35.9 fb CMS (S/(S+B)) 10 log 1.5
− −1 −0.5 0 0.2 0.4 0.6 0.81 1.2 1.4 1.6 1.8
(Obs. - bkg.)/bkg. )/bkg. τ τ → (H Bkg. unc./bkg. (GeV) τ τ m 0 50 100 150 200 250 300
S/(S+B) weighted events / GeV
200 400 600 800 1000 1200 1400 1600 1800 Observed =1.09) µ ( τ τ → H τ τ → Z W+jets QCD multijet Others Bkg. unc. (13 TeV) -1 35.9 fb CMS h τ h τ 0-jet: h τ h τ VBF: µ , e h τ , e h τ µ , h τ h τ Boosted: (GeV) τ τ m
050 100 150 200 250 300 10 − 0 10 20 30
40 Obs. - bkg.
τ τ → H Bkg. unc. SM σ / σ = µ Best fit
0 1 2 3
0-jet -0.89 +0.89 =0.84 µ Boosted -0.40 +0.47 =1.17 µ VBF -0.35 +0.34 =1.11 µ Combined -0.26 +0.27 =1.09 µ CMS (13 TeV) -1 35.9 fb
Figure 1. Distribution of the decimal logarithm of the ratio between the expected signal and the sum
of the expected signal and expected background(left plot) [6]. Combined observed and predictedmττ
distributions (center plot) [6]. Best fit signal strength per category (rigth plot) [6], formH =125.09
GeV
ttH¯ production: CMS has seen evidence for thett¯-Higgs coupling for Higgs bosons produced in conjunction with a top quark-antiquark pair and decaying to pairs of W bosons, Z bosons, photons,τleptons, or bottom quark jets combined to maximize sensitivity [7].
Events 1 10 2 10 3 10 4 10 5 10 6 10 Observed Background Uncertainty =1.26) H t t µ H ( t t =1.00) H t t µ H ( t t CMS (13 TeV) -1
(8 TeV) + 35.9 fb
-1
(7 TeV) + 19.7 fb
-1 5.1 fb (S/B) 10 log 3.0
− −2.5 −2.0 −1.5 −1.0 −0.5 0.0
Obs. / Bkg. 1.0 1.5 2.0 2.5 3.0
1
− 0 1 2 3 4 5 6 7
H t t µ Combined 13 TeV 7+8 TeV ) b H(b t t ) -τ + τ H( t t ) γ γ H( t t H(ZZ*) t t H(WW*) t t (13 TeV) -1
(8 TeV) + 35.9 fb
-1
(7 TeV) + 19.7 fb
-1 5.1 fb CMS Observed syst) ⊕ (stat σ 1 ± (syst) σ 1 ± syst) ⊕ (stat σ 2 ±
Figure 2. Left plot shows the distribution of events as a function of the decimal logarithm ofS/B[7].
Right plot: Best fit value of thettH¯ signal strength modifierµttH¯ [7]
Higgs boson decay tobb¯: Recently CMS has made an observation of the Higgs boson decay to bottom quarks [8]. The measurement examines theV Hproduction process, where the Higgs boson is produced in association with aWorZboson and decays intobb¯. The data comprise proton-proton (pp) collisions recorded at √s=13 TeV corresponding to the total integrated luminosity of 41.3 fb−1. Higgs boson candidates have been reconstructed from the pair of jets in the event most likely to originate frombquarks.
m(jj) [GeV]
60 80 100 120 140 160
S/(S+B) weighted entries
0 500 1000 Data b b → VH,H b b → VZ,Z S+B uncertainty CMS (13 TeV) -1 77.2 fb µ Best fit
0 1 2 3 4 5 6 7 8 9
Combined ZH WH ttH VBF ggF
stat syst
0.14 ± 0.14 ± 1.04 0.16 ± 0.24 ± 0.88 0.24 ± 0.29 ± 1.24 0.37 ± 0.23 ± 0.85 1.17 ± 0.98 ± 2.53 1.30 ± 2.08 ± 2.80 CMS (13 TeV) -1 77.2 fb ≤ (8 TeV) +
-1
19.8 fb ≤ (7 TeV) +
-1 5.1 fb ≤ b b → H Observed syst) ⊕ (stat σ 1 ± (syst) σ 1 ±
Figure 3. Left plot: dijet invariant mass distribution for events weighted byS/(S+B) (left plot) [8].
Right plot: best-fit value of the H → bb¯ signal strength for the five individual production modes
considered [8]
A combination of all CMS measurements of theV H,H →bb¯process using the proton-proton collisions recorded at the center of mass energies of 7, 8, and 13 TeV, yields the observed (expected) significance of 4.8 (4.9) standard deviations at mH = 125.09 GeV,
strength isµ = 1.04±0.20. This constitutes the observation of theH → bb¯ decay by the CMS Collaboration. All results are summarized in Fig.3, right plot.
Higgs boson decay toµµ:The paper [10] presents a search for the Higgs boson decaying to two muons using the data recorded by the CMS experiment at the LHC in 2016 at a center-of-mass energy of 13 TeV, corresponding to the integrated luminosity of 35.9 fb−1.
No significant evidence for the decayH → µ+µ−has been observed. Limits are set on the cross section multiplied by the branching fraction of the Higgs boson decaying to two muons. The combination with the data recorded at center-of-mass energies of 7 and 8 TeV yields a 95% confidence level observed upper limit of 2.92 multiplied by the Standard Model value formH=125.09 GeV. The corresponding expected upper limit in the absence of a SM
decay in this channel is 2.16, which is the most sensitive to date. Assuming the Standard Model production cross sections for the Higgs boson, the observed limit corresponds to an upper limit of 6.4×10⁻⁴on the Higgs boson branching fraction to two muons.
Higgs combination:A set of combined measurements of Higgs boson production and de-cay rates has been presented by CMS in work [11], along with the consequential constraints placed on its couplings to Standard Model (SM) particles, and on the parameter spaces of several Beyond the Standard Model (BSM) scenarios. The combination is based on analyses targeting the gluon fusion and vector boson fusion production modes, and associated produc-tion with a vector boson or a pair of top quarks. The analyses included in the combinaproduc-tion target Higgs boson decay in the H → ZZ,WW, γγ, ττ,bb¯, andµµchannels, using 13 TeV proton-proton collision data collected in 2016 and corresponding to an integrated luminosity of 35.9 fb−1. The per-production and per-decay mode signal strength modifiers are presented in Fig.4. Additionally, searches for invisible Higgs boson decays are included to increase the sensitivity to potential interactions with BSM particles.
Parameter value 0 0.5 1 1.5 2 2.5 3 3.5 4
µ ttH µ
ZH µ
WH µ
VBF µ
ggH µ
CMS
(13 TeV)
-1
35.9 fb
Observed syst)
⊕
(stat
σ
1
±
syst)
⊕
(stat
σ
2
±
(syst)
σ
1
±
Parameter value 2
− −1 0 1 2 3
µ µ µ
bb µ
τ τ µ WW µ
ZZ µ
γ γ µ
CMS
(13 TeV)
-1
35.9 fb
Observed syst)
⊕
(stat
σ
1
±
syst)
⊕
(stat
σ
2
±
(syst)
σ
1
±
Figure 4. Summary plot of the fit to the per-production mode (left) [11] and per-decay mode (right)
signal strength modifiers [11]
the gluon fusion production rate of around∼50% is achieved compared to previous ATLAS and CMS measurements.
2.2 Top Quark Properties
The top quarkt is the heaviest Standard Model particle with the largest Yukawa coupling to the Higgs. As physics beyond the Standard Model is generally expected at higher scales, the top quark is the particle with the smallest mass gap to any other not yet discovered new particle and is often expected to be produced in association with new physics, such as super-symmetry. The precise knowledge of Standard Model top quark processes is essential, as it is an important background for search analyses but also because it provides through Standard Model precision fits direct constraints on new physics.
Top quark cross sections:The cross section fort−t¯production as a function of center of mass energy is shown in Fig.5, left plot. The result for 13 TeV from CMS [12] is 833±33 pb, in good agreement with theory. Summary of ATLAS and CMS measurements of the single top quark production cross-sections in various channels as a function of the center of mass energy is shown in Fig.5, right plot.
Single and double differential cross sections for key variables of top quark pair production are now also measured. In work [13] measurements are presented of absolute and normalized differential cross sections oftt¯production based on both particle-level objects in a fiducial phase space and parton-level top quarks in a full phase space using pp collisions at a centre-of-mass energy of 13 TeV recorded by the CMS detector. Most of themeasured differential cross sections are well modeled by theoretical predictions. However, significant disagree-ment between the data and next-to-leading-order Monte Carlo is observed for the transverse momentum of top quarks, leptons, b jets, andtt¯,ll¯andbb¯systems and for the invariant mass of thett¯,ll¯andbb¯systems. Similar levels of disagreement are observed for predictions with beyond NLO precision.
[TeV]
s
2 4 6 8 10 12 14
cross section [pb]t
Inclusive t 10 2 10 3 10 WG top LHC WG top LHC
ATLAS+CMS Preliminary Sept 2018
* Preliminary
)
-1
8.8 fb
≤
Tevatron combined 1.96 TeV (L )
-1
CMS dilepton,l+jets 5.02 TeV (L = 27.4 pb )
-1
7 TeV (L = 4.6 fb
µ
ATLAS e )
-1
7 TeV (L = 5 fb
µ
CMS e )
-1
8 TeV (L = 20.2 fb
µ
ATLAS e )
-1
8 TeV (L = 19.7 fb
µ
CMS e
)
-1
8 TeV (L = 5.3-20.3 fb
µ
LHC combined e )
-1
13 TeV (L = 3.2 fb
µ
ATLAS e )
-1
13 TeV (L = 2.2 fb
µ
CMS e )
-1
* 13 TeV (L = 35.6 fb
µ
CMS e
)
-1
* 13 TeV (L = 85 pb
µ µ
ATLAS ee/ )
-1
ATLAS l+jets* 13 TeV (L = 85 pb )
-1
CMS l+jets 13 TeV (L = 2.2 fb )
-1
CMS all-jets* 13 TeV (L = 2.53 fb
NNLO+NNLL (pp) ) p NNLO+NNLL (p
Czakon, Fiedler, Mitov, PRL 110 (2013) 252004 0.001
±
) = 0.118
Z
(M
s
α
= 172.5 GeV,
top NNPDF3.0, m [TeV] s 13 700 800 900 1 10 2 10
Inclusive cross-section [pb]
7 8 13 s [TeV]
ATLAS+CMS Preliminary LHCtopWG
Single top-quark production September 2018 t-channel tW s-channel ATLAS t-channel 086 (2017) 04 JHEP90(2014)112006, EPJC77(2017)531, PRD CMS t-channel
752 (2017) PLB 77212(2012)035, JHEP06(2014)090, JHEP
ATLAS tW 063 (2018) 01 JHEP(2012)142, JHEP01(2016)064, PLB 716 CMS tW arXiv:1805.07399 231802, (2014) 112 022003, PRL (2013) 110 PRL LHC combination, tW ATLAS-CONF-2016-023, CMS-PAS-TOP-15-019 ATLAS s-channel
228 (2016) PLB 756 ATLAS-CONF-2011-118 95% CL, CMS s-channel 7+8 TeV combined fit 95% CL
× JHEP09(2016)02795%CL
58 (2014) PLB 736 NNLO scale uncertainty 091503, (2011) 83 PRD NNLL + NLO 054028 (2010) 81 054018, PRD (2010) 82 PRD contribution removed t tW: t uncertainty s α ⊕ PDF ⊕ scale 74 (2015) 10, CPC191 (2010) NPPS205 NLO , top = m F µ = R µ
CT10nlo, MSTW2008nlo, NNPDF2.3nlo V e G 65 = F µ and V e G 60 = removal t veto for t
b T tW: p scale uncertainty uncertainty s α ⊕ PDF ⊕ scale V e G = 172.5 top m
stat total
Figure 5. Left plot: top quark pair production total cross section vs. center of mass energy [12]. Right plot: summary of ATLAS and CMS measurements of the single top quark production cross-sections in
various channels as a function of the center of mass energy [12]
Top quark rare decays:Fig.6, right plot, shows recently published results on rare flavor-changing neutral current decays of top quark [15]. While measurements at the LHC will not reach the level predicted by the SM, for some decays we will soon approach the predictions of various models of new physics and will be able to confirm them or rule them out.
1.4 1.45 1.5 1.55 1.6 1.65 1.7 1.75 1.8
t -ch.,
t σ / -ch., t
t σ = -ch.
t R
NNPDF3.0
NNPDF3.1
CT14
ABMP16
MMHT2014
HERAPDF2.0 Preliminary
CMS -1 (13 TeV)
35.9 fb
CMS
0.04 (syst) ± 0.02 (stat) ± 1.65
Branching ratio
16
−
10 10−13 10−10 10−7 10−4 10−1
Zu
→
t Zc
→
t gu
→
t gc
→
t u
γ →
t c
γ →
t Hu
→
t Hc
→
t
SM 2HDM(FV) 2HDM(FC) MSSM RPV RS
[9] [7] [8] [7] [6] [5] [6] [5] [4] [4] [3] [1] [2] [1] ATLAS CMS 95%CL upper limits
[1] ATLAS-CONF-2018-049 [2] JHEP 02 (2017) 079 [3] JHEP 06 (2018) 102 [4] JHEP 04 (2016) 035 [5] EPJC 76 (2016) 55 [6] JHEP 02 (2017) 028 [7] JHEP 07 (2018) 176 [8] CMS-PAS-TOP-17-017 [9] JHEP 07 (2017) 003
from arXiv:1311.2028 Theory predictions
ATLAS+CMS Preliminary
LHCtopWG September 2018
all other processes are zero Each limit assumes that
Figure 6.Left plot: Comparison of the measured Rt-ch. (dotted line) with the prediction from different
PDF sets [14]. Right plot: limits on rare decays of the top quark [15]
Top quark gallery: The first evidence of events consistent with the production of a single top quark in association with a photon was reported in work [16]. The measured product of the cross section and branching fraction is σ(pp → tγj)B(t → γνb) = 115±
17(stat)±30(syst) fb, which is consistent with the Standard Model prediction.
The first observation of top quark production in proton-nucleus collisions is reported us-ing proton-lead data collected by the CMS experiment [17] The measured cross section is
σtt¯=45±8 nb, consistent with the predictions from perturbative quantum chromodynamics. standard deviations.
2.3 B physics
The angular distribution of the flavor-changing neutral current decay B+ → K+µ+µ− was studied in proton-proton collisions at a center-of-mass energy of 8 TeV [18]. The analysis is based on the data corresponding to an integrated luminosity of 20.5 fb−1. The forward-backward asymmetry AF B of the dimuon system and the contribution FH from the
pseu-doscalar, scalar, and tensor amplitudes to the decay width have been measured as a function of the dimuon mass squared (q2). The measurements are consistent with the Standard Model expectations.
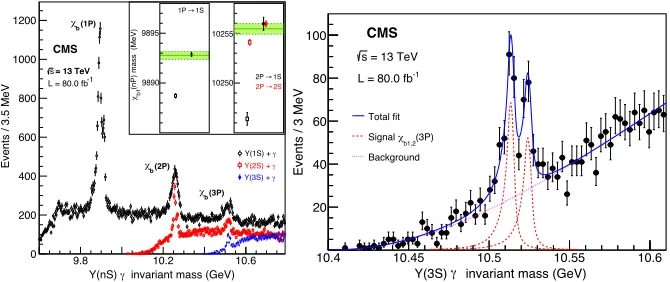
Data samples ofppcollisions at √s=13 TeV, collected by CMS in the years 2015–2017, corresponding to an integrated luminosity of 80.0 fb−1, were used to measure the invariant mass distribution of theχb(3P)→Υ(3S)γcandidates (see Fig.7, left plot), with theΥ(3S)
9.8 10.2 10.6 Y(nS) γ invariant mass (GeV) 0
200 400 600 800 1000 1200
Events / 3.5 MeV
= 13 TeV s = 13 TeV
-1
L = 80.0 fb
CMS
(2P) b χ
(3P) b χ (1P)
b χ
Y(1S) + γ Y(2S) + γ
Y(3S) + γ 9890
9895
10250 10255
→
1P 1S
→
2P 1S
→
2P 2S
χ
(nP) mass (MeV)b1
10.4 10.45 10.5 10.55 10.6
invariant mass (GeV) γ
Y(3S) 20
40 60 80 100
Events / 3 MeV
Total fit (3P) b1,2
χ
Signal Background = 13 TeV s
-1
L = 80.0 fb CMS
Figure 7.Left plot: the invariant mass distributions of theχbJ →Υ(nS)γcandidates (n=1,2,3). The
inset shows theχb1(1P) andχb1(2P) masses. The world-average values are shown by the horizontal
bands, with dashed lines representing their total uncertainties [19]. Right plot: the invariant mass
distribution of theχb(3P)→Υ(3S)γcandidates [19]
2.4 Searches for New Particles
Black Holes:A search in energetic, high-multiplicity final states for evidence of physics beyond the Standard Model, such as black holes, string balls, and electroweak sphalerons, is presented in work [20]. In the channel with high-multiplicity the final state semiclassical black holes with minimum masses as high as 10.1 TeV and string balls with masses as high as 9.5 TeV are excluded by this search.
Extra gauge bosons:A search for narrow resonances in dielectron and dimuon invariant mass spectra has been performed using the data recorded in 2016 from proton-proton colli-sions at √s=13 TeV [21]. Observations are in agreement with Standard Model expectations (see Fig.8). The upper limits at 95% confidence level on the product of a narrow-resonance production cross section and branching fraction to dileptons have been calculated in a model-independent manner to enable interpretation in the framework of the models predicting a narrow dielectron or dimuon resonance.
Limits are set on the masses of various hypothetical particles. For the ZSSM0 particle, which arises in the sequential Standard Model, and for the superstring-inspiredZψ0 particle, 95% confidence level lower mass limits for the combined channels are found to be 4.5 and 3.9 TeV, respectively. The corresponding limits for Kaluza–Klein gravitons arising in the Randall–Sundrum model of extra dimensions with coupling parametersk/MPlof 0.01, 0.05, and 0.10 are 2.1, 3.65, and 4.25 TeV, respectively.
Search for low-mass Resonances
80100 200 300 1000 2000
Events / GeV
5
−
10 4
−
10 3
−
10 2
−
10 1
−
10 1 10 2 10
3 10
4 10
5 10
6
10 Data
− µ + µ →
*/Z
γ
τ τ
, tW, WW, WZ, ZZ, t
t Jets
(M = 3 TeV)
ψ
Z'
(13 TeV) -1 36.3 fb
CMS
) [GeV]
−
µ
+
µ m(
80100 200 300 1000 2000
Bkg) / Bkg
−
(Data
1
−
0.5
− 0
0.5 1
M [GeV]
1000 2000 3000 4000 5000
] Z
B
⋅σ
] Z' / [
B
⋅σ
[
8
−
10 7
−
10 6
−
10 5
−
10 4
−
10
CMS Obs. 95% CL limit
Exp. 95% CL limit, median
Exp. (68%)
Exp. (95%)
SSM Z'
ψ
Z' ) -µ + µ (13 TeV, -1 (13 TeV, ee) + 36.3 fb -1
35.9 fb
Figure 8. Left plot: the invariant mass spectra of dimuon events. The histograms represent the expectations from the SM processes. Example signal shapes for a narrow resonance with a mass of
3 TeV are shown by the stacked open histograms [21]. Right plot: the upper limits at 95% CL on the
product of production cross section and branching fraction for a spin-1 resonance with a width equal to 0.6% of the resonance mass, relative to the product of production cross section and branching fraction of
aZ0boson, for combination of dielectron and dimuon channels. Theoretical predictions for the spin-1
Z0SSMandZψ0resonances are shown for comparison [21]
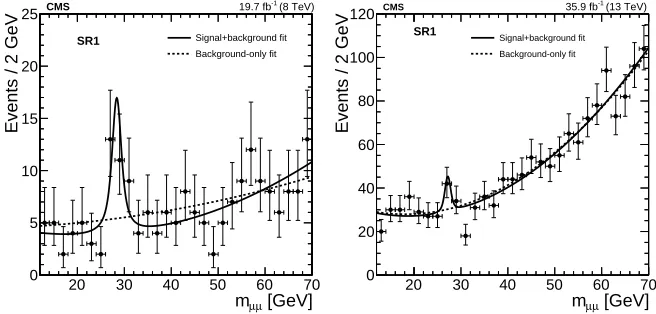
corresponding to local significances of 4.2 and 2.9 standard deviations for the first and second event categories, respectively (see Fig.9). A similar analysis conducted with the 13 TeV data results in a mild excess over the background in the first event category corresponding to a local significance of 2.0 standard deviations, while the second category results in a 1.4 standard deviation deficit. In the lack of a realistic signal model, the 13 TeV results are not sufficient to make a definitive statement about the origin of the 8 TeV excess. Therefore, more data and additional theoretical input are both required to fully understand the results presented in this work.
[GeV] µ µ m
20 30 40 50 60 70
Events / 2 GeV
0 5 10 15 20 25
Signal+background fit Background-only fit SR1
CMS 19.7 fb-1 (8 TeV)
[GeV] µ µ m
20 30 40 50 60 70
Events / 2 GeV
0 20 40 60 80 100 120
Signal+background fit
Background-only fit SR1
CMS 35.9 fb-1 (13 TeV)
Figure 9.The 12<mµµ<70 GeV range for SR1 in the 8 TeV (left) and 13 TeV(right) analysis [22]
forces, and the provision of a candidate for dark matter. Many physicists expected SUSY to be seen soon after LHC startup, with as little as 100 pb−1of luminosity, and to be the first major LHC discovery -– before even the Higgs boson.
Now with more than 90 fb−1of integrated luminosity at 13 TeV, SUSY has not yet been observed. The reasons for this could be: the lightest SUSY particles may be heavier than we thought; the pattern of decays may be more devious/obscure than we thought (coverage for R-Parity violating SUSY and long-lived particles are not as complete as for MSSM or PMSSM searches); maybe SUSY does not cure all the above problems and there are several new physics scenarios, including SUSY, forming a complicated landscape in which we are currently lost; or maybe SUSY is just another promising idea that nature does not choose to follow.
CMS continues to pursue a broad program of SUSY searches. Searches investigate dif-ferent final states and use several complementary analysis techniques [23].
Long-lived particles: Many BSM models predict long-lived particles. These result in distinctive properties such as displaced vertices, displaced conversions, displaced photons or jets, displaced leptons or dileptons, heavy stable charged particles (HSCP) with very high ion-ization losses, or stopped HSCP. Some of these can be observed by special searches, usually with special triggers. A recent example is a search by CMS for stopped long-lived particles. The signature is a high energy jet in the calorimeter that is out of time with collisions. This search excluded gluinos with lifetimes from 10µs to 1000 s for gluino masses<1379 GeV; and top squarks in this lifetime range with stop mass<740 GeV[24]. This is an exciting new area of inquiry that has not been thoroughly explored at the LHC.
3 Conclusions
The outstanding performance of the Large Hadron Collider and the CMS detector have made it possible to collect a 13 TeV data set corresponding to an integrated luminosity of 90 fb−1in 2016–2017. The most recent result highlights derived by using this data have been presented here. So far, only of the order of 5 percent of the total expected luminosity during the lifetime of the LHC has been recorded. The data that is yet to come will allow for many more precision measurements and direct or indirect searches for new physics.
The author wishes to thank the many members of the CMS Collaboration and their tech-nical and administrative staffs whose efforts are summarized in this report. We congratulate our colleagues in the CERN accelerator departments for the excellent performance of the LHC.
References
[1] CMS Collaboration, JINST3, S08004 (2008)
[2] G. Aad et al. [ATLAS Collaboration], Phys. Lett. B716, 1 (2012) [3] S. Chatrchyan et al. [CMS Collaboration], Phys. Lett. B716, 30 (2012)
[4] CMS Collaboration,Particle-flow reconstruction and global event description with the CMS detector, arXiv:1706.04965, CMS-PRF-14-001, CERN-EP-2017-110
[10] CMS Collaboration, Search for the Higgs boson decaying to two muons in proton-proton collisions at √s=13TeV, CMS-HIG-17-019, CERN-EP-2018-165
[11] CMS Collaboration, Combined measurements of Higgs boson couplings in proton-proton collisions at √s=13TeV, CMS-HIG-17-031, CERN-EP-2018-263
[12] LHC Top Physics Working Group, http://twiki.cern.ch/twiki/bin/view/LHCPhysics/ -LHCTopWGSummaryPlots
[13] CMS Collaboration, Measurements of differential cross sections for tt production in¯ proton-proton collisions at √s=13 TeV using events containing two leptons, CMS-PAS-TOP-17-014
[14] CMS Collaboration, Measurement of the single top quark and antiquark production cross sections in the t channel and their ratio pp collisions at √s=13TeV, CMS-PAS-TOP-17-011
[15] CMS Collaboration, Summary of FCNC upper limits at the 95% CL from CMS searches at 8 TeV, http://twiki.cern.ch/twiki/bin/view/
CMSPublic-/PhysicsResultsTOPSummaryFigures
[16] CMS Collaboration,Evidence for the associated production of a single top quark and a photon in proton-proton collisions at √s=13TeV, CMS-TOP-17-016, CERN-EP-2018-206
[17] CMS Collaboration, Phys. Rev. Lett.119, 242001 (2017)
[18] CMS Collaboration, Angular analysis of the decay B+ → K+µ+µ− in proton-proton collisions at √s=8TeV, CMS-BPH-15-001, CERN-EP-2018-125
[19] CMS Collaboration, Phys. Rev. Lett.121, 092002 (2018)
[20] CMS Collaboration, Search for black holes and sphalerons in high-multiplicity final states in proton-proton collisions at √s =13TeV, CMS-EXO-17-023, CERN-EP-2018-093
[21] CMS Collaboration, JHEP06, 120 (2018)
[22] CMS Collaboration, Search for resonances in the mass spectrum of muon pairs pro-duced in association with b quark jets in proton-proton collisions at √s=8and 13 TeV, CMS-HIG-16-017, CERN-EP-2018-204
[23] CMS Collaboration, CMS Supersymmetry Physics Results,
https://twiki.cern.ch/twiki/bin/view/CMSPublic/SUSYSummary2017
![Figure 1. Distribution of the decimal logarithm of the ratio between the expected signal and the sumdistributions (center plot) [of the expected signal and expected background(left plot) [6]](https://thumb-us.123doks.com/thumbv2/123dok_us/8014714.1332602/2.482.63.421.376.487/figure-distribution-logarithm-expected-sumdistributions-expected-expected-background.webp)
![Figure 2. Left plot shows the distribution of events as a function of the decimal logarithm ofRight plot: Best fit value of the S/B [7]](https://thumb-us.123doks.com/thumbv2/123dok_us/8014714.1332602/3.482.72.397.369.506/figure-shows-distribution-events-function-decimal-logarithm-ofright.webp)
![Figure 4. Summary plot of the fit to the per-production mode (left) [11] and per-decay mode (right)signal strength modifiers [11]](https://thumb-us.123doks.com/thumbv2/123dok_us/8014714.1332602/4.482.101.408.365.538/figure-summary-production-decay-right-signal-strength-modiers.webp)
![Figure 5. Left plot: top quark pair production total cross section vs. center of mass energy [plot: summary of ATLAS and CMS measurements of the single top quark production cross-sections invarious channels as a function of the center of mass energy [12]](https://thumb-us.123doks.com/thumbv2/123dok_us/8014714.1332602/5.482.72.408.401.519/figure-production-measurements-production-sections-invarious-channels-function.webp)
![Figure 6. Left plot: Comparison of the measured Rt-ch. (dotted line) with the prediction from differentPDF sets [14]](https://thumb-us.123doks.com/thumbv2/123dok_us/8014714.1332602/6.482.84.407.124.254/figure-left-plot-comparison-measured-dotted-prediction-dierentpdf.webp)